Races in Joppatowne, Maryland (MD) Detailed Stats
Data:
Races - White alone (%)
Races - White alone (% change since 2000)
Races - Black alone (%)
Races - Black alone (% change since 2000)
Races - American Indian alone (%)
Races - American Indian alone (% change since 2000)
Races - Asian alone (%)
Races - Asian alone (% change since 2000)
Races - Hispanic (%)
Races - Hispanic (% change since 2000)
Races - Native Hawaiian and Other Pacific Islander alone (%)
Races - Native Hawaiian and Other Pacific Islander alone (% change since 2000)
Races - Two or more races(%)
Races - Two or more races(% change since 2000)
Races - Other race alone (%)
Races - Other race alone (% change since 2000)
Racial diversity
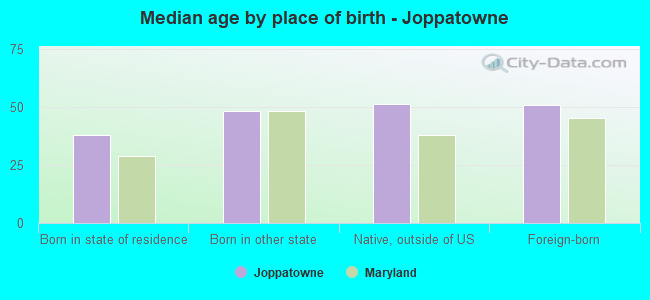
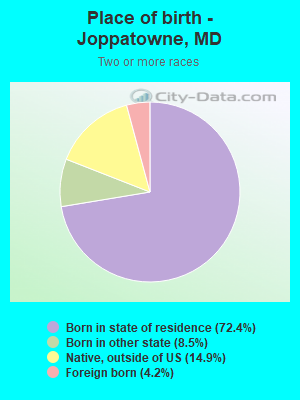
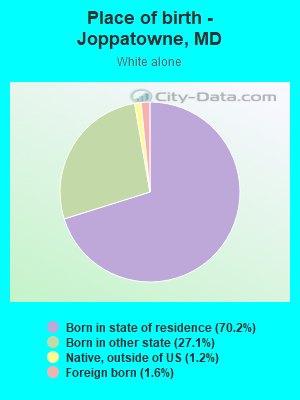
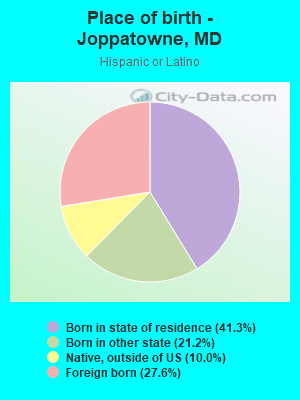
Place of birth - Born in state of residence (%)
Place of birth - Born in state of residence (%) - White
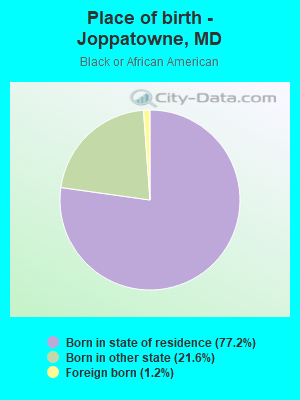
Place of birth - Born in state of residence (%) - Black or African American
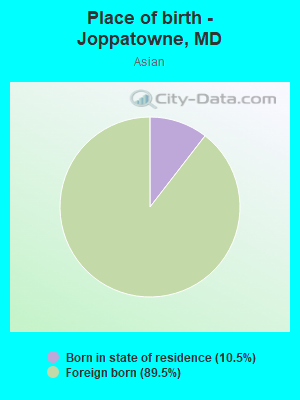
Place of birth - Born in state of residence (%) - Asian
Place of birth - Born in state of residence (%) - Hispanic or Latino
Place of birth - Born in state of residence (%) - American Indian and Alaska Native
Place of birth - Born in state of residence (%) - Multirace
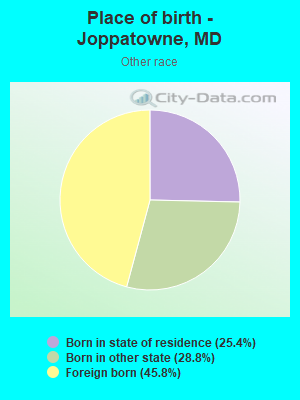
Place of birth - Born in state of residence (%) - Other Race
Place of birth - Born in other state (%)
Place of birth - Born in other state (%) - White
Place of birth - Born in other state (%) - Black or African American
Place of birth - Born in other state (%) - Asian
Place of birth - Born in other state (%) - Hispanic or Latino
Place of birth - Born in other state (%) - American Indian and Alaska Native
Place of birth - Born in other state (%) - Multirace
Place of birth - Born in other state (%) - Other Race
Place of birth - Native, outside of US (%)
Place of birth - Native, outside of US (%) - White
Place of birth - Native, outside of US (%) - Black or African American
Place of birth - Native, outside of US (%) - Asian
Place of birth - Native, outside of US (%) - Hispanic or Latino
Place of birth - Native, outside of US (%) - American Indian and Alaska Native
Place of birth - Native, outside of US (%) - Multirace
Place of birth - Native, outside of US (%) - Other Race
Place of birth - Foreign born (%)
Place of birth - Foreign born (%) - White
Place of birth - Foreign born (%) - Black or African American
Place of birth - Foreign born (%) - Asian
Place of birth - Foreign born (%) - Hispanic or Latino
Place of birth - Foreign born (%) - American Indian and Alaska Native
Place of birth - Foreign born (%) - Multirace
Place of birth - Foreign born (%) - Other Race
Residents speaking English at home (%)
Residents speaking English at home - Born in the United States (%)
Residents speaking English at home - Native, born elsewhere (%)
Residents speaking English at home - Foreign born (%)
Residents speaking Spanish at home (%)
Residents speaking Spanish at home - Born in the United States (%)
Residents speaking Spanish at home - Native, born elsewhere (%)
Residents speaking Spanish at home - Foreign born (%)
Residents speaking other language at home (%)
Residents speaking other language at home - Born in the United States (%)
Residents speaking other language at home - Native, born elsewhere (%)
Residents speaking other language at home - Foreign born (%)
Marital status - Never married (%)
Marital status - Now married (%)
Marital status - Separated (%)
Marital status - Widowed (%)
Marital status - Divorced (%)
Ancestries Reported - Arab (%)
Ancestries Reported - Czech (%)
Ancestries Reported - Danish (%)
Ancestries Reported - Dutch (%)
Ancestries Reported - English (%)
Ancestries Reported - French (%)
Ancestries Reported - French Canadian (%)
Ancestries Reported - German (%)
Ancestries Reported - Greek (%)
Ancestries Reported - Hungarian (%)
Ancestries Reported - Irish (%)
Ancestries Reported - Italian (%)
Ancestries Reported - Lithuanian (%)
Ancestries Reported - Norwegian (%)
Ancestries Reported - Polish (%)
Ancestries Reported - Portuguese (%)
Ancestries Reported - Russian (%)
Ancestries Reported - Scotch-Irish (%)
Ancestries Reported - Scottish (%)
Ancestries Reported - Slovak (%)
Ancestries Reported - Subsaharan African (%)
Ancestries Reported - Swedish (%)
Ancestries Reported - Swiss (%)
Ancestries Reported - Ukrainian (%)
Ancestries Reported - United States (%)
Ancestries Reported - Welsh (%)
Ancestries Reported - West Indian (%)
Ancestries Reported - Other (%)
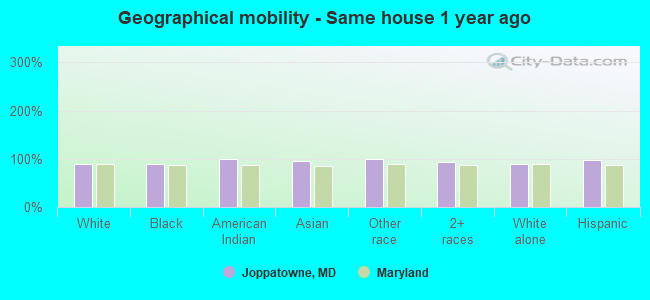
Geographical mobility - Same house 1 year ago (%)
Geographical mobility - Same house 1 year ago (%) - White
Geographical mobility - Same house 1 year ago (%) - Black or African American
Geographical mobility - Same house 1 year ago (%) - Asian
Geographical mobility - Same house 1 year ago (%) - Hispanic or Latino
Geographical mobility - Same house 1 year ago (%) - American Indian and Alaska Native
Geographical mobility - Same house 1 year ago (%) - Multirace
Geographical mobility - Same house 1 year ago (%) - Other Race
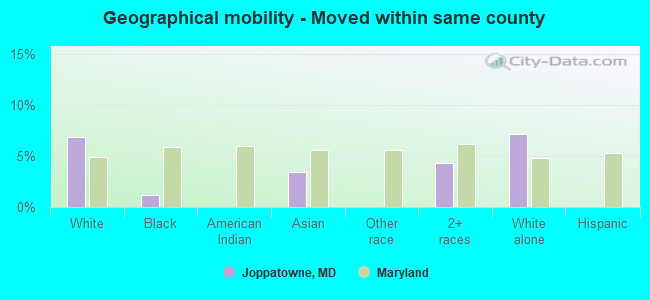
Geographical mobility - Moved within same county (%)
Geographical mobility - Moved within same county (%) - White
Geographical mobility - Moved within same county (%) - Black or African American
Geographical mobility - Moved within same county (%) - Asian
Geographical mobility - Moved within same county (%) - Hispanic or Latino
Geographical mobility - Moved within same county (%) - American Indian and Alaska Native
Geographical mobility - Moved within same county (%) - Multirace
Geographical mobility - Moved within same county (%) - Other Race
Geographical mobility - Moved from different county within same state (%)
Geographical mobility - Moved from different county within same state (%) - White
Geographical mobility - Moved from different county within same state (%) - Black or African American
Geographical mobility - Moved from different county within same state (%) - Asian
Geographical mobility - Moved from different county within same state (%) - Hispanic or Latino
Geographical mobility - Moved from different county within same state (%) - American Indian and Alaska Native
Geographical mobility - Moved from different county within same state (%) - Multirace
Geographical mobility - Moved from different county within same state (%) - Other Race
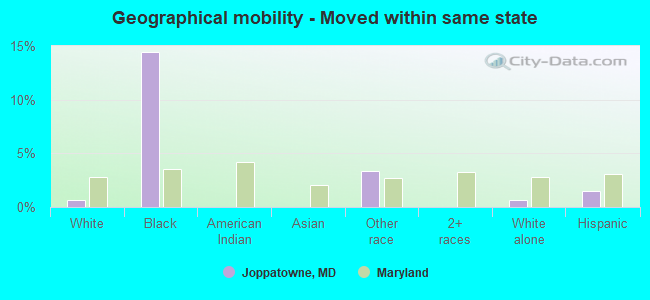
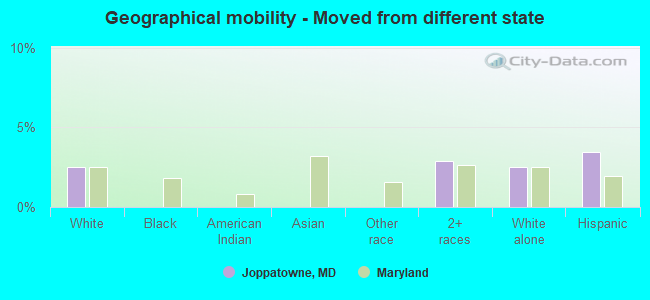
Geographical mobility - Moved from different state (%)
Geographical mobility - Moved from different state (%) - White
Geographical mobility - Moved from different state (%) - Black or African American
Geographical mobility - Moved from different state (%) - Asian
Geographical mobility - Moved from different state (%) - Hispanic or Latino
Geographical mobility - Moved from different state (%) - American Indian and Alaska Native
Geographical mobility - Moved from different state (%) - Multirace
Geographical mobility - Moved from different state (%) - Other Race
Geographical mobility - Moved from abroad (%)
Geographical mobility - Moved from abroad (%) - White
Geographical mobility - Moved from abroad (%) - Black or African American
Geographical mobility - Moved from abroad (%) - Asian
Geographical mobility - Moved from abroad (%) - Hispanic or Latino
Geographical mobility - Moved from abroad (%) - American Indian and Alaska Native
Geographical mobility - Moved from abroad (%) - Multirace
Geographical mobility - Moved from abroad (%) - Other Race
Place of birth for the foreign-born population - Ireland (%)
Place of birth for the foreign-born population - Denmark (%)
Place of birth for the foreign-born population - Norway (%)
Place of birth for the foreign-born population - Sweden (%)
Place of birth for the foreign-born population - United Kingdom (%)
Place of birth for the foreign-born population - England (%)
Place of birth for the foreign-born population - Scotland (%)
Place of birth for the foreign-born population - Other Northern Europe (%)
Place of birth for the foreign-born population - Austria (%)
Place of birth for the foreign-born population - Belgium (%)
Place of birth for the foreign-born population - France (%)
Place of birth for the foreign-born population - Germany (%)
Place of birth for the foreign-born population - Netherlands (%)
Place of birth for the foreign-born population - Switzerland (%)
Place of birth for the foreign-born population - Other Western Europe (%)
Place of birth for the foreign-born population - Greece (%)
Place of birth for the foreign-born population - Italy (%)
Place of birth for the foreign-born population - Portugal (%)
Place of birth for the foreign-born population - Spain (%)
Place of birth for the foreign-born population - Other Southern Europe (%)
Place of birth for the foreign-born population - Albania (%)
Place of birth for the foreign-born population - Belarus (%)
Place of birth for the foreign-born population - Bosnia and Herzegovina (%)
Place of birth for the foreign-born population - Bulgaria (%)
Place of birth for the foreign-born population - Croatia (%)
Place of birth for the foreign-born population - Czechoslovakia (%)
Place of birth for the foreign-born population - Hungary (%)
Place of birth for the foreign-born population - Latvia (%)
Place of birth for the foreign-born population - Lithuania (%)
Place of birth for the foreign-born population - North Macedonia (Macedonia) (%)
Place of birth for the foreign-born population - Moldova (%)
Place of birth for the foreign-born population - Poland (%)
Place of birth for the foreign-born population - Romania (%)
Place of birth for the foreign-born population - Russia (%)
Place of birth for the foreign-born population - Serbia (%)
Place of birth for the foreign-born population - Ukraine (%)
Place of birth for the foreign-born population - Other Eastern Europe (%)
Place of birth for the foreign-born population - China (%)
Place of birth for the foreign-born population - Hong Kong (%)
Place of birth for the foreign-born population - Taiwan (%)
Place of birth for the foreign-born population - Japan (%)
Place of birth for the foreign-born population - Korea (%)
Place of birth for the foreign-born population - Other Eastern Asia (%)
Place of birth for the foreign-born population - Afghanistan (%)
Place of birth for the foreign-born population - Bangladesh (%)
Place of birth for the foreign-born population - India (%)
Place of birth for the foreign-born population - Iran (%)
Place of birth for the foreign-born population - Kazakhstan (%)
Place of birth for the foreign-born population - Nepal (%)
Place of birth for the foreign-born population - Pakistan (%)
Place of birth for the foreign-born population - Sri Lanka (%)
Place of birth for the foreign-born population - Uzbekistan (%)
Place of birth for the foreign-born population - Other South Central Asia (%)
Place of birth for the foreign-born population - Burma (%)
Place of birth for the foreign-born population - Cambodia (%)
Place of birth for the foreign-born population - Indonesia (%)
Place of birth for the foreign-born population - Laos (%)
Place of birth for the foreign-born population - Malaysia (%)
Place of birth for the foreign-born population - Philippines (%)
Place of birth for the foreign-born population - Singapore (%)
Place of birth for the foreign-born population - Thailand (%)
Place of birth for the foreign-born population - Vietnam (%)
Place of birth for the foreign-born population - Other South Eastern Asia (%)
Place of birth for the foreign-born population - Armenia (%)
Place of birth for the foreign-born population - Iraq (%)
Place of birth for the foreign-born population - Israel (%)
Place of birth for the foreign-born population - Jordan (%)
Place of birth for the foreign-born population - Kuwait (%)
Place of birth for the foreign-born population - Lebanon (%)
Place of birth for the foreign-born population - Saudi Arabia (%)
Place of birth for the foreign-born population - Syria (%)
Place of birth for the foreign-born population - Turkey (%)
Place of birth for the foreign-born population - Yemen (%)
Place of birth for the foreign-born population - Other Western Asia (%)
Place of birth for the foreign-born population - Eritrea (%)
Place of birth for the foreign-born population - Ethiopia (%)
Place of birth for the foreign-born population - Kenya (%)
Place of birth for the foreign-born population - Somalia (%)
Place of birth for the foreign-born population - Uganda (%)
Place of birth for the foreign-born population - Zimbabwe (%)
Place of birth for the foreign-born population - Other Eastern Africa (%)
Place of birth for the foreign-born population - Cameroon (%)
Place of birth for the foreign-born population - Congo (%)
Place of birth for the foreign-born population - Democratic Republic of Congo (Zaire) (%)
Place of birth for the foreign-born population - Other Middle Africa (%)
Place of birth for the foreign-born population - Egypt (%)
Place of birth for the foreign-born population - Morocco (%)
Place of birth for the foreign-born population - Sudan (%)
Place of birth for the foreign-born population - Other Northern Africa (%)
Place of birth for the foreign-born population - South Africa (%)
Place of birth for the foreign-born population - Other Southern Africa (%)
Place of birth for the foreign-born population - Cabo Verde (%)
Place of birth for the foreign-born population - Ghana (%)
Place of birth for the foreign-born population - Liberia (%)
Place of birth for the foreign-born population - Nigeria (%)
Place of birth for the foreign-born population - Senegal (%)
Place of birth for the foreign-born population - Sierra Leone (%)
Place of birth for the foreign-born population - Other Western Africa (%)
Place of birth for the foreign-born population - Australia (%)
Place of birth for the foreign-born population - New Zealand (%)
Place of birth for the foreign-born population - Fiji (%)
Place of birth for the foreign-born population - Micronesia (%)
Place of birth for the foreign-born population - Bahamas (%)
Place of birth for the foreign-born population - Barbados (%)
Place of birth for the foreign-born population - Cuba (%)
Place of birth for the foreign-born population - Dominica (%)
Place of birth for the foreign-born population - Dominican Republic (%)
Place of birth for the foreign-born population - Grenada (%)
Place of birth for the foreign-born population - Haiti (%)
Place of birth for the foreign-born population - Jamaica (%)
Place of birth for the foreign-born population - St. Vincent and the Grenadines (%)
Place of birth for the foreign-born population - Trinidad and Tobago (%)
Place of birth for the foreign-born population - West Indies (%)
Place of birth for the foreign-born population - Other Caribbean (%)
Place of birth for the foreign-born population - Belize (%)
Place of birth for the foreign-born population - Costa Rica (%)
Place of birth for the foreign-born population - El Salvador (%)
Place of birth for the foreign-born population - Guatemala (%)
Place of birth for the foreign-born population - Honduras (%)
Place of birth for the foreign-born population - Mexico (%)
Place of birth for the foreign-born population - Nicaragua (%)
Place of birth for the foreign-born population - Panama (%)
Place of birth for the foreign-born population - Other Central America (%)
Place of birth for the foreign-born population - Argentina (%)
Place of birth for the foreign-born population - Bolivia (%)
Place of birth for the foreign-born population - Brazil (%)
Place of birth for the foreign-born population - Chile (%)
Place of birth for the foreign-born population - Colombia (%)
Place of birth for the foreign-born population - Ecuador (%)
Place of birth for the foreign-born population - Guyana (%)
Place of birth for the foreign-born population - Peru (%)
Place of birth for the foreign-born population - Uruguay (%)
Place of birth for the foreign-born population - Venezuela (%)
Place of birth for the foreign-born population - Other South America (%)
Place of birth for the foreign-born population - Canada (%)
Place of birth for the foreign-born population - Other Northern America (%)
Place of birth for the foreign-born population - Other (%)
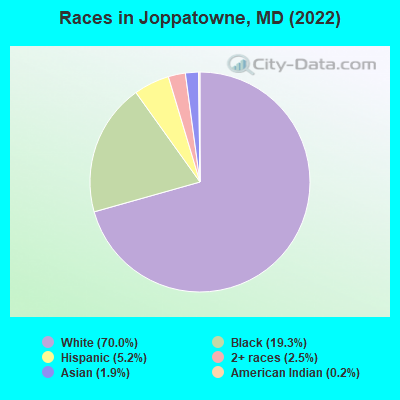
According to 2022 data, the most numerous races in Joppatowne, MD are White alone (9,480 residents), Black alone (2,613 residents), and Hispanic (701 residents). 93.2% of Joppatowne residents speak English at home. 4.1% of Joppatowne, MD residents are foreign-born (1.6% born in Asia, 1.2% born in Latin America, 0.8% born in Europe), which is 292.3% less than the foreign-born rate of 16.0% across the entire state of Maryland.
Race distribution in Joppatowne
2000 2022
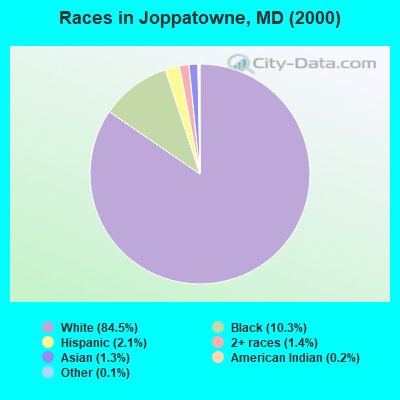
3,286,547 62.1% White alone 1,464,735 27.7% Black alone 227,916 4.3% Hispanic 209,738 4.0% Asian alone 82,946 1.6% Two or more races 13,312 0.3% American Indian alone 9,379 0.2% Other race alone 1,913 0.04% Native Hawaiian and Other
2,906,492 47.1% White alone 1,800,914 29.2% Black alone 705,842 11.4% Hispanic 401,818 6.5% Asian alone 291,317 4.7% Two or more races 46,930 0.8% Other race alone 8,930 0.1% American Indian alone 2,417 0.04% Native Hawaiian and Other
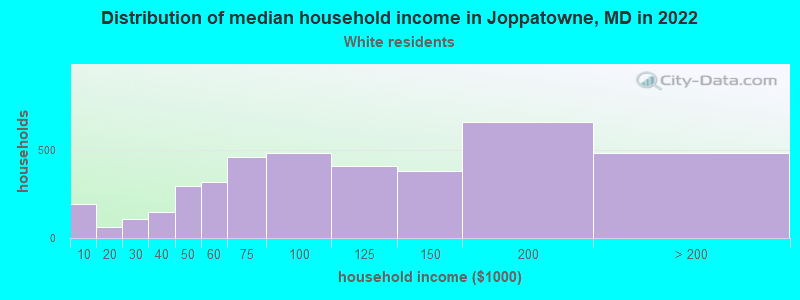
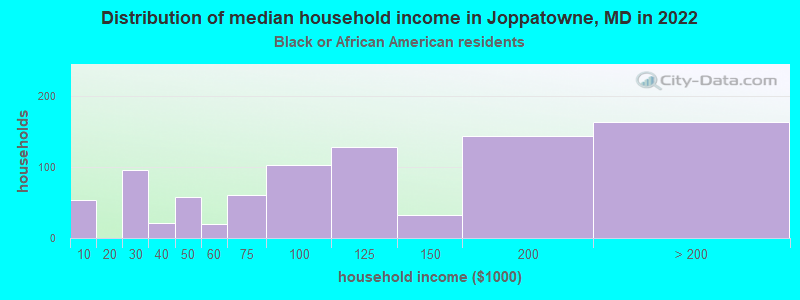
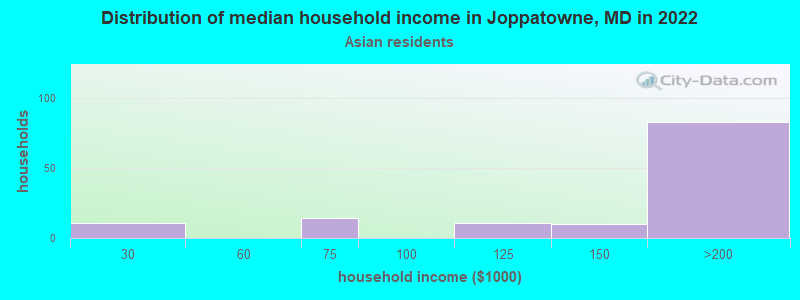
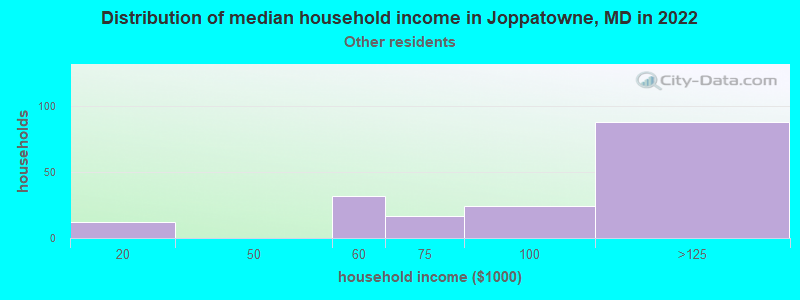
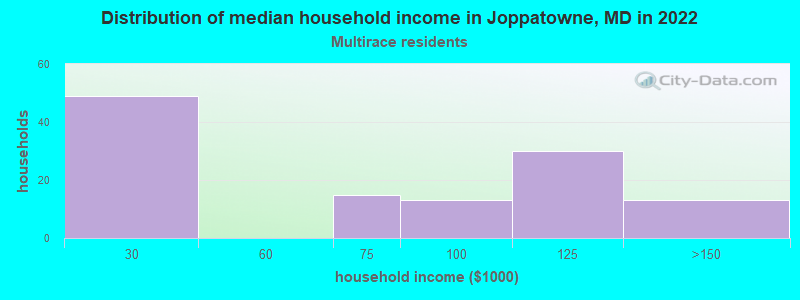
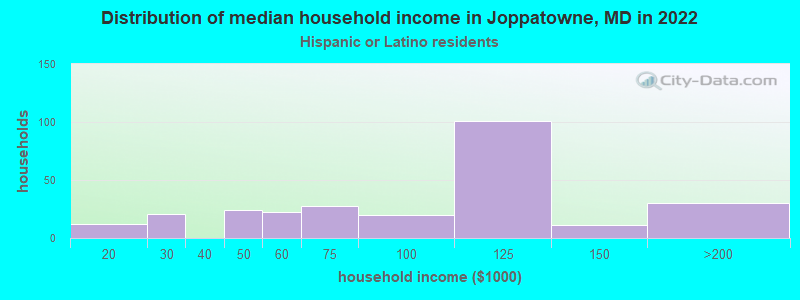
Income and house value in Joppatowne Median household income in 2022 $97,492 White non-Hispanic householders$107,415 Black householders$138,999 Asian householders$94,026 Some other race householders$63,502 Hispanic or Latino race householdersMedian 2022 house value $315,333 White Non-Hispanic householders$311,692 Black or African American householders$667,565 American Indian or Alaska Native householders $455,158 Asian householders$333,782 Two or more races householders$300,525 Hispanic or Latino householders
Median age by race in Joppatowne
47.1 Median age for White residents47.1 47.1 35.5 Median age for Black or African American residents34.3 38.0 -647,863,247.2 Median age for American Indian / Alaska Native residents-642,487,046.0 -676,818,950.3 44.8 Median age for Asian residents45.4 49.7 -763,333,332.6 Median age for Native Hawaiian / Pacific Islander residents-666,666,666.0 -760,942,760.2 35.0 Median age for Other race residents46.4 27.8 17.6 Median age for Two or more races residents24.4 11.1 47.1 Median age for White alone residents47.2 47.2 33.9 Median age for Hispanic or Latino residents42.1 25.6
Owner/renter occupied households by race in Joppatowne
House owners and renters - White residents 3,159 78.5% Owner occupied867 21.5% Renter occupiedHouse owners and renters - Black or African American residents 702 80.0% Owner occupied176 20.0% Renter occupiedHouse owners and renters - American Indian / Alaska Native residents 31 100.0% Owner occupiedHouse owners and renters - Asian residents 91 61.7% Owner occupied56 38.3% Renter occupiedHouse owners and renters - Other race residents 80 47.1% Owner occupied89 52.9% Renter occupiedHouse owners and renters - Two or more races residents 130 100.0% Owner occupiedHouse owners and renters - White alone residents 3,138 79.0% Owner occupied834 21.0% Renter occupiedHouse owners and renters - Hispanic or Latino residents 161 54.4% Owner occupied135 45.6% Renter occupied
Language usage in Joppatowne
English speakers - Total 93.2% of residents of Joppatowne speak English at home.
3.6% of residents speak Spanish at home 348 76.8% Speak English very well105 23.2% Speak English less than very well3.2% of residents speak other language at home 262 63.4% Speak English very well151 36.6% Speak English less than very well
English speakers - Born in the United States 95.2% of residents of Joppatowne speak English at home.
3.5% of residents speak Spanish at home 113 100.0% Speak English very well0.9% of residents speak other language at home 28 100.0% Speak English very well
English speakers - Native, born elsewhere 75.1% of residents of Joppatowne speak English at home.
40.1% of residents speak Spanish at home 58 73.4% Speak English very well21 26.6% Speak English less than very well
English speakers - Foreign-born 20.5% of residents of Joppatowne speak English at home.
30.0% of residents speak Spanish at home 112 60.2% Speak English very well74 39.8% Speak English less than very well45.1% of residents speak other language at home 157 56.3% Speak English very well122 43.7% Speak English less than very well
White (Caucasian) - Speak only English Native:
98.5% (8,819)Foreign-born:
38.8% (70)
White (Caucasian) - Speak another language Native:
1.5% (133)Foreign-born:
59.6% (108)
Black or African American - Speak only English Native:
99.8% (2,341)Foreign-born:
24.9% (8)
Black or African American - Speak another language Native:
0.7% (17)Foreign-born:
74.2% (23)
Asian - Speak another language Native:
94.0% (23)Foreign-born:
69.9% (172)
Other race - Speak another language Native:
73.3% (137)Foreign-born:
97.2% (170)
Two or more races - Speak another language Native:
15.9% (73)Foreign-born:
94.1% (25)
White alone - Speak only English Native:
98.5% (8,739)Foreign-born:
54.9% (82)
White alone - Speak another language Native:
1.3% (119)Foreign-born:
47.3% (71)
Hispanic or Latino - Speak another language Native:
44.3% (208)Foreign-born:
100.0% (192)
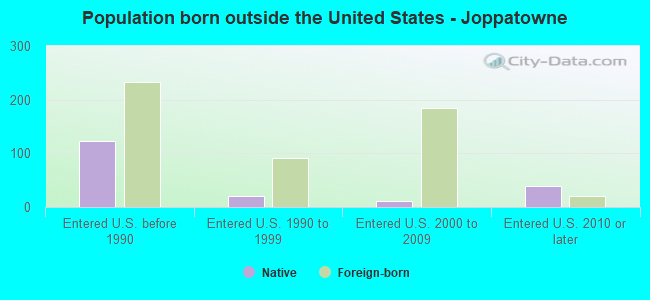
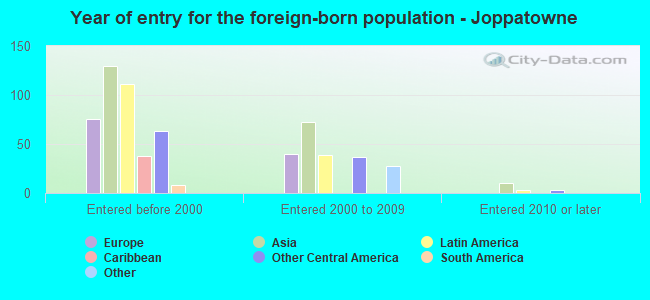
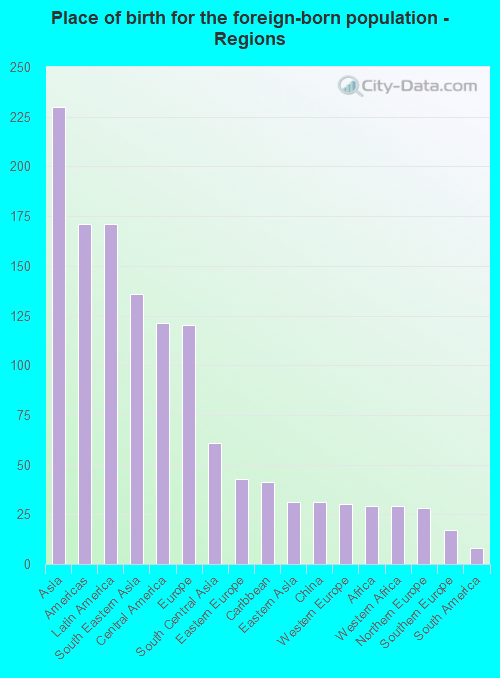
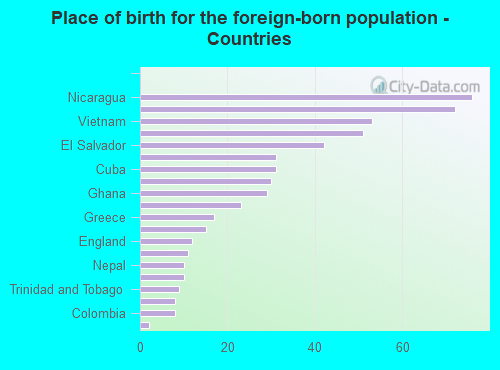
Foreign-born residents in Joppatowne 552 residents are foreign born (1.6% Asia , 1.2% Latin America , 0.8% Europe ).
This city:
4.1%Maryland:
15.7%
Marital status for residents in Joppatowne Marital status - White (Caucasian) population 15 years and over
Males 31.5% Never married56.0% Now married0.5% Separated2.4% Widowed9.6% DivorcedFemales 27.7% Never married48.6% Now married0.3% Separated12.6% Widowed10.8% DivorcedWomen who gave birth in the past 12 months Now married:
42.2% (55)Unmarried:
57.8% (75)
Women who did not give birth in the past 12 months Now married:
37.6% (748)Unmarried:
62.4% (1,240)
Marital status - Black or African American population 15 years and over
Males 34.2% Never married57.3% Now married0.0% Separated0.0% Widowed8.5% DivorcedFemales 32.3% Never married57.3% Now married0.0% Separated0.9% Widowed9.5% DivorcedWomen who did not give birth in the past 12 months Now married:
60.2% (465)Unmarried:
39.8% (308)
Marital status - Asian population 15 years and over
Males 27.5% Never married72.5% Now married0.0% Separated0.0% Widowed0.0% DivorcedFemales 37.3% Never married50.0% Now married0.0% Separated12.7% Widowed0.0% DivorcedWomen who did not give birth in the past 12 months Now married:
26.5% (18)Unmarried:
73.5% (50)
Marital status - Other race population 15 years and over
Males 43.8% Never married56.3% Now married0.0% Separated0.0% Widowed0.0% DivorcedFemales 21.8% Never married66.8% Now married0.0% Separated11.4% Widowed0.0% DivorcedWomen who gave birth in the past 12 months Now married:
100.0% (28)Unmarried:
0.0% (0)
Women who did not give birth in the past 12 months Now married:
78.3% (149)Unmarried:
21.7% (41)
Marital status - Two or more races population 15 years and over
Males 45.5% Never married27.3% Now married0.0% Separated23.5% Widowed3.7% DivorcedFemales 21.4% Never married38.1% Now married38.1% Separated0.0% Widowed2.4% DivorcedWomen who did not give birth in the past 12 months Now married:
78.0% (39)Unmarried:
22.0% (11)
Marital status - White alone, not Hispanic / Latino population 15 years and over
Males 31.4% Never married56.0% Now married0.5% Separated2.5% Widowed9.8% DivorcedFemales 26.8% Never married49.1% Now married0.3% Separated12.9% Widowed11.0% DivorcedWomen who gave birth in the past 12 months Now married:
42.2% (55)Unmarried:
57.8% (76)
Women who did not give birth in the past 12 months Now married:
38.5% (750)Unmarried:
61.5% (1,199)
Marital status - Hispanic or Latino population 15 years and over
Males 47.0% Never married45.5% Now married0.0% Separated7.5% Widowed0.0% DivorcedFemales 33.3% Never married54.2% Now married5.0% Separated7.5% Widowed0.0% DivorcedWomen who gave birth in the past 12 months Now married:
100.0% (25)Unmarried:
0.0% (0)
Women who did not give birth in the past 12 months Now married:
63.0% (182)Unmarried:
37.0% (107)
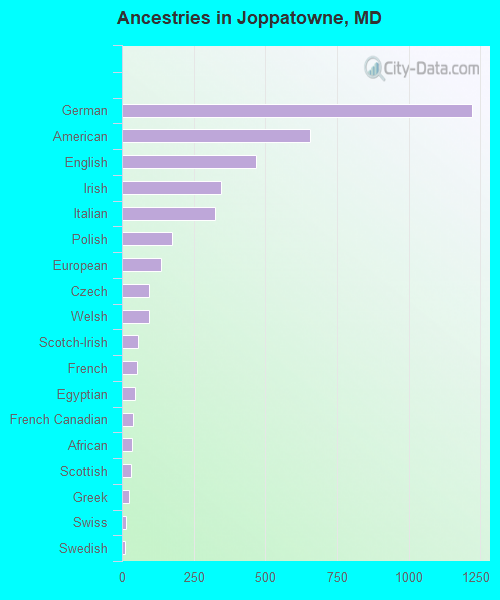
Ancestries in Joppatowne
1,219 18.3% German657 9.9% American467 7.0% English347 5.2% Irish323 4.8% Italian173 2.6% Polish137 2.1% European95 1.4% Czech94 1.4% Welsh55 0.8% Scotch-Irish52 0.8% French44 0.7% Egyptian38 0.6% French Canadian35 0.5% African33 0.5% Scottish26 0.4% Greek13 0.2% Swiss12 0.2% Swedish11 0.2% Norwegian10 0.2% Dutch5 0.08% British
Children Nativity (place of birth) in Joppatowne
Children under 6 years - Living with two parents Both parents native 585 100.0% NativeBoth parents foreign-born 21 100.0% NativeOne native, one foreign-born parent 4 100.0% NativeChildren under 6 years - Living with one parent Native parent 319 100.0% NativeChildren 6 to 17 years - Living with two parents Both parents native 790 95.3% Native39 4.7% Foreign-bornBoth parents foreign-born 39 100.0% NativeOne native, one foreign-born parent 23 100.0% NativeChildren 6 to 17 years - Living with one parent Native parent 328 100.0% Native
Grandparents responsible for own grandchildren in Joppatowne
Grandparents (30 to 59 years) White / Caucasian 41 46.5% Responsible for grandchildren47 53.5% Not responsible for grandchildrenBlack or African American 30 100.0% Responsible for grandchildrenWhite alone, not Hispanic / Latino 41 45.6% Responsible for grandchildren49 54.4% Not responsible for grandchildren
Grandparents (60 years and over) White / Caucasian 109 100.0% Not responsible for grandchildrenBlack or African American 11 100.0% Not responsible for grandchildrenWhite alone, not Hispanic / Latino 111 100.0% Not responsible for grandchildren