Races in Kankakee, Illinois (IL) Detailed Stats
Data:
Races - White alone (%)
Races - White alone (% change since 2000)
Races - Black alone (%)
Races - Black alone (% change since 2000)
Races - American Indian alone (%)
Races - American Indian alone (% change since 2000)
Races - Asian alone (%)
Races - Asian alone (% change since 2000)
Races - Hispanic (%)
Races - Hispanic (% change since 2000)
Races - Native Hawaiian and Other Pacific Islander alone (%)
Races - Native Hawaiian and Other Pacific Islander alone (% change since 2000)
Races - Two or more races(%)
Races - Two or more races(% change since 2000)
Races - Other race alone (%)
Races - Other race alone (% change since 2000)
Racial diversity
Place of birth - Born in state of residence (%)
Place of birth - Born in state of residence (%) - White
Place of birth - Born in state of residence (%) - Black or African American
Place of birth - Born in state of residence (%) - Asian
Place of birth - Born in state of residence (%) - Hispanic or Latino
Place of birth - Born in state of residence (%) - American Indian and Alaska Native
Place of birth - Born in state of residence (%) - Multirace
Place of birth - Born in state of residence (%) - Other Race
Place of birth - Born in other state (%)
Place of birth - Born in other state (%) - White
Place of birth - Born in other state (%) - Black or African American
Place of birth - Born in other state (%) - Asian
Place of birth - Born in other state (%) - Hispanic or Latino
Place of birth - Born in other state (%) - American Indian and Alaska Native
Place of birth - Born in other state (%) - Multirace
Place of birth - Born in other state (%) - Other Race
Place of birth - Native, outside of US (%)
Place of birth - Native, outside of US (%) - White
Place of birth - Native, outside of US (%) - Black or African American
Place of birth - Native, outside of US (%) - Asian
Place of birth - Native, outside of US (%) - Hispanic or Latino
Place of birth - Native, outside of US (%) - American Indian and Alaska Native
Place of birth - Native, outside of US (%) - Multirace
Place of birth - Native, outside of US (%) - Other Race
Place of birth - Foreign born (%)
Place of birth - Foreign born (%) - White
Place of birth - Foreign born (%) - Black or African American
Place of birth - Foreign born (%) - Asian
Place of birth - Foreign born (%) - Hispanic or Latino
Place of birth - Foreign born (%) - American Indian and Alaska Native
Place of birth - Foreign born (%) - Multirace
Place of birth - Foreign born (%) - Other Race
Residents speaking English at home (%)
Residents speaking English at home - Born in the United States (%)
Residents speaking English at home - Native, born elsewhere (%)
Residents speaking English at home - Foreign born (%)
Residents speaking Spanish at home (%)
Residents speaking Spanish at home - Born in the United States (%)
Residents speaking Spanish at home - Native, born elsewhere (%)
Residents speaking Spanish at home - Foreign born (%)
Residents speaking other language at home (%)
Residents speaking other language at home - Born in the United States (%)
Residents speaking other language at home - Native, born elsewhere (%)
Residents speaking other language at home - Foreign born (%)
Marital status - Never married (%)
Marital status - Now married (%)
Marital status - Separated (%)
Marital status - Widowed (%)
Marital status - Divorced (%)
Ancestries Reported - Arab (%)
Ancestries Reported - Czech (%)
Ancestries Reported - Danish (%)
Ancestries Reported - Dutch (%)
Ancestries Reported - English (%)
Ancestries Reported - French (%)
Ancestries Reported - French Canadian (%)
Ancestries Reported - German (%)
Ancestries Reported - Greek (%)
Ancestries Reported - Hungarian (%)
Ancestries Reported - Irish (%)
Ancestries Reported - Italian (%)
Ancestries Reported - Lithuanian (%)
Ancestries Reported - Norwegian (%)
Ancestries Reported - Polish (%)
Ancestries Reported - Portuguese (%)
Ancestries Reported - Russian (%)
Ancestries Reported - Scotch-Irish (%)
Ancestries Reported - Scottish (%)
Ancestries Reported - Slovak (%)
Ancestries Reported - Subsaharan African (%)
Ancestries Reported - Swedish (%)
Ancestries Reported - Swiss (%)
Ancestries Reported - Ukrainian (%)
Ancestries Reported - United States (%)
Ancestries Reported - Welsh (%)
Ancestries Reported - West Indian (%)
Ancestries Reported - Other (%)
Geographical mobility - Same house 1 year ago (%)
Geographical mobility - Same house 1 year ago (%) - White
Geographical mobility - Same house 1 year ago (%) - Black or African American
Geographical mobility - Same house 1 year ago (%) - Asian
Geographical mobility - Same house 1 year ago (%) - Hispanic or Latino
Geographical mobility - Same house 1 year ago (%) - American Indian and Alaska Native
Geographical mobility - Same house 1 year ago (%) - Multirace
Geographical mobility - Same house 1 year ago (%) - Other Race
Geographical mobility - Moved within same county (%)
Geographical mobility - Moved within same county (%) - White
Geographical mobility - Moved within same county (%) - Black or African American
Geographical mobility - Moved within same county (%) - Asian
Geographical mobility - Moved within same county (%) - Hispanic or Latino
Geographical mobility - Moved within same county (%) - American Indian and Alaska Native
Geographical mobility - Moved within same county (%) - Multirace
Geographical mobility - Moved within same county (%) - Other Race
Geographical mobility - Moved from different county within same state (%)
Geographical mobility - Moved from different county within same state (%) - White
Geographical mobility - Moved from different county within same state (%) - Black or African American
Geographical mobility - Moved from different county within same state (%) - Asian
Geographical mobility - Moved from different county within same state (%) - Hispanic or Latino
Geographical mobility - Moved from different county within same state (%) - American Indian and Alaska Native
Geographical mobility - Moved from different county within same state (%) - Multirace
Geographical mobility - Moved from different county within same state (%) - Other Race
Geographical mobility - Moved from different state (%)
Geographical mobility - Moved from different state (%) - White
Geographical mobility - Moved from different state (%) - Black or African American
Geographical mobility - Moved from different state (%) - Asian
Geographical mobility - Moved from different state (%) - Hispanic or Latino
Geographical mobility - Moved from different state (%) - American Indian and Alaska Native
Geographical mobility - Moved from different state (%) - Multirace
Geographical mobility - Moved from different state (%) - Other Race
Geographical mobility - Moved from abroad (%)
Geographical mobility - Moved from abroad (%) - White
Geographical mobility - Moved from abroad (%) - Black or African American
Geographical mobility - Moved from abroad (%) - Asian
Geographical mobility - Moved from abroad (%) - Hispanic or Latino
Geographical mobility - Moved from abroad (%) - American Indian and Alaska Native
Geographical mobility - Moved from abroad (%) - Multirace
Geographical mobility - Moved from abroad (%) - Other Race
Place of birth for the foreign-born population - Ireland (%)
Place of birth for the foreign-born population - Denmark (%)
Place of birth for the foreign-born population - Norway (%)
Place of birth for the foreign-born population - Sweden (%)
Place of birth for the foreign-born population - United Kingdom (%)
Place of birth for the foreign-born population - England (%)
Place of birth for the foreign-born population - Scotland (%)
Place of birth for the foreign-born population - Other Northern Europe (%)
Place of birth for the foreign-born population - Austria (%)
Place of birth for the foreign-born population - Belgium (%)
Place of birth for the foreign-born population - France (%)
Place of birth for the foreign-born population - Germany (%)
Place of birth for the foreign-born population - Netherlands (%)
Place of birth for the foreign-born population - Switzerland (%)
Place of birth for the foreign-born population - Other Western Europe (%)
Place of birth for the foreign-born population - Greece (%)
Place of birth for the foreign-born population - Italy (%)
Place of birth for the foreign-born population - Portugal (%)
Place of birth for the foreign-born population - Spain (%)
Place of birth for the foreign-born population - Other Southern Europe (%)
Place of birth for the foreign-born population - Albania (%)
Place of birth for the foreign-born population - Belarus (%)
Place of birth for the foreign-born population - Bosnia and Herzegovina (%)
Place of birth for the foreign-born population - Bulgaria (%)
Place of birth for the foreign-born population - Croatia (%)
Place of birth for the foreign-born population - Czechoslovakia (%)
Place of birth for the foreign-born population - Hungary (%)
Place of birth for the foreign-born population - Latvia (%)
Place of birth for the foreign-born population - Lithuania (%)
Place of birth for the foreign-born population - North Macedonia (Macedonia) (%)
Place of birth for the foreign-born population - Moldova (%)
Place of birth for the foreign-born population - Poland (%)
Place of birth for the foreign-born population - Romania (%)
Place of birth for the foreign-born population - Russia (%)
Place of birth for the foreign-born population - Serbia (%)
Place of birth for the foreign-born population - Ukraine (%)
Place of birth for the foreign-born population - Other Eastern Europe (%)
Place of birth for the foreign-born population - China (%)
Place of birth for the foreign-born population - Hong Kong (%)
Place of birth for the foreign-born population - Taiwan (%)
Place of birth for the foreign-born population - Japan (%)
Place of birth for the foreign-born population - Korea (%)
Place of birth for the foreign-born population - Other Eastern Asia (%)
Place of birth for the foreign-born population - Afghanistan (%)
Place of birth for the foreign-born population - Bangladesh (%)
Place of birth for the foreign-born population - India (%)
Place of birth for the foreign-born population - Iran (%)
Place of birth for the foreign-born population - Kazakhstan (%)
Place of birth for the foreign-born population - Nepal (%)
Place of birth for the foreign-born population - Pakistan (%)
Place of birth for the foreign-born population - Sri Lanka (%)
Place of birth for the foreign-born population - Uzbekistan (%)
Place of birth for the foreign-born population - Other South Central Asia (%)
Place of birth for the foreign-born population - Burma (%)
Place of birth for the foreign-born population - Cambodia (%)
Place of birth for the foreign-born population - Indonesia (%)
Place of birth for the foreign-born population - Laos (%)
Place of birth for the foreign-born population - Malaysia (%)
Place of birth for the foreign-born population - Philippines (%)
Place of birth for the foreign-born population - Singapore (%)
Place of birth for the foreign-born population - Thailand (%)
Place of birth for the foreign-born population - Vietnam (%)
Place of birth for the foreign-born population - Other South Eastern Asia (%)
Place of birth for the foreign-born population - Armenia (%)
Place of birth for the foreign-born population - Iraq (%)
Place of birth for the foreign-born population - Israel (%)
Place of birth for the foreign-born population - Jordan (%)
Place of birth for the foreign-born population - Kuwait (%)
Place of birth for the foreign-born population - Lebanon (%)
Place of birth for the foreign-born population - Saudi Arabia (%)
Place of birth for the foreign-born population - Syria (%)
Place of birth for the foreign-born population - Turkey (%)
Place of birth for the foreign-born population - Yemen (%)
Place of birth for the foreign-born population - Other Western Asia (%)
Place of birth for the foreign-born population - Eritrea (%)
Place of birth for the foreign-born population - Ethiopia (%)
Place of birth for the foreign-born population - Kenya (%)
Place of birth for the foreign-born population - Somalia (%)
Place of birth for the foreign-born population - Uganda (%)
Place of birth for the foreign-born population - Zimbabwe (%)
Place of birth for the foreign-born population - Other Eastern Africa (%)
Place of birth for the foreign-born population - Cameroon (%)
Place of birth for the foreign-born population - Congo (%)
Place of birth for the foreign-born population - Democratic Republic of Congo (Zaire) (%)
Place of birth for the foreign-born population - Other Middle Africa (%)
Place of birth for the foreign-born population - Egypt (%)
Place of birth for the foreign-born population - Morocco (%)
Place of birth for the foreign-born population - Sudan (%)
Place of birth for the foreign-born population - Other Northern Africa (%)
Place of birth for the foreign-born population - South Africa (%)
Place of birth for the foreign-born population - Other Southern Africa (%)
Place of birth for the foreign-born population - Cabo Verde (%)
Place of birth for the foreign-born population - Ghana (%)
Place of birth for the foreign-born population - Liberia (%)
Place of birth for the foreign-born population - Nigeria (%)
Place of birth for the foreign-born population - Senegal (%)
Place of birth for the foreign-born population - Sierra Leone (%)
Place of birth for the foreign-born population - Other Western Africa (%)
Place of birth for the foreign-born population - Australia (%)
Place of birth for the foreign-born population - New Zealand (%)
Place of birth for the foreign-born population - Fiji (%)
Place of birth for the foreign-born population - Micronesia (%)
Place of birth for the foreign-born population - Bahamas (%)
Place of birth for the foreign-born population - Barbados (%)
Place of birth for the foreign-born population - Cuba (%)
Place of birth for the foreign-born population - Dominica (%)
Place of birth for the foreign-born population - Dominican Republic (%)
Place of birth for the foreign-born population - Grenada (%)
Place of birth for the foreign-born population - Haiti (%)
Place of birth for the foreign-born population - Jamaica (%)
Place of birth for the foreign-born population - St. Vincent and the Grenadines (%)
Place of birth for the foreign-born population - Trinidad and Tobago (%)
Place of birth for the foreign-born population - West Indies (%)
Place of birth for the foreign-born population - Other Caribbean (%)
Place of birth for the foreign-born population - Belize (%)
Place of birth for the foreign-born population - Costa Rica (%)
Place of birth for the foreign-born population - El Salvador (%)
Place of birth for the foreign-born population - Guatemala (%)
Place of birth for the foreign-born population - Honduras (%)
Place of birth for the foreign-born population - Mexico (%)
Place of birth for the foreign-born population - Nicaragua (%)
Place of birth for the foreign-born population - Panama (%)
Place of birth for the foreign-born population - Other Central America (%)
Place of birth for the foreign-born population - Argentina (%)
Place of birth for the foreign-born population - Bolivia (%)
Place of birth for the foreign-born population - Brazil (%)
Place of birth for the foreign-born population - Chile (%)
Place of birth for the foreign-born population - Colombia (%)
Place of birth for the foreign-born population - Ecuador (%)
Place of birth for the foreign-born population - Guyana (%)
Place of birth for the foreign-born population - Peru (%)
Place of birth for the foreign-born population - Uruguay (%)
Place of birth for the foreign-born population - Venezuela (%)
Place of birth for the foreign-born population - Other South America (%)
Place of birth for the foreign-born population - Canada (%)
Place of birth for the foreign-born population - Other Northern America (%)
Place of birth for the foreign-born population - Other (%)
Latest news about races in Kankakee, IL collected exclusively by city-data.com from local newspapers, TV, and radio stations
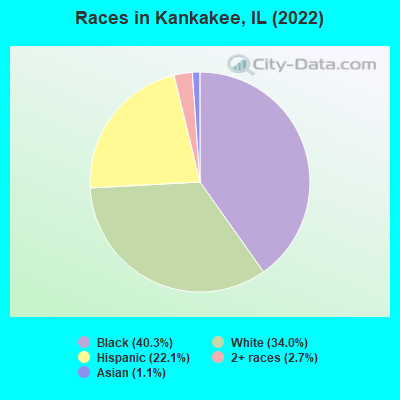
According to 2022 data, the most numerous races in Kankakee, IL are White alone (8,331 residents), Hispanic (5,402 residents), and Black alone (9,875 residents). 78.6% of Kankakee residents speak English at home. 11.1% of Kankakee, IL residents are foreign-born (9.7% born in Latin America), which is 26.6% less than the foreign-born rate of 14.0% across the entire state of Illinois.
Race distribution in Kankakee
2000 2022
8,424,140 67.8% White alone 1,856,152 14.9% Black alone 1,530,262 12.3% Hispanic 419,916 3.4% Asian alone 153,996 1.2% Two or more races 13,479 0.1% Other race alone 18,232 0.1% American Indian alone 3,116 0.03% Native Hawaiian and Other
7,356,301 58.5% White alone 2,299,726 18.3% Hispanic 1,660,423 13.2% Black alone 747,296 5.9% Asian alone 458,599 3.6% Two or more races 45,386 0.4% Other race alone 10,405 0.08% American Indian alone 3,896 0.03% Native Hawaiian and Other
Income and house value in Kankakee Median household income in 2022 $61,877 White non-Hispanic householders$23,200 Black householders$98,575 Some other race householders$66,280 Two or more races householders$54,815 Hispanic or Latino race householdersMedian 2022 house value $123,671 White Non-Hispanic householders$95,536 Black or African American householders$42,512 American Indian or Alaska Native householders $196,019 Asian householders$101,101 Some other race householders$134,956 Two or more races householders$101,565 Hispanic or Latino householders
Median age by race in Kankakee
43.2 Median age for White residents40.0 45.9 32.8 Median age for Black or African American residents33.7 33.2 15.8 Median age for American Indian / Alaska Native residents31.7 33.2 26.9 Median age for Asian residents32.0 26.3 -666,666,666.0 Median age for Native Hawaiian / Pacific Islander residents-666,666,666.0 -666,666,666.0 49.3 Median age for Other race residents66.2 30.9 16.2 Median age for Two or more races residents20.9 12.5 50.6 Median age for White alone residents48.4 53.0 25.9 Median age for Hispanic or Latino residents27.1 26.2
Owner/renter occupied households by race in Kankakee
House owners and renters - White residents 2,862 65.9% Owner occupied1,482 34.1% Renter occupiedHouse owners and renters - Black or African American residents 1,071 26.2% Owner occupied3,021 73.8% Renter occupiedHouse owners and renters - American Indian / Alaska Native residents 27 100.0% Owner occupiedHouse owners and renters - Asian residents 7 7.7% Owner occupied82 92.3% Renter occupiedHouse owners and renters - Other race residents 413 92.8% Owner occupied32 7.2% Renter occupiedHouse owners and renters - Two or more races residents 280 59.5% Owner occupied191 40.5% Renter occupiedHouse owners and renters - White alone residents 2,582 67.8% Owner occupied1,227 32.2% Renter occupiedHouse owners and renters - Hispanic or Latino residents 1,013 76.4% Owner occupied313 23.6% Renter occupied
Language usage in Kankakee
English speakers - Total 78.6% of residents of Kankakee speak English at home.
22.1% of residents speak Spanish at home 4,062 80.1% Speak English very well1,008 19.9% Speak English less than very well1.0% of residents speak other language at home 132 58.1% Speak English very well95 41.9% Speak English less than very well
English speakers - Born in the United States 88.0% of residents of Kankakee speak English at home.
11.9% of residents speak Spanish at home 320 93.3% Speak English very well23 6.7% Speak English less than very well1.1% of residents speak other language at home 31 100.0% Speak English very well
English speakers - Native, born elsewhere 70.2% of residents of Kankakee speak English at home.
34.0% of residents speak Spanish at home 12 75.0% Speak English very well4 25.0% Speak English less than very well
English speakers - Foreign-born 7.1% of residents of Kankakee speak English at home.
100.5% of residents speak Spanish at home 1,464 60.1% Speak English very well973 39.9% Speak English less than very well4.1% of residents speak other language at home 27 27.3% Speak English very well72 72.7% Speak English less than very well
White (Caucasian) - Speak only English Native:
83.9% (8,025)Foreign-born:
3.2% (31)
White (Caucasian) - Speak another language Native:
18.3% (1,751)Foreign-born:
100.0% (979)
Black or African American - Speak another language Native:
2.9% (255)Foreign-born:
95.1% (24)
Asian - Speak only English Native:
47.1% (20)Foreign-born:
77.3% (128)
Asian - Speak another language Native:
15.0% (6)Foreign-born:
28.5% (47)
Other race - Speak only English Native:
22.2% (86)Foreign-born:
3.0% (27)
Other race - Speak another language Native:
82.9% (319)Foreign-born:
96.5% (874)
Two or more races - Speak only English Native:
61.6% (769)Foreign-born:
2.7% (12)
Two or more races - Speak another language Native:
22.2% (277)Foreign-born:
100.0% (444)
White alone - Speak only English Native:
95.4% (7,730)Foreign-born:
8.9% (18)
White alone - Speak another language Native:
4.6% (374)Foreign-born:
92.1% (182)
Hispanic or Latino - Speak only English Native:
28.0% (758)Foreign-born:
1.7% (36)
Hispanic or Latino - Speak another language Native:
74.3% (2,010)Foreign-born:
99.2% (2,051)
Foreign-born residents in Kankakee 2,707 residents are foreign born (9.7% Latin America ).
This city:
11.1%Illinois:
14.1%
Marital status for residents in Kankakee Marital status - White (Caucasian) population 15 years and over
Males 42.5% Never married44.7% Now married0.8% Separated2.3% Widowed9.7% DivorcedFemales 31.2% Never married42.3% Now married1.6% Separated14.4% Widowed10.5% DivorcedWomen who gave birth in the past 12 months Now married:
47.7% (81)Unmarried:
52.3% (89)
Women who did not give birth in the past 12 months Now married:
42.9% (965)Unmarried:
57.1% (1,283)
Marital status - Black or African American population 15 years and over
Males 58.7% Never married27.0% Now married2.0% Separated1.9% Widowed10.5% DivorcedFemales 60.1% Never married18.4% Now married3.0% Separated7.7% Widowed10.8% DivorcedWomen who gave birth in the past 12 months Now married:
3.0% (9)Unmarried:
97.0% (307)
Women who did not give birth in the past 12 months Now married:
17.4% (376)Unmarried:
82.6% (1,778)
Marital status - American Indian / Alaska Native population 15 years and over
Males 62.8% Never married37.2% Now married0.0% Separated0.0% Widowed0.0% DivorcedFemales 42.3% Never married57.7% Now married0.0% Separated0.0% Widowed0.0% DivorcedWomen who did not give birth in the past 12 months Now married:
57.7% (25)Unmarried:
42.3% (18)
Marital status - Asian population 15 years and over
Males 95.7% Never married3.7% Now married0.0% Separated0.0% Widowed0.6% DivorcedFemales 73.7% Never married26.2% Now married0.0% Separated0.0% Widowed0.0% DivorcedWomen who did not give birth in the past 12 months Now married:
26.2% (21)Unmarried:
73.8% (60)
Marital status - Other race population 15 years and over
Males 31.6% Never married68.4% Now married0.0% Separated0.0% Widowed0.0% DivorcedFemales 33.7% Never married52.2% Now married0.0% Separated11.2% Widowed2.9% DivorcedWomen who did not give birth in the past 12 months Now married:
70.9% (176)Unmarried:
29.1% (72)
Marital status - Two or more races population 15 years and over
Males 54.2% Never married44.5% Now married0.0% Separated0.0% Widowed1.3% DivorcedFemales 35.6% Never married54.6% Now married0.0% Separated0.0% Widowed9.8% DivorcedWomen who gave birth in the past 12 months Now married:
100.0% (17)Unmarried:
0.0% (0)
Women who did not give birth in the past 12 months Now married:
46.7% (173)Unmarried:
53.3% (198)
Marital status - White alone, not Hispanic / Latino population 15 years and over
Males 43.0% Never married42.4% Now married0.3% Separated2.7% Widowed11.5% DivorcedFemales 28.8% Never married42.6% Now married0.7% Separated17.1% Widowed10.8% DivorcedWomen who gave birth in the past 12 months Now married:
44.5% (51)Unmarried:
55.5% (64)
Women who did not give birth in the past 12 months Now married:
43.0% (632)Unmarried:
57.0% (837)
Marital status - Hispanic or Latino population 15 years and over
Males 39.6% Never married58.5% Now married1.5% Separated0.0% Widowed0.4% DivorcedFemales 37.9% Never married48.6% Now married2.8% Separated4.7% Widowed6.1% DivorcedWomen who gave birth in the past 12 months Now married:
63.1% (42)Unmarried:
36.9% (24)
Women who did not give birth in the past 12 months Now married:
50.1% (614)Unmarried:
49.9% (611)
Ancestries in Kankakee
6,094 38.1% African1,197 7.5% German934 5.8% Irish332 2.1% English240 1.5% French234 1.5% American211 1.3% Polish207 1.3% Italian82 0.5% Swedish79 0.5% Dutch70 0.4% Scottish56 0.3% French Canadian49 0.3% European38 0.2% Norwegian27 0.2% Scotch-Irish17 0.1% Bulgarian13 0.08% Nigerian11 0.07% British10 0.06% Belgian10 0.06% Lithuanian10 0.06% Scandinavian7 0.04% Czechoslovakian5 0.03% Greek5 0.03% Russian2 0.01% Armenian
Geographical mobility in Kankakee Same house 1 year ago 10,026 93.6% White (Caucasian)9,068 94.1% Black or African American171 99.7% American Indian / Alaska Native246 99.4% Asian1,277 90.6% Other race2,041 88.2% Two or more races7,694 92.9% White alone, not Hispanic / Latino4,671 91.8% Hispanic or LatinoMoved within same county 462 4.3% White / Caucasian244 2.5% Black or African American12 0.9% Other race39 1.7% Two or more races457 5.5% White alone, not Hispanic / Latino88 1.7% Hispanic or LatinoMoved within same state 156 1.5% White / Caucasian314 3.3% Black or African American29 2.1% Other race95 4.1% Two or more races193 2.3% White alone, not Hispanic / Latino226 4.4% Hispanic or LatinoMoved from different state 59 0.5% White / Caucasian14 0.1% Black or African American23 1.7% Other race62 0.7% White alone, not Hispanic / Latino23 0.4% Hispanic or LatinoMoved from abroad 11 0.1% White99 7.0% Other race110 2.2% Hispanic or Latino
Children Nativity (place of birth) in Kankakee
Children under 6 years - Living with two parents Both parents native 360 100.0% NativeBoth parents foreign-born 90 100.0% NativeOne native, one foreign-born parent 74 100.0% NativeChildren under 6 years - Living with one parent Native parent 917 100.0% NativeForeign-born parent 42 29.2% Native102 70.8% Foreign-bornChildren 6 to 17 years - Living with two parents Both parents native 1,032 100.0% NativeBoth parents foreign-born 373 100.0% NativeOne native, one foreign-born parent 234 100.0% NativeChildren 6 to 17 years - Living with one parent Native parent 1,988 100.0% NativeForeign-born parent 342 64.7% Native186 35.3% Foreign-born
Grandparents responsible for own grandchildren in Kankakee
Grandparents (30 to 59 years) White / Caucasian 33 42.6% Responsible for grandchildren45 57.4% Not responsible for grandchildrenBlack or African American 58 57.3% Responsible for grandchildren43 42.7% Not responsible for grandchildrenOther race 12 100.0% Responsible for grandchildrenTwo or more races 17 100.0% Responsible for grandchildrenWhite alone, not Hispanic / Latino 8 20.8% Responsible for grandchildren31 79.2% Not responsible for grandchildrenHispanic or Latino 63 68.0% Responsible for grandchildren30 32.0% Not responsible for grandchildrenGrandparents (60 years and over) White / Caucasian 16 13.1% Responsible for grandchildren102 86.9% Not responsible for grandchildrenBlack or African American 84 90.9% Responsible for grandchildren8 9.1% Not responsible for grandchildrenOther race 41 100.0% Not responsible for grandchildrenWhite alone, not Hispanic / Latino 16 12.6% Responsible for grandchildren113 87.4% Not responsible for grandchildrenHispanic or Latino 43 100.0% Not responsible for grandchildren