Races in Keeneland, Kentucky (KY) Detailed Stats
Ancestries, Foreign-born residents, place of birth

Recent posts about races in Keeneland, Kentucky on our local forum with over 2,400,000 registered users:
 | close to racetracks? (3 replies) |
| Should I visit Louisville or Lexington? (11 replies) |
| Moving from California to Lexington (11 replies) |
| Moving from CO Possibly Next Summer (20 replies) |
| Lexington must sees? (10 replies) |
| Relocating from the Seattle area (12 replies) |
Latest news about races in Keeneland, KY collected exclusively by city-data.com from local newspapers, TV, and radio stations
2.9% of Keeneland, KY residents are foreign-born (2.9% born in Europe), which is 39.3% less than the foreign-born rate of 4.0% across the entire state of Kentucky.
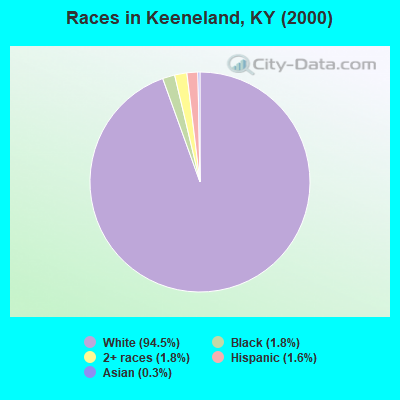
Race distribution in Keeneland

- 36294.5%White alone
- 71.8%Black alone
- 71.8%Two or more races
- 61.6%Hispanic
- 10.3%Asian alone
2000
2022
-
- 3,608,01389.3%White alone
- 293,6397.3%Black alone
- 59,9391.5%Hispanic
- 37,7500.9%Two or more races
- 29,3680.7%Asian alone
- 7,9390.2%American Indian alone
- 3,8460.10%Other race alone
- 1,2750.03%Native Hawaiian and Other
Pacific Islander alone

-
- 3,710,99882.2%White alone
- 343,1947.6%Black alone
- 187,4834.2%Hispanic
- 187,3944.2%Two or more races
- 62,2401.4%Asian alone
- 13,5290.3%Other race alone
- 4,3020.10%American Indian alone
- 3,1700.07%Native Hawaiian and Other
Pacific Islander alone

Income and house value in Keeneland
- Median household income in 2022
- $67,175White non-Hispanic householders
- $48,965Asian householders
- $48,661Two or more races householders
- Median 2022 house value
- $233,261White Non-Hispanic householders
- $180,729Two or more races householders
Household income for White non-Hispanic householders

Household income for Asian householders

Household income for Two or more races householders

Foreign-born residents in Keeneland
11 residents are foreign born (2.9% Europe).
| This city: | 2.9% |
| Kentucky: | 2.0% |
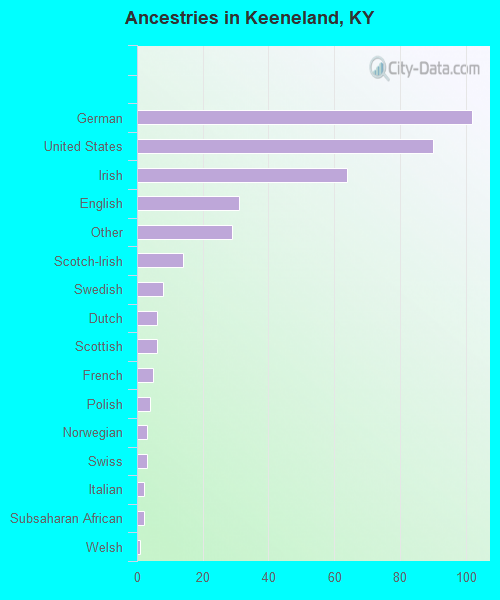
Ancestries in Keeneland

- 10227.6%German
- 9024.3%United States
- 6417.3%Irish
- 318.4%English
- 297.8%Other
- 143.8%Scotch-Irish
- 82.2%Swedish
- 61.6%Dutch
- 61.6%Scottish
- 51.4%French
- 41.1%Polish
- 30.8%Norwegian
- 30.8%Swiss
- 20.5%Italian
- 20.5%Subsaharan African
- 10.3%Welsh
Zip codes: 40223.