Races in Keller, Texas (TX) Detailed Stats
Data:
Races - White alone (%)
Races - White alone (% change since 2000)
Races - Black alone (%)
Races - Black alone (% change since 2000)
Races - American Indian alone (%)
Races - American Indian alone (% change since 2000)
Races - Asian alone (%)
Races - Asian alone (% change since 2000)
Races - Hispanic (%)
Races - Hispanic (% change since 2000)
Races - Native Hawaiian and Other Pacific Islander alone (%)
Races - Native Hawaiian and Other Pacific Islander alone (% change since 2000)
Races - Two or more races(%)
Races - Two or more races(% change since 2000)
Races - Other race alone (%)
Races - Other race alone (% change since 2000)
Racial diversity
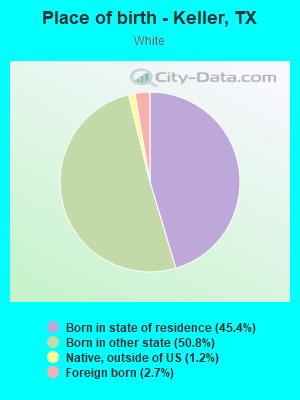
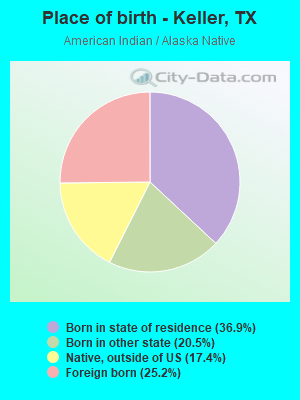
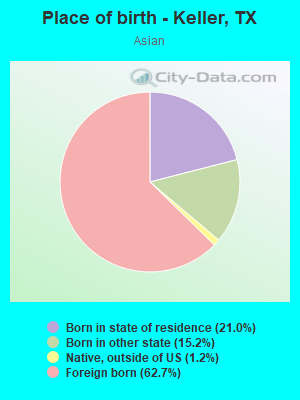
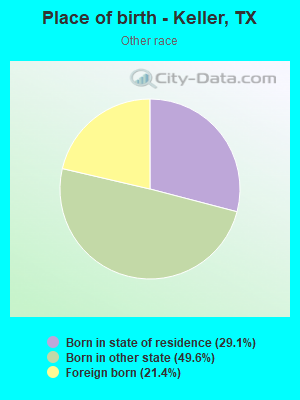
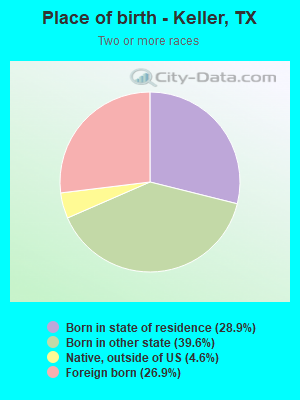
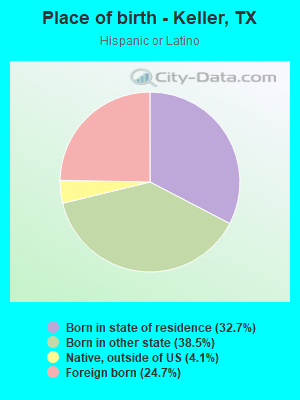
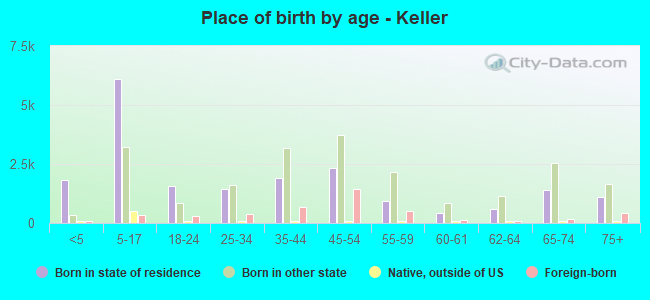
Place of birth - Born in state of residence (%)
Place of birth - Born in state of residence (%) - White
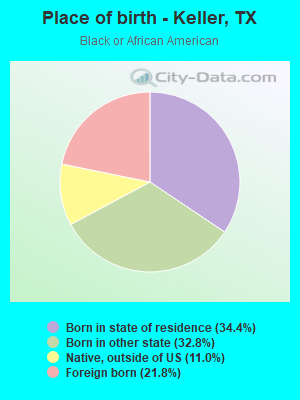
Place of birth - Born in state of residence (%) - Black or African American
Place of birth - Born in state of residence (%) - Asian
Place of birth - Born in state of residence (%) - Hispanic or Latino
Place of birth - Born in state of residence (%) - American Indian and Alaska Native
Place of birth - Born in state of residence (%) - Multirace
Place of birth - Born in state of residence (%) - Other Race
Place of birth - Born in other state (%)
Place of birth - Born in other state (%) - White
Place of birth - Born in other state (%) - Black or African American
Place of birth - Born in other state (%) - Asian
Place of birth - Born in other state (%) - Hispanic or Latino
Place of birth - Born in other state (%) - American Indian and Alaska Native
Place of birth - Born in other state (%) - Multirace
Place of birth - Born in other state (%) - Other Race
Place of birth - Native, outside of US (%)
Place of birth - Native, outside of US (%) - White
Place of birth - Native, outside of US (%) - Black or African American
Place of birth - Native, outside of US (%) - Asian
Place of birth - Native, outside of US (%) - Hispanic or Latino
Place of birth - Native, outside of US (%) - American Indian and Alaska Native
Place of birth - Native, outside of US (%) - Multirace
Place of birth - Native, outside of US (%) - Other Race
Place of birth - Foreign born (%)
Place of birth - Foreign born (%) - White
Place of birth - Foreign born (%) - Black or African American
Place of birth - Foreign born (%) - Asian
Place of birth - Foreign born (%) - Hispanic or Latino
Place of birth - Foreign born (%) - American Indian and Alaska Native
Place of birth - Foreign born (%) - Multirace
Place of birth - Foreign born (%) - Other Race
Residents speaking English at home (%)
Residents speaking English at home - Born in the United States (%)
Residents speaking English at home - Native, born elsewhere (%)
Residents speaking English at home - Foreign born (%)
Residents speaking Spanish at home (%)
Residents speaking Spanish at home - Born in the United States (%)
Residents speaking Spanish at home - Native, born elsewhere (%)
Residents speaking Spanish at home - Foreign born (%)
Residents speaking other language at home (%)
Residents speaking other language at home - Born in the United States (%)
Residents speaking other language at home - Native, born elsewhere (%)
Residents speaking other language at home - Foreign born (%)
Marital status - Never married (%)
Marital status - Now married (%)
Marital status - Separated (%)
Marital status - Widowed (%)
Marital status - Divorced (%)
Ancestries Reported - Arab (%)
Ancestries Reported - Czech (%)
Ancestries Reported - Danish (%)
Ancestries Reported - Dutch (%)
Ancestries Reported - English (%)
Ancestries Reported - French (%)
Ancestries Reported - French Canadian (%)
Ancestries Reported - German (%)
Ancestries Reported - Greek (%)
Ancestries Reported - Hungarian (%)
Ancestries Reported - Irish (%)
Ancestries Reported - Italian (%)
Ancestries Reported - Lithuanian (%)
Ancestries Reported - Norwegian (%)
Ancestries Reported - Polish (%)
Ancestries Reported - Portuguese (%)
Ancestries Reported - Russian (%)
Ancestries Reported - Scotch-Irish (%)
Ancestries Reported - Scottish (%)
Ancestries Reported - Slovak (%)
Ancestries Reported - Subsaharan African (%)
Ancestries Reported - Swedish (%)
Ancestries Reported - Swiss (%)
Ancestries Reported - Ukrainian (%)
Ancestries Reported - United States (%)
Ancestries Reported - Welsh (%)
Ancestries Reported - West Indian (%)
Ancestries Reported - Other (%)
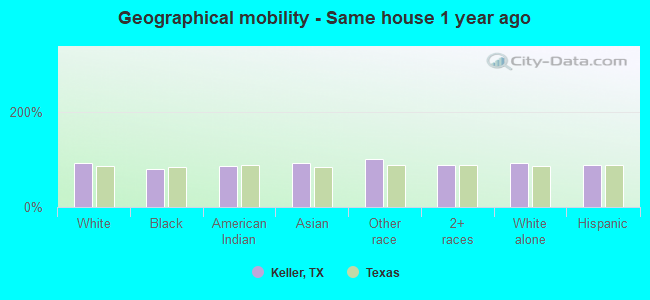
Geographical mobility - Same house 1 year ago (%)
Geographical mobility - Same house 1 year ago (%) - White
Geographical mobility - Same house 1 year ago (%) - Black or African American
Geographical mobility - Same house 1 year ago (%) - Asian
Geographical mobility - Same house 1 year ago (%) - Hispanic or Latino
Geographical mobility - Same house 1 year ago (%) - American Indian and Alaska Native
Geographical mobility - Same house 1 year ago (%) - Multirace
Geographical mobility - Same house 1 year ago (%) - Other Race
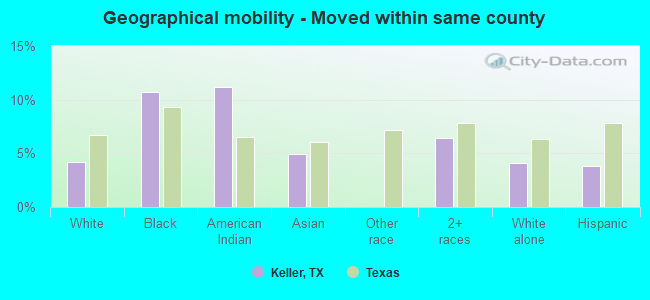
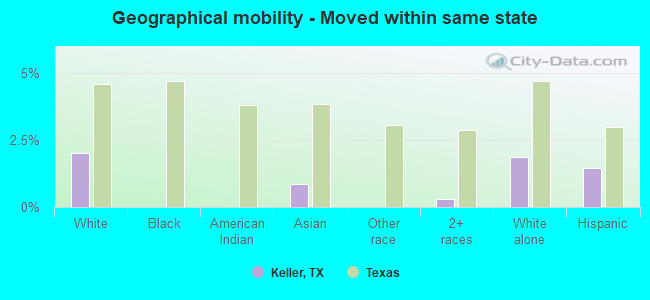
Geographical mobility - Moved within same county (%)
Geographical mobility - Moved within same county (%) - White
Geographical mobility - Moved within same county (%) - Black or African American
Geographical mobility - Moved within same county (%) - Asian
Geographical mobility - Moved within same county (%) - Hispanic or Latino
Geographical mobility - Moved within same county (%) - American Indian and Alaska Native
Geographical mobility - Moved within same county (%) - Multirace
Geographical mobility - Moved within same county (%) - Other Race
Geographical mobility - Moved from different county within same state (%)
Geographical mobility - Moved from different county within same state (%) - White
Geographical mobility - Moved from different county within same state (%) - Black or African American
Geographical mobility - Moved from different county within same state (%) - Asian
Geographical mobility - Moved from different county within same state (%) - Hispanic or Latino
Geographical mobility - Moved from different county within same state (%) - American Indian and Alaska Native
Geographical mobility - Moved from different county within same state (%) - Multirace
Geographical mobility - Moved from different county within same state (%) - Other Race
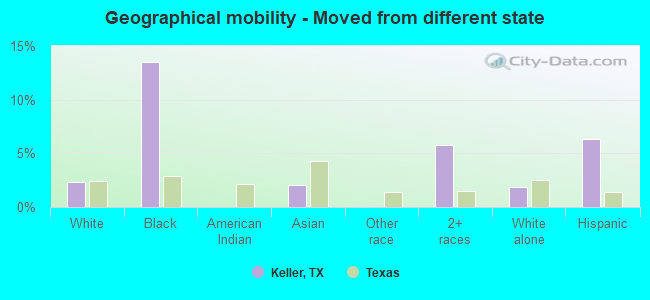
Geographical mobility - Moved from different state (%)
Geographical mobility - Moved from different state (%) - White
Geographical mobility - Moved from different state (%) - Black or African American
Geographical mobility - Moved from different state (%) - Asian
Geographical mobility - Moved from different state (%) - Hispanic or Latino
Geographical mobility - Moved from different state (%) - American Indian and Alaska Native
Geographical mobility - Moved from different state (%) - Multirace
Geographical mobility - Moved from different state (%) - Other Race
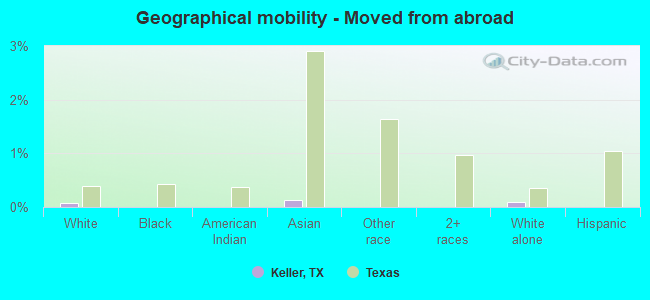
Geographical mobility - Moved from abroad (%)
Geographical mobility - Moved from abroad (%) - White
Geographical mobility - Moved from abroad (%) - Black or African American
Geographical mobility - Moved from abroad (%) - Asian
Geographical mobility - Moved from abroad (%) - Hispanic or Latino
Geographical mobility - Moved from abroad (%) - American Indian and Alaska Native
Geographical mobility - Moved from abroad (%) - Multirace
Geographical mobility - Moved from abroad (%) - Other Race
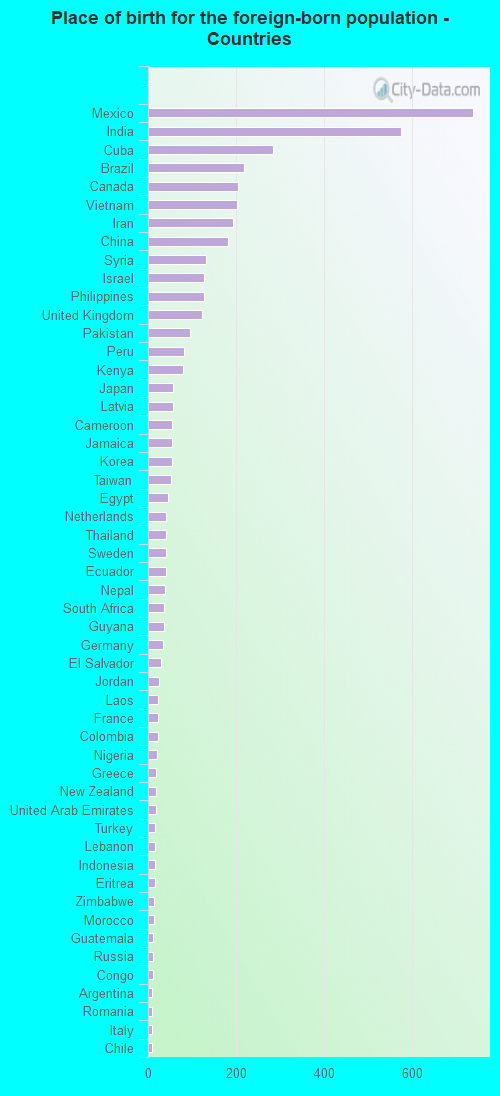
Place of birth for the foreign-born population - Ireland (%)
Place of birth for the foreign-born population - Denmark (%)
Place of birth for the foreign-born population - Norway (%)
Place of birth for the foreign-born population - Sweden (%)
Place of birth for the foreign-born population - United Kingdom (%)
Place of birth for the foreign-born population - England (%)
Place of birth for the foreign-born population - Scotland (%)
Place of birth for the foreign-born population - Other Northern Europe (%)
Place of birth for the foreign-born population - Austria (%)
Place of birth for the foreign-born population - Belgium (%)
Place of birth for the foreign-born population - France (%)
Place of birth for the foreign-born population - Germany (%)
Place of birth for the foreign-born population - Netherlands (%)
Place of birth for the foreign-born population - Switzerland (%)
Place of birth for the foreign-born population - Other Western Europe (%)
Place of birth for the foreign-born population - Greece (%)
Place of birth for the foreign-born population - Italy (%)
Place of birth for the foreign-born population - Portugal (%)
Place of birth for the foreign-born population - Spain (%)
Place of birth for the foreign-born population - Other Southern Europe (%)
Place of birth for the foreign-born population - Albania (%)
Place of birth for the foreign-born population - Belarus (%)
Place of birth for the foreign-born population - Bosnia and Herzegovina (%)
Place of birth for the foreign-born population - Bulgaria (%)
Place of birth for the foreign-born population - Croatia (%)
Place of birth for the foreign-born population - Czechoslovakia (%)
Place of birth for the foreign-born population - Hungary (%)
Place of birth for the foreign-born population - Latvia (%)
Place of birth for the foreign-born population - Lithuania (%)
Place of birth for the foreign-born population - North Macedonia (Macedonia) (%)
Place of birth for the foreign-born population - Moldova (%)
Place of birth for the foreign-born population - Poland (%)
Place of birth for the foreign-born population - Romania (%)
Place of birth for the foreign-born population - Russia (%)
Place of birth for the foreign-born population - Serbia (%)
Place of birth for the foreign-born population - Ukraine (%)
Place of birth for the foreign-born population - Other Eastern Europe (%)
Place of birth for the foreign-born population - China (%)
Place of birth for the foreign-born population - Hong Kong (%)
Place of birth for the foreign-born population - Taiwan (%)
Place of birth for the foreign-born population - Japan (%)
Place of birth for the foreign-born population - Korea (%)
Place of birth for the foreign-born population - Other Eastern Asia (%)
Place of birth for the foreign-born population - Afghanistan (%)
Place of birth for the foreign-born population - Bangladesh (%)
Place of birth for the foreign-born population - India (%)
Place of birth for the foreign-born population - Iran (%)
Place of birth for the foreign-born population - Kazakhstan (%)
Place of birth for the foreign-born population - Nepal (%)
Place of birth for the foreign-born population - Pakistan (%)
Place of birth for the foreign-born population - Sri Lanka (%)
Place of birth for the foreign-born population - Uzbekistan (%)
Place of birth for the foreign-born population - Other South Central Asia (%)
Place of birth for the foreign-born population - Burma (%)
Place of birth for the foreign-born population - Cambodia (%)
Place of birth for the foreign-born population - Indonesia (%)
Place of birth for the foreign-born population - Laos (%)
Place of birth for the foreign-born population - Malaysia (%)
Place of birth for the foreign-born population - Philippines (%)
Place of birth for the foreign-born population - Singapore (%)
Place of birth for the foreign-born population - Thailand (%)
Place of birth for the foreign-born population - Vietnam (%)
Place of birth for the foreign-born population - Other South Eastern Asia (%)
Place of birth for the foreign-born population - Armenia (%)
Place of birth for the foreign-born population - Iraq (%)
Place of birth for the foreign-born population - Israel (%)
Place of birth for the foreign-born population - Jordan (%)
Place of birth for the foreign-born population - Kuwait (%)
Place of birth for the foreign-born population - Lebanon (%)
Place of birth for the foreign-born population - Saudi Arabia (%)
Place of birth for the foreign-born population - Syria (%)
Place of birth for the foreign-born population - Turkey (%)
Place of birth for the foreign-born population - Yemen (%)
Place of birth for the foreign-born population - Other Western Asia (%)
Place of birth for the foreign-born population - Eritrea (%)
Place of birth for the foreign-born population - Ethiopia (%)
Place of birth for the foreign-born population - Kenya (%)
Place of birth for the foreign-born population - Somalia (%)
Place of birth for the foreign-born population - Uganda (%)
Place of birth for the foreign-born population - Zimbabwe (%)
Place of birth for the foreign-born population - Other Eastern Africa (%)
Place of birth for the foreign-born population - Cameroon (%)
Place of birth for the foreign-born population - Congo (%)
Place of birth for the foreign-born population - Democratic Republic of Congo (Zaire) (%)
Place of birth for the foreign-born population - Other Middle Africa (%)
Place of birth for the foreign-born population - Egypt (%)
Place of birth for the foreign-born population - Morocco (%)
Place of birth for the foreign-born population - Sudan (%)
Place of birth for the foreign-born population - Other Northern Africa (%)
Place of birth for the foreign-born population - South Africa (%)
Place of birth for the foreign-born population - Other Southern Africa (%)
Place of birth for the foreign-born population - Cabo Verde (%)
Place of birth for the foreign-born population - Ghana (%)
Place of birth for the foreign-born population - Liberia (%)
Place of birth for the foreign-born population - Nigeria (%)
Place of birth for the foreign-born population - Senegal (%)
Place of birth for the foreign-born population - Sierra Leone (%)
Place of birth for the foreign-born population - Other Western Africa (%)
Place of birth for the foreign-born population - Australia (%)
Place of birth for the foreign-born population - New Zealand (%)
Place of birth for the foreign-born population - Fiji (%)
Place of birth for the foreign-born population - Micronesia (%)
Place of birth for the foreign-born population - Bahamas (%)
Place of birth for the foreign-born population - Barbados (%)
Place of birth for the foreign-born population - Cuba (%)
Place of birth for the foreign-born population - Dominica (%)
Place of birth for the foreign-born population - Dominican Republic (%)
Place of birth for the foreign-born population - Grenada (%)
Place of birth for the foreign-born population - Haiti (%)
Place of birth for the foreign-born population - Jamaica (%)
Place of birth for the foreign-born population - St. Vincent and the Grenadines (%)
Place of birth for the foreign-born population - Trinidad and Tobago (%)
Place of birth for the foreign-born population - West Indies (%)
Place of birth for the foreign-born population - Other Caribbean (%)
Place of birth for the foreign-born population - Belize (%)
Place of birth for the foreign-born population - Costa Rica (%)
Place of birth for the foreign-born population - El Salvador (%)
Place of birth for the foreign-born population - Guatemala (%)
Place of birth for the foreign-born population - Honduras (%)
Place of birth for the foreign-born population - Mexico (%)
Place of birth for the foreign-born population - Nicaragua (%)
Place of birth for the foreign-born population - Panama (%)
Place of birth for the foreign-born population - Other Central America (%)
Place of birth for the foreign-born population - Argentina (%)
Place of birth for the foreign-born population - Bolivia (%)
Place of birth for the foreign-born population - Brazil (%)
Place of birth for the foreign-born population - Chile (%)
Place of birth for the foreign-born population - Colombia (%)
Place of birth for the foreign-born population - Ecuador (%)
Place of birth for the foreign-born population - Guyana (%)
Place of birth for the foreign-born population - Peru (%)
Place of birth for the foreign-born population - Uruguay (%)
Place of birth for the foreign-born population - Venezuela (%)
Place of birth for the foreign-born population - Other South America (%)
Place of birth for the foreign-born population - Canada (%)
Place of birth for the foreign-born population - Other Northern America (%)
Place of birth for the foreign-born population - Other (%)
Latest news about races in Keller, TX collected exclusively by city-data.com from local newspapers, TV, and radio stations
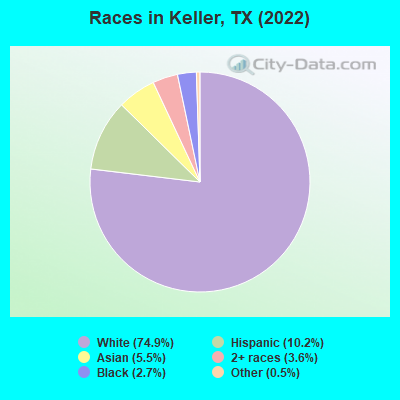
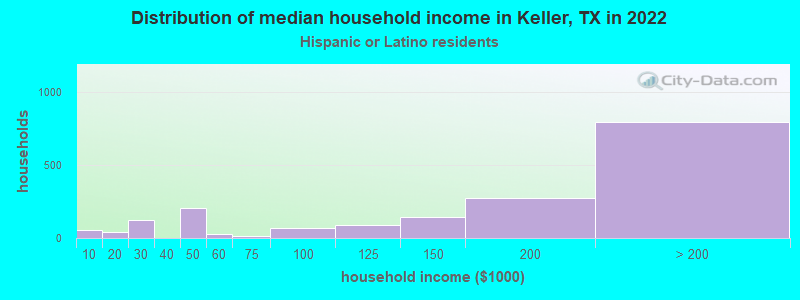
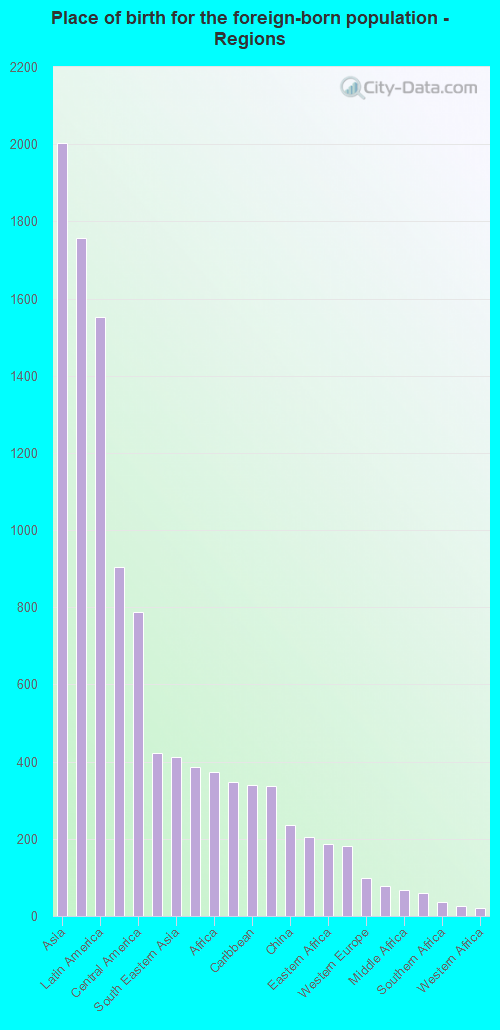
According to 2022 data, the most numerous races in Keller, TX are Hispanic (4,727 residents), White alone (34,598 residents), and Black alone (1,267 residents). 86.1% of Keller residents speak English at home. 9.8% of Keller, TX residents are foreign-born (4.3% born in Asia, 3.3% born in Latin America), which is 73.1% less than the foreign-born rate of 17.0% across the entire state of Texas.
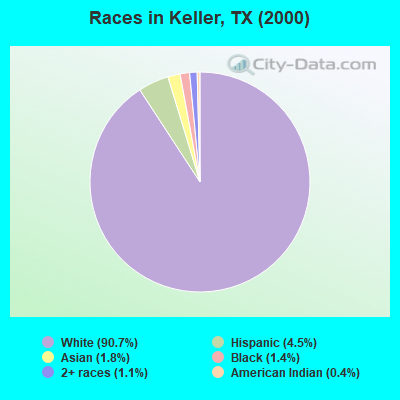
Race distribution in Keller
2000 2022
10,933,313 52.4% White alone 6,669,666 32.0% Hispanic 2,364,255 11.3% Black alone 554,445 2.7% Asian alone 230,567 1.1% Two or more races 68,859 0.3% American Indian alone 19,958 0.10% Other race alone 10,757 0.05% Native Hawaiian and Other
12,070,642 40.2% Hispanic 11,683,430 38.9% White alone 3,508,706 11.7% Black alone 1,608,173 5.4% Asian alone 956,560 3.2% Two or more races 125,763 0.4% Other race alone 47,023 0.2% American Indian alone 29,275 0.10% Native Hawaiian and Other
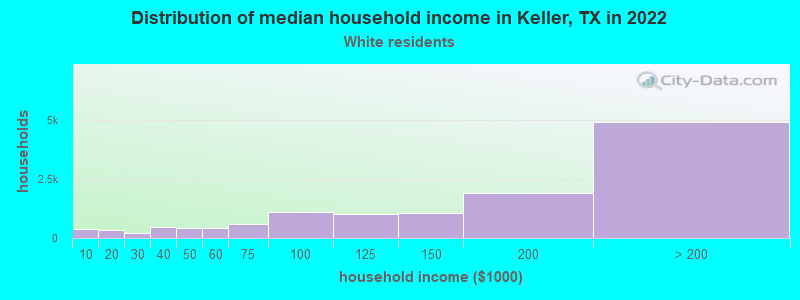
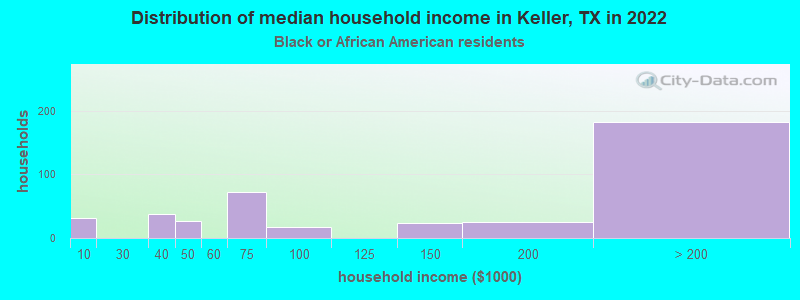
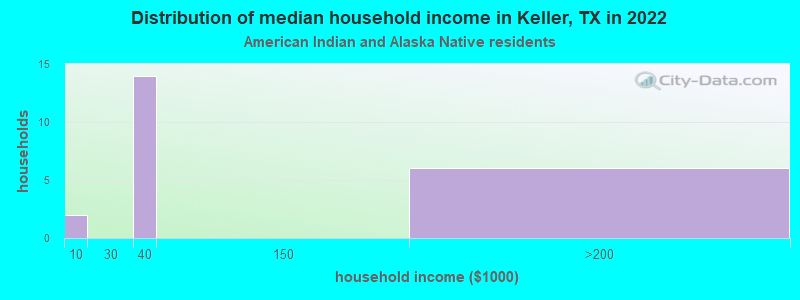
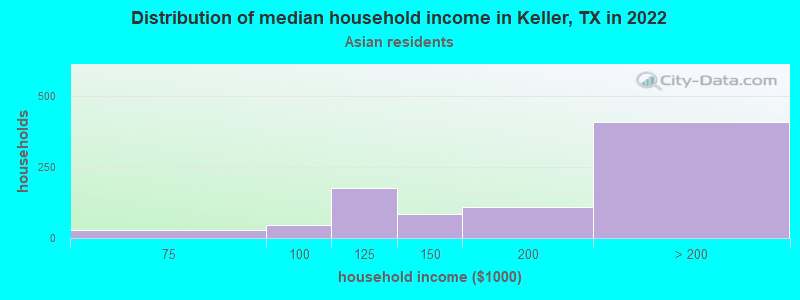
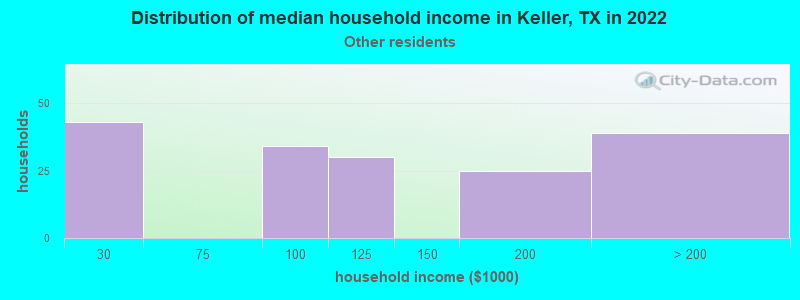
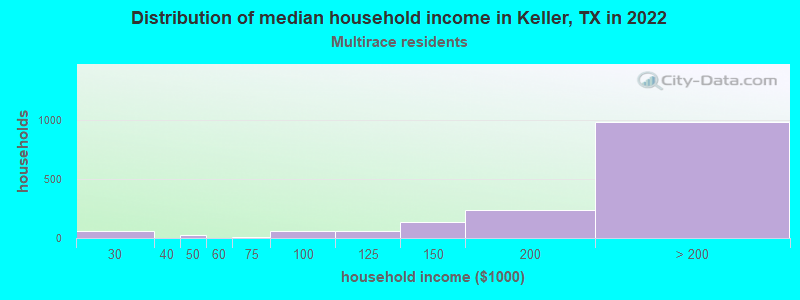
Income and house value in Keller Median household income in 2022 $153,895 White non-Hispanic householders$158,141 Black householdersover $200,000 Asian householders$102,226 Some other race householdersover $200,000 Two or more races householders$155,938 Hispanic or Latino race householdersMedian 2022 house value $559,939 White Non-Hispanic householders$460,897 Black or African American householders$191,285 American Indian or Alaska Native householders $608,488 Asian householders$836,024 Some other race householders$460,897 Two or more races householders$571,267 Hispanic or Latino householders
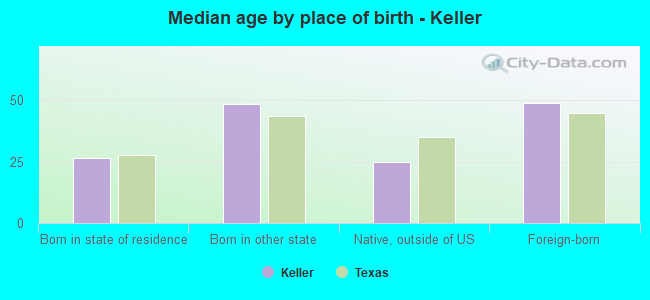
Median age by race in Keller
45.9 Median age for White residents44.2 47.8 38.7 Median age for Black or African American residents38.7 38.9 60.1 Median age for American Indian / Alaska Native residents-867,996,200.5 55.0 38.2 Median age for Asian residents34.7 42.9 -565,040,649.8 Median age for Native Hawaiian / Pacific Islander residents-550,102,248.9 -551,928,782.8 44.1 Median age for Other race residents34.1 50.9 45.9 Median age for Two or more races residents52.4 37.2 45.5 Median age for White alone residents43.6 46.7 36.1 Median age for Hispanic or Latino residents35.9 36.4
Owner/renter occupied households by race in Keller
House owners and renters - White residents 10,668 82.8% Owner occupied2,210 17.2% Renter occupiedHouse owners and renters - Black or African American residents 368 82.7% Owner occupied77 17.3% Renter occupiedHouse owners and renters - American Indian / Alaska Native residents 10 49.2% Owner occupied10 50.8% Renter occupiedHouse owners and renters - Asian residents 688 81.1% Owner occupied161 18.9% Renter occupiedHouse owners and renters - Other race residents 186 100.0% Owner occupiedHouse owners and renters - Two or more races residents 1,590 98.4% Owner occupied25 1.6% Renter occupiedHouse owners and renters - White alone residents 10,681 81.8% Owner occupied2,382 18.2% Renter occupiedHouse owners and renters - Hispanic or Latino residents 1,671 92.9% Owner occupied129 7.1% Renter occupied
Language usage in Keller
English speakers - Total 86.1% of residents of Keller speak English at home.
6.0% of residents speak Spanish at home 2,025 76.0% Speak English very well638 24.0% Speak English less than very well7.3% of residents speak other language at home 2,499 77.6% Speak English very well723 22.4% Speak English less than very well
English speakers - Born in the United States 93.5% of residents of Keller speak English at home.
3.4% of residents speak Spanish at home 630 86.4% Speak English very well99 13.6% Speak English less than very well2.2% of residents speak other language at home 436 93.8% Speak English very well29 6.2% Speak English less than very well
English speakers - Native, born elsewhere 91.9% of residents of Keller speak English at home.
8.8% of residents speak Spanish at home 72 100.0% Speak English very well4.3% of residents speak other language at home 31 88.6% Speak English very well4 11.4% Speak English less than very well
English speakers - Foreign-born 19.3% of residents of Keller speak English at home.
25.7% of residents speak Spanish at home 759 66.3% Speak English very well386 33.7% Speak English less than very well54.6% of residents speak other language at home 1,816 74.6% Speak English very well617 25.4% Speak English less than very well
White (Caucasian) - Speak only English Native:
100.0% (31,537)Foreign-born:
38.8% (353)
White (Caucasian) - Speak another language Native:
2.5% (776)Foreign-born:
67.5% (613)
Black or African American - Speak only English Native:
98.6% (873)Foreign-born:
32.2% (98)
American Indian / Alaska Native - Speak only English Native:
74.0% (41)Foreign-born:
42.9% (8)
Asian - Speak only English Native:
82.3% (689)Foreign-born:
21.8% (348)
Asian - Speak another language Native:
24.0% (200)Foreign-born:
79.6% (1,269)
Other race - Speak only English Native:
73.9% (346)Foreign-born:
14.0% (20)
Other race - Speak another language Native:
32.1% (151)Foreign-born:
87.9% (128)
Two or more races - Speak only English Native:
68.6% (2,231)Foreign-born:
2.3% (29)
Two or more races - Speak another language Native:
23.1% (750)Foreign-born:
99.3% (1,231)
White alone - Speak only English Native:
98.0% (31,377)Foreign-born:
35.1% (374)
White alone - Speak another language Native:
2.1% (657)Foreign-born:
64.1% (682)
Hispanic or Latino - Speak only English Native:
64.1% (2,078)Foreign-born:
5.3% (65)
Hispanic or Latino - Speak another language Native:
34.2% (1,107)Foreign-born:
94.7% (1,166)
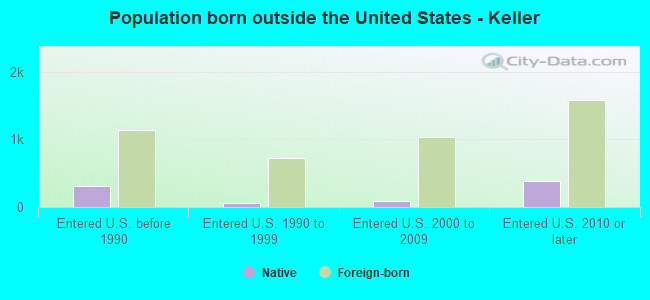
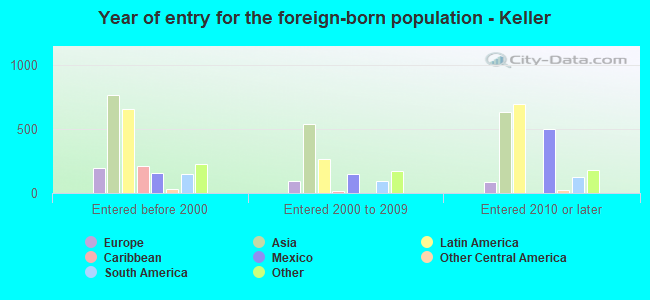
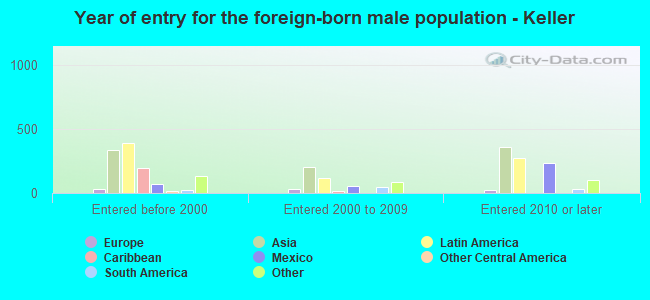
Foreign-born residents in Keller 4,536 residents are foreign born (4.3% Asia , 3.3% Latin America ).
This city:
9.8%Texas:
17.1%
Marital status for residents in Keller Marital status - White (Caucasian) population 15 years and over
Males 23.7% Never married68.9% Now married0.8% Separated1.2% Widowed5.3% DivorcedFemales 19.9% Never married63.8% Now married1.5% Separated5.3% Widowed9.4% DivorcedWomen who gave birth in the past 12 months Now married:
80.1% (253)Unmarried:
19.9% (63)
Women who did not give birth in the past 12 months Now married:
57.5% (3,691)Unmarried:
42.5% (2,731)
Marital status - Black or African American population 15 years and over
Males 15.6% Never married80.3% Now married0.0% Separated0.0% Widowed4.1% DivorcedFemales 23.2% Never married43.5% Now married5.7% Separated19.9% Widowed7.8% DivorcedWomen who gave birth in the past 12 months Now married:
0.0% (0)Unmarried:
100.0% (43)
Women who did not give birth in the past 12 months Now married:
64.1% (156)Unmarried:
35.9% (87)
Marital status - American Indian / Alaska Native population 15 years and over
Males 0.0% Never married100.0% Now married0.0% Separated0.0% Widowed0.0% DivorcedFemales 21.8% Never married78.2% Now married0.0% Separated0.0% Widowed0.0% DivorcedWomen who did not give birth in the past 12 months Now married:
72.7% (46)Unmarried:
27.3% (17)
Marital status - Asian population 15 years and over
Males 23.0% Never married71.3% Now married0.0% Separated0.0% Widowed5.7% DivorcedFemales 14.7% Never married78.8% Now married0.0% Separated2.6% Widowed3.8% DivorcedWomen who gave birth in the past 12 months Now married:
100.0% (35)Unmarried:
0.0% (0)
Women who did not give birth in the past 12 months Now married:
75.9% (557)Unmarried:
24.1% (177)
Marital status - Other race population 15 years and over
Males 51.7% Never married48.3% Now married0.0% Separated0.0% Widowed0.0% DivorcedFemales 10.3% Never married71.8% Now married0.0% Separated17.9% Widowed0.0% DivorcedWomen who did not give birth in the past 12 months Now married:
83.1% (102)Unmarried:
16.9% (21)
Marital status - Two or more races population 15 years and over
Males 15.9% Never married78.2% Now married0.0% Separated1.0% Widowed4.8% DivorcedFemales 33.6% Never married56.1% Now married0.0% Separated4.5% Widowed5.7% DivorcedWomen who gave birth in the past 12 months Now married:
100.0% (14)Unmarried:
0.0% (0)
Women who did not give birth in the past 12 months Now married:
54.3% (539)Unmarried:
45.7% (455)
Marital status - White alone, not Hispanic / Latino population 15 years and over
Males 21.7% Never married70.5% Now married0.9% Separated1.3% Widowed5.6% DivorcedFemales 18.7% Never married64.9% Now married1.6% Separated5.5% Widowed9.3% DivorcedWomen who gave birth in the past 12 months Now married:
78.9% (268)Unmarried:
21.1% (71)
Women who did not give birth in the past 12 months Now married:
58.8% (3,902)Unmarried:
41.2% (2,733)
Marital status - Hispanic or Latino population 15 years and over
Males 35.3% Never married61.8% Now married0.0% Separated0.0% Widowed2.9% DivorcedFemales 29.9% Never married56.7% Now married0.0% Separated5.1% Widowed8.2% DivorcedWomen who gave birth in the past 12 months Now married:
100.0% (29)Unmarried:
0.0% (0)
Women who did not give birth in the past 12 months Now married:
56.6% (589)Unmarried:
43.4% (453)
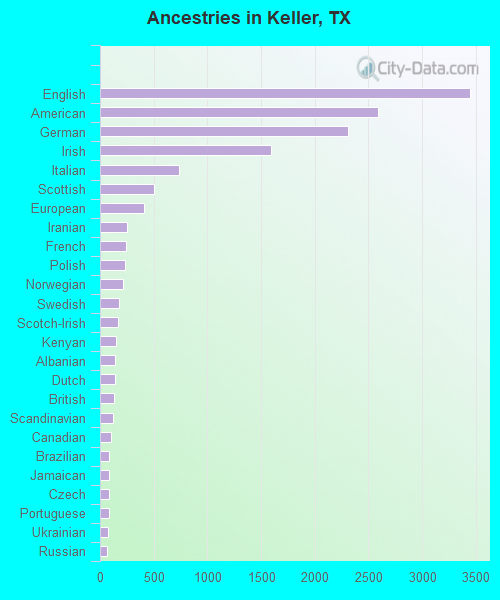
Ancestries in Keller
3,450 16.1% English2,587 12.1% American2,305 10.8% German1,592 7.4% Irish736 3.4% Italian502 2.3% Scottish407 1.9% European253 1.2% Iranian241 1.1% French234 1.1% Polish218 1.0% Norwegian174 0.8% Swedish170 0.8% Scotch-Irish147 0.7% Kenyan140 0.7% Albanian139 0.6% Dutch127 0.6% British117 0.5% Scandinavian107 0.5% Canadian88 0.4% Brazilian88 0.4% Jamaican85 0.4% Czech80 0.4% Portuguese71 0.3% Ukrainian69 0.3% Russian53 0.2% Cajun52 0.2% Lebanese45 0.2% Greek39 0.2% Turkish38 0.2% Croatian35 0.2% Latvian35 0.2% Northern European33 0.2% Moroccan32 0.1% Belgian30 0.1% French Canadian29 0.1% African25 0.1% Eastern European25 0.1% Swiss23 0.1% Egyptian20 0.09% Welsh19 0.09% Finnish17 0.08% Austrian16 0.07% Armenian15 0.07% Slavic14 0.07% Ethiopian13 0.06% Danish11 0.05% Palestinian9 0.04% Lithuanian9 0.04% Nigerian6 0.03% Hungarian3 0.01% Romanian3 0.01% Czechoslovakian
Geographical mobility in Keller Same house 1 year ago 30,404 91.6% White (Caucasian)1,034 80.2% Black or African American63 86.2% American Indian / Alaska Native2,301 91.7% Asian618 100.0% Other race3,988 87.0% Two or more races31,705 92.3% White alone, not Hispanic / Latino4,129 88.3% Hispanic or LatinoMoved within same county 1,394 4.2% White / Caucasian138 10.7% Black or African American8 11.1% American Indian / Alaska Native124 4.9% Asian293 6.4% Two or more races1,409 4.1% White alone, not Hispanic / Latino178 3.8% Hispanic or LatinoMoved within same state 662 2.0% White / Caucasian21 0.9% Asian14 0.3% Two or more races640 1.9% White alone, not Hispanic / Latino68 1.5% Hispanic or LatinoMoved from different state 761 2.3% White / Caucasian174 13.5% Black or African American51 2.0% Asian266 5.8% Two or more races655 1.9% White alone, not Hispanic / Latino294 6.3% Hispanic or LatinoMoved from abroad 23 0.1% White3 0.1% Asian30 0.1% White alone, not Hispanic / Latino
Children Nativity (place of birth) in Keller
Children under 6 years - Living with two parents Both parents native 1,987 100.0% NativeBoth parents foreign-born 233 100.0% NativeOne native, one foreign-born parent 348 100.0% NativeChildren under 6 years - Living with one parent Native parent 107 100.0% NativeForeign-born parent 17 100.0% NativeChildren 6 to 17 years - Living with two parents Both parents native 6,541 100.0% Native2 0.0% Foreign-bornBoth parents foreign-born 698 78.8% Native188 21.2% Foreign-bornOne native, one foreign-born parent 643 93.5% Native45 6.5% Foreign-bornChildren 6 to 17 years - Living with one parent Native parent 986 97.6% Native24 2.4% Foreign-bornForeign-born parent 193 70.4% Native81 29.6% Foreign-born
Grandparents responsible for own grandchildren in Keller
Grandparents (30 to 59 years) White / Caucasian 35 74.6% Responsible for grandchildren12 25.4% Not responsible for grandchildrenBlack or African American 40 100.0% Responsible for grandchildrenTwo or more races 35 100.0% Not responsible for grandchildrenWhite alone, not Hispanic / Latino 42 73.7% Responsible for grandchildren15 26.3% Not responsible for grandchildrenGrandparents (60 years and over) White / Caucasian 17 9.5% Responsible for grandchildren159 90.5% Not responsible for grandchildrenBlack or African American 20 100.0% Not responsible for grandchildrenTwo or more races 230 100.0% Not responsible for grandchildrenWhite alone, not Hispanic / Latino 18 9.9% Responsible for grandchildren164 90.1% Not responsible for grandchildren