Races in Kellogg-Yoncalla, Oregon (OR) Detailed Stats
Ancestries, Foreign-born residents, place of birth
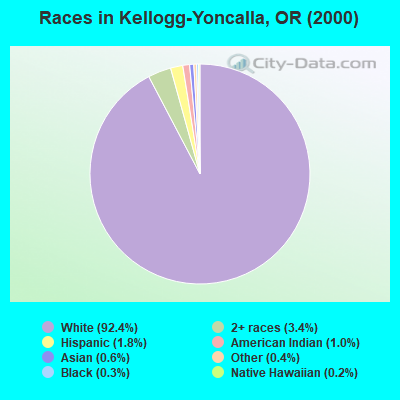
Race distribution in Kellogg-Yoncalla

- 3,52692.4%White alone
- 1313.4%Two or more races
- 701.8%Hispanic
- 371.0%American Indian alone
- 210.6%Asian alone
- 160.4%Other race alone
- 100.3%Black alone
- 70.2%Native Hawaiian and Other
Pacific Islander alone
2000
2022
-
- 2,857,61683.5%White alone
- 275,3148.0%Hispanic
- 100,3332.9%Asian alone
- 82,7332.4%Two or more races
- 53,3251.6%Black alone
- 40,1301.2%American Indian alone
- 7,3980.2%Native Hawaiian and Other
Pacific Islander alone - 4,5500.1%Other race alone

-
- 3,037,57171.6%White alone
- 609,53814.4%Hispanic
- 252,7446.0%Two or more races
- 191,2834.5%Asian alone
- 78,2281.8%Black alone
- 29,3990.7%American Indian alone
- 25,7310.6%Other race alone
- 15,6430.4%Native Hawaiian and Other
Pacific Islander alone

Income and house value in Kellogg-Yoncalla
- Median household income in 2022
- $50,627White non-Hispanic householders
- $17,535American Indian and Alaska Native householders
- $138,033Asian householders
- $28,323Some other race householders
- $57,845Two or more races householders
- $37,938Hispanic or Latino race householders
- Median 2022 house value
- $365,835White Non-Hispanic householders
- $332,259American Indian or Alaska Native householders
- over $1,000,000Asian householders
- $393,465Native Hawaiian and other Pacific Islander householders
- $262,310Some other race householders
- $437,184Two or more races householders
- $332,259Hispanic or Latino householders
Household income for White non-Hispanic householders

Household income for American Indian and Alaska Native householders

Household income for Asian householders

Household income for Native Hawaiian and other Pacific Islander householders

Household income for Two or more races householders

Household income for Hispanic or Latino race householders

Zip code: 97499