Races in Kelso, Washington (WA) Detailed Stats
Data:
Races - White alone (%)
Races - White alone (% change since 2000)
Races - Black alone (%)
Races - Black alone (% change since 2000)
Races - American Indian alone (%)
Races - American Indian alone (% change since 2000)
Races - Asian alone (%)
Races - Asian alone (% change since 2000)
Races - Hispanic (%)
Races - Hispanic (% change since 2000)
Races - Native Hawaiian and Other Pacific Islander alone (%)
Races - Native Hawaiian and Other Pacific Islander alone (% change since 2000)
Races - Two or more races(%)
Races - Two or more races(% change since 2000)
Races - Other race alone (%)
Races - Other race alone (% change since 2000)
Racial diversity
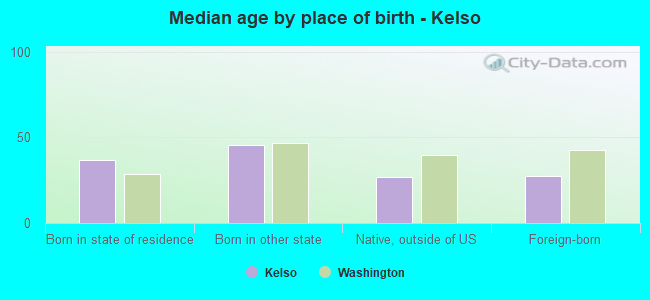
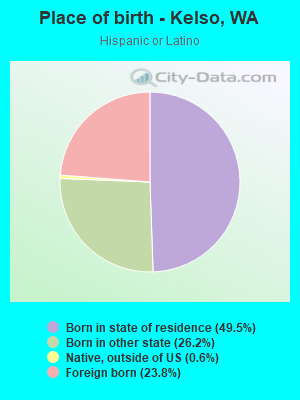
Place of birth - Born in state of residence (%)
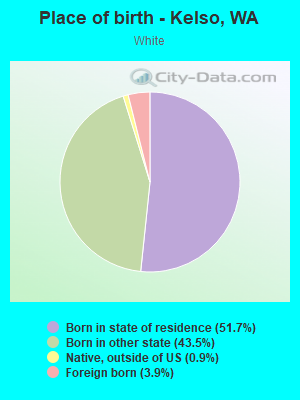
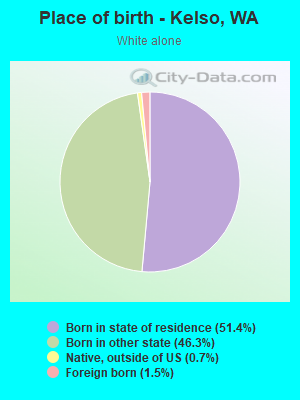
Place of birth - Born in state of residence (%) - White
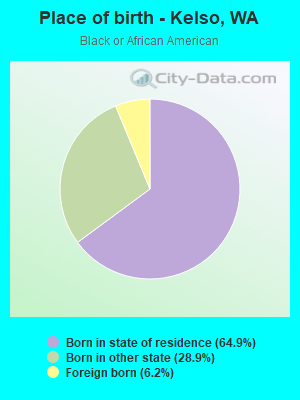
Place of birth - Born in state of residence (%) - Black or African American
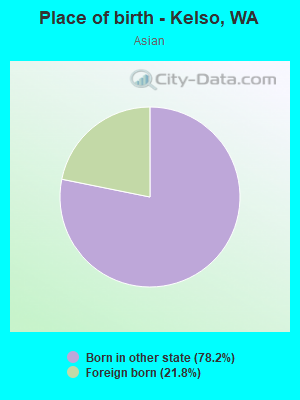
Place of birth - Born in state of residence (%) - Asian
Place of birth - Born in state of residence (%) - Hispanic or Latino
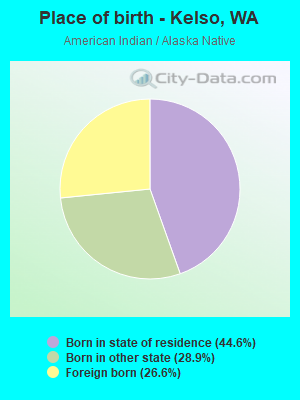
Place of birth - Born in state of residence (%) - American Indian and Alaska Native
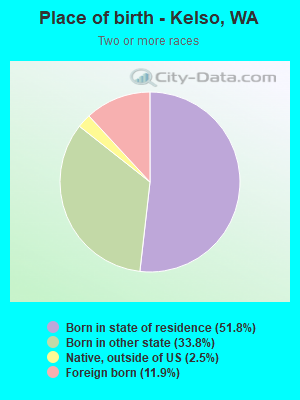
Place of birth - Born in state of residence (%) - Multirace
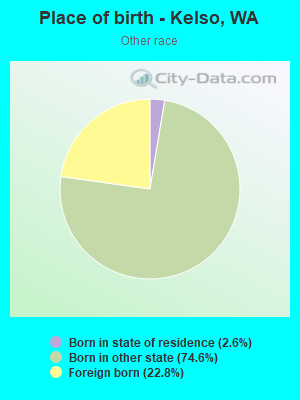
Place of birth - Born in state of residence (%) - Other Race
Place of birth - Born in other state (%)
Place of birth - Born in other state (%) - White
Place of birth - Born in other state (%) - Black or African American
Place of birth - Born in other state (%) - Asian
Place of birth - Born in other state (%) - Hispanic or Latino
Place of birth - Born in other state (%) - American Indian and Alaska Native
Place of birth - Born in other state (%) - Multirace
Place of birth - Born in other state (%) - Other Race
Place of birth - Native, outside of US (%)
Place of birth - Native, outside of US (%) - White
Place of birth - Native, outside of US (%) - Black or African American
Place of birth - Native, outside of US (%) - Asian
Place of birth - Native, outside of US (%) - Hispanic or Latino
Place of birth - Native, outside of US (%) - American Indian and Alaska Native
Place of birth - Native, outside of US (%) - Multirace
Place of birth - Native, outside of US (%) - Other Race
Place of birth - Foreign born (%)
Place of birth - Foreign born (%) - White
Place of birth - Foreign born (%) - Black or African American
Place of birth - Foreign born (%) - Asian
Place of birth - Foreign born (%) - Hispanic or Latino
Place of birth - Foreign born (%) - American Indian and Alaska Native
Place of birth - Foreign born (%) - Multirace
Place of birth - Foreign born (%) - Other Race
Residents speaking English at home (%)
Residents speaking English at home - Born in the United States (%)
Residents speaking English at home - Native, born elsewhere (%)
Residents speaking English at home - Foreign born (%)
Residents speaking Spanish at home (%)
Residents speaking Spanish at home - Born in the United States (%)
Residents speaking Spanish at home - Native, born elsewhere (%)
Residents speaking Spanish at home - Foreign born (%)
Residents speaking other language at home (%)
Residents speaking other language at home - Born in the United States (%)
Residents speaking other language at home - Native, born elsewhere (%)
Residents speaking other language at home - Foreign born (%)
Marital status - Never married (%)
Marital status - Now married (%)
Marital status - Separated (%)
Marital status - Widowed (%)
Marital status - Divorced (%)
Ancestries Reported - Arab (%)
Ancestries Reported - Czech (%)
Ancestries Reported - Danish (%)
Ancestries Reported - Dutch (%)
Ancestries Reported - English (%)
Ancestries Reported - French (%)
Ancestries Reported - French Canadian (%)
Ancestries Reported - German (%)
Ancestries Reported - Greek (%)
Ancestries Reported - Hungarian (%)
Ancestries Reported - Irish (%)
Ancestries Reported - Italian (%)
Ancestries Reported - Lithuanian (%)
Ancestries Reported - Norwegian (%)
Ancestries Reported - Polish (%)
Ancestries Reported - Portuguese (%)
Ancestries Reported - Russian (%)
Ancestries Reported - Scotch-Irish (%)
Ancestries Reported - Scottish (%)
Ancestries Reported - Slovak (%)
Ancestries Reported - Subsaharan African (%)
Ancestries Reported - Swedish (%)
Ancestries Reported - Swiss (%)
Ancestries Reported - Ukrainian (%)
Ancestries Reported - United States (%)
Ancestries Reported - Welsh (%)
Ancestries Reported - West Indian (%)
Ancestries Reported - Other (%)
Geographical mobility - Same house 1 year ago (%)
Geographical mobility - Same house 1 year ago (%) - White
Geographical mobility - Same house 1 year ago (%) - Black or African American
Geographical mobility - Same house 1 year ago (%) - Asian
Geographical mobility - Same house 1 year ago (%) - Hispanic or Latino
Geographical mobility - Same house 1 year ago (%) - American Indian and Alaska Native
Geographical mobility - Same house 1 year ago (%) - Multirace
Geographical mobility - Same house 1 year ago (%) - Other Race
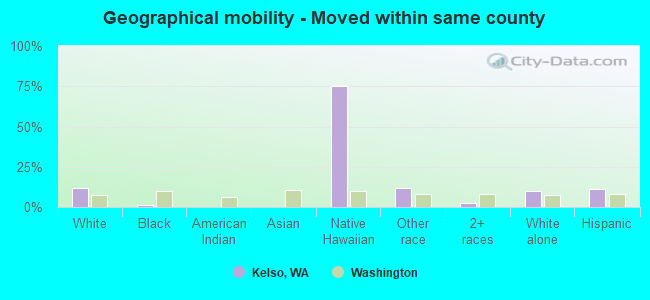
Geographical mobility - Moved within same county (%)
Geographical mobility - Moved within same county (%) - White
Geographical mobility - Moved within same county (%) - Black or African American
Geographical mobility - Moved within same county (%) - Asian
Geographical mobility - Moved within same county (%) - Hispanic or Latino
Geographical mobility - Moved within same county (%) - American Indian and Alaska Native
Geographical mobility - Moved within same county (%) - Multirace
Geographical mobility - Moved within same county (%) - Other Race
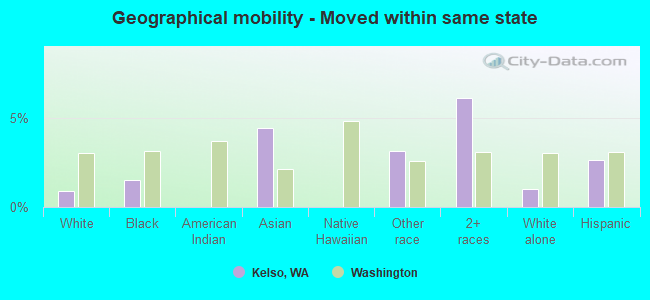
Geographical mobility - Moved from different county within same state (%)
Geographical mobility - Moved from different county within same state (%) - White
Geographical mobility - Moved from different county within same state (%) - Black or African American
Geographical mobility - Moved from different county within same state (%) - Asian
Geographical mobility - Moved from different county within same state (%) - Hispanic or Latino
Geographical mobility - Moved from different county within same state (%) - American Indian and Alaska Native
Geographical mobility - Moved from different county within same state (%) - Multirace
Geographical mobility - Moved from different county within same state (%) - Other Race
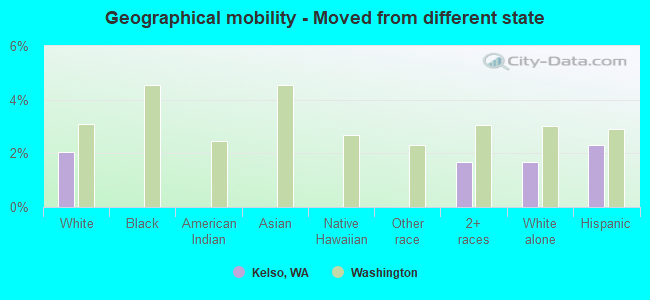
Geographical mobility - Moved from different state (%)
Geographical mobility - Moved from different state (%) - White
Geographical mobility - Moved from different state (%) - Black or African American
Geographical mobility - Moved from different state (%) - Asian
Geographical mobility - Moved from different state (%) - Hispanic or Latino
Geographical mobility - Moved from different state (%) - American Indian and Alaska Native
Geographical mobility - Moved from different state (%) - Multirace
Geographical mobility - Moved from different state (%) - Other Race
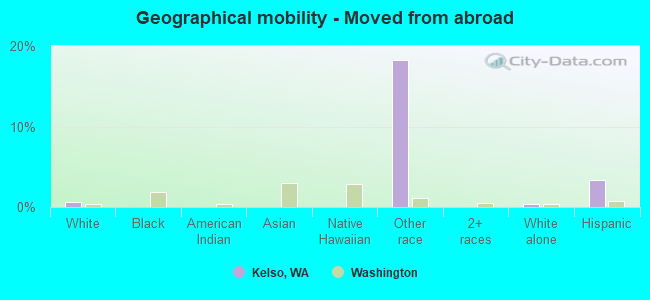
Geographical mobility - Moved from abroad (%)
Geographical mobility - Moved from abroad (%) - White
Geographical mobility - Moved from abroad (%) - Black or African American
Geographical mobility - Moved from abroad (%) - Asian
Geographical mobility - Moved from abroad (%) - Hispanic or Latino
Geographical mobility - Moved from abroad (%) - American Indian and Alaska Native
Geographical mobility - Moved from abroad (%) - Multirace
Geographical mobility - Moved from abroad (%) - Other Race
Place of birth for the foreign-born population - Ireland (%)
Place of birth for the foreign-born population - Denmark (%)
Place of birth for the foreign-born population - Norway (%)
Place of birth for the foreign-born population - Sweden (%)
Place of birth for the foreign-born population - United Kingdom (%)
Place of birth for the foreign-born population - England (%)
Place of birth for the foreign-born population - Scotland (%)
Place of birth for the foreign-born population - Other Northern Europe (%)
Place of birth for the foreign-born population - Austria (%)
Place of birth for the foreign-born population - Belgium (%)
Place of birth for the foreign-born population - France (%)
Place of birth for the foreign-born population - Germany (%)
Place of birth for the foreign-born population - Netherlands (%)
Place of birth for the foreign-born population - Switzerland (%)
Place of birth for the foreign-born population - Other Western Europe (%)
Place of birth for the foreign-born population - Greece (%)
Place of birth for the foreign-born population - Italy (%)
Place of birth for the foreign-born population - Portugal (%)
Place of birth for the foreign-born population - Spain (%)
Place of birth for the foreign-born population - Other Southern Europe (%)
Place of birth for the foreign-born population - Albania (%)
Place of birth for the foreign-born population - Belarus (%)
Place of birth for the foreign-born population - Bosnia and Herzegovina (%)
Place of birth for the foreign-born population - Bulgaria (%)
Place of birth for the foreign-born population - Croatia (%)
Place of birth for the foreign-born population - Czechoslovakia (%)
Place of birth for the foreign-born population - Hungary (%)
Place of birth for the foreign-born population - Latvia (%)
Place of birth for the foreign-born population - Lithuania (%)
Place of birth for the foreign-born population - North Macedonia (Macedonia) (%)
Place of birth for the foreign-born population - Moldova (%)
Place of birth for the foreign-born population - Poland (%)
Place of birth for the foreign-born population - Romania (%)
Place of birth for the foreign-born population - Russia (%)
Place of birth for the foreign-born population - Serbia (%)
Place of birth for the foreign-born population - Ukraine (%)
Place of birth for the foreign-born population - Other Eastern Europe (%)
Place of birth for the foreign-born population - China (%)
Place of birth for the foreign-born population - Hong Kong (%)
Place of birth for the foreign-born population - Taiwan (%)
Place of birth for the foreign-born population - Japan (%)
Place of birth for the foreign-born population - Korea (%)
Place of birth for the foreign-born population - Other Eastern Asia (%)
Place of birth for the foreign-born population - Afghanistan (%)
Place of birth for the foreign-born population - Bangladesh (%)
Place of birth for the foreign-born population - India (%)
Place of birth for the foreign-born population - Iran (%)
Place of birth for the foreign-born population - Kazakhstan (%)
Place of birth for the foreign-born population - Nepal (%)
Place of birth for the foreign-born population - Pakistan (%)
Place of birth for the foreign-born population - Sri Lanka (%)
Place of birth for the foreign-born population - Uzbekistan (%)
Place of birth for the foreign-born population - Other South Central Asia (%)
Place of birth for the foreign-born population - Burma (%)
Place of birth for the foreign-born population - Cambodia (%)
Place of birth for the foreign-born population - Indonesia (%)
Place of birth for the foreign-born population - Laos (%)
Place of birth for the foreign-born population - Malaysia (%)
Place of birth for the foreign-born population - Philippines (%)
Place of birth for the foreign-born population - Singapore (%)
Place of birth for the foreign-born population - Thailand (%)
Place of birth for the foreign-born population - Vietnam (%)
Place of birth for the foreign-born population - Other South Eastern Asia (%)
Place of birth for the foreign-born population - Armenia (%)
Place of birth for the foreign-born population - Iraq (%)
Place of birth for the foreign-born population - Israel (%)
Place of birth for the foreign-born population - Jordan (%)
Place of birth for the foreign-born population - Kuwait (%)
Place of birth for the foreign-born population - Lebanon (%)
Place of birth for the foreign-born population - Saudi Arabia (%)
Place of birth for the foreign-born population - Syria (%)
Place of birth for the foreign-born population - Turkey (%)
Place of birth for the foreign-born population - Yemen (%)
Place of birth for the foreign-born population - Other Western Asia (%)
Place of birth for the foreign-born population - Eritrea (%)
Place of birth for the foreign-born population - Ethiopia (%)
Place of birth for the foreign-born population - Kenya (%)
Place of birth for the foreign-born population - Somalia (%)
Place of birth for the foreign-born population - Uganda (%)
Place of birth for the foreign-born population - Zimbabwe (%)
Place of birth for the foreign-born population - Other Eastern Africa (%)
Place of birth for the foreign-born population - Cameroon (%)
Place of birth for the foreign-born population - Congo (%)
Place of birth for the foreign-born population - Democratic Republic of Congo (Zaire) (%)
Place of birth for the foreign-born population - Other Middle Africa (%)
Place of birth for the foreign-born population - Egypt (%)
Place of birth for the foreign-born population - Morocco (%)
Place of birth for the foreign-born population - Sudan (%)
Place of birth for the foreign-born population - Other Northern Africa (%)
Place of birth for the foreign-born population - South Africa (%)
Place of birth for the foreign-born population - Other Southern Africa (%)
Place of birth for the foreign-born population - Cabo Verde (%)
Place of birth for the foreign-born population - Ghana (%)
Place of birth for the foreign-born population - Liberia (%)
Place of birth for the foreign-born population - Nigeria (%)
Place of birth for the foreign-born population - Senegal (%)
Place of birth for the foreign-born population - Sierra Leone (%)
Place of birth for the foreign-born population - Other Western Africa (%)
Place of birth for the foreign-born population - Australia (%)
Place of birth for the foreign-born population - New Zealand (%)
Place of birth for the foreign-born population - Fiji (%)
Place of birth for the foreign-born population - Micronesia (%)
Place of birth for the foreign-born population - Bahamas (%)
Place of birth for the foreign-born population - Barbados (%)
Place of birth for the foreign-born population - Cuba (%)
Place of birth for the foreign-born population - Dominica (%)
Place of birth for the foreign-born population - Dominican Republic (%)
Place of birth for the foreign-born population - Grenada (%)
Place of birth for the foreign-born population - Haiti (%)
Place of birth for the foreign-born population - Jamaica (%)
Place of birth for the foreign-born population - St. Vincent and the Grenadines (%)
Place of birth for the foreign-born population - Trinidad and Tobago (%)
Place of birth for the foreign-born population - West Indies (%)
Place of birth for the foreign-born population - Other Caribbean (%)
Place of birth for the foreign-born population - Belize (%)
Place of birth for the foreign-born population - Costa Rica (%)
Place of birth for the foreign-born population - El Salvador (%)
Place of birth for the foreign-born population - Guatemala (%)
Place of birth for the foreign-born population - Honduras (%)
Place of birth for the foreign-born population - Mexico (%)
Place of birth for the foreign-born population - Nicaragua (%)
Place of birth for the foreign-born population - Panama (%)
Place of birth for the foreign-born population - Other Central America (%)
Place of birth for the foreign-born population - Argentina (%)
Place of birth for the foreign-born population - Bolivia (%)
Place of birth for the foreign-born population - Brazil (%)
Place of birth for the foreign-born population - Chile (%)
Place of birth for the foreign-born population - Colombia (%)
Place of birth for the foreign-born population - Ecuador (%)
Place of birth for the foreign-born population - Guyana (%)
Place of birth for the foreign-born population - Peru (%)
Place of birth for the foreign-born population - Uruguay (%)
Place of birth for the foreign-born population - Venezuela (%)
Place of birth for the foreign-born population - Other South America (%)
Place of birth for the foreign-born population - Canada (%)
Place of birth for the foreign-born population - Other Northern America (%)
Place of birth for the foreign-born population - Other (%)
Latest news about races in Kelso, WA collected exclusively by city-data.com from local newspapers, TV, and radio stations
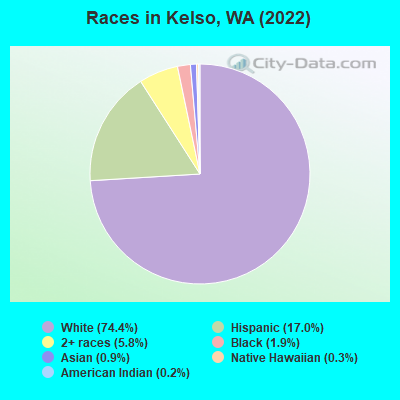
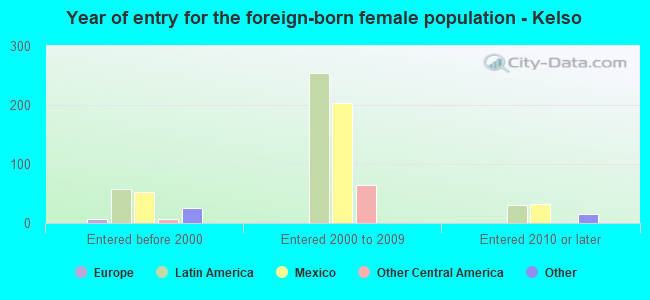
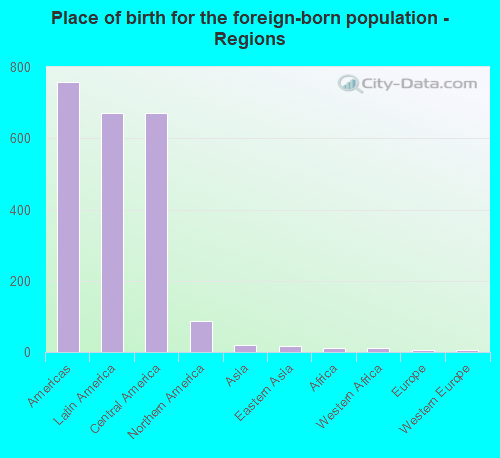
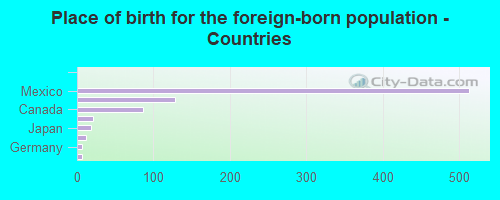
According to 2022 data, the most numerous races in Kelso, WA are White alone (9,528 residents), Hispanic (2,182 residents), and Asian alone (117 residents). 88.9% of Kelso residents speak English at home. 6.3% of Kelso, WA residents are foreign-born (5.1% born in Latin America, 0.7% born in North America), which is 140.0% less than the foreign-born rate of 15.0% across the entire state of Washington.
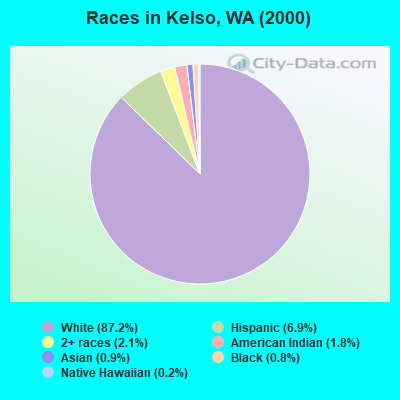
Race distribution in Kelso
2000 2022
4,652,490 78.9% White alone 441,509 7.5% Hispanic 319,401 5.4% Asian alone 184,631 3.1% Black alone 175,926 3.0% Two or more races 85,396 1.4% American Indian alone 22,779 0.4% Native Hawaiian and Other 11,989 0.2% Other race alone
4,941,456 63.5% White alone 1,093,313 14.0% Hispanic 755,832 9.7% Asian alone 523,448 6.7% Two or more races 299,537 3.8% Black alone 69,024 0.9% American Indian alone 52,231 0.7% Native Hawaiian and Other 50,945 0.7% Other race alone
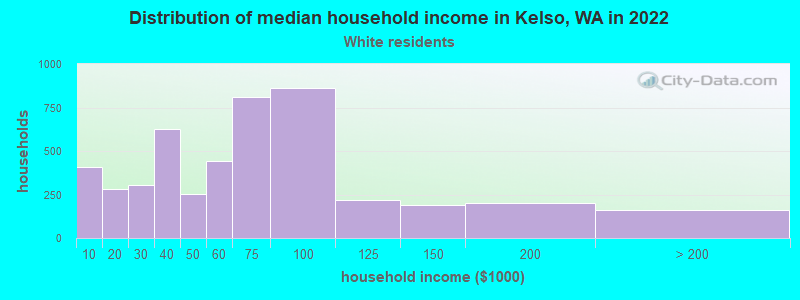
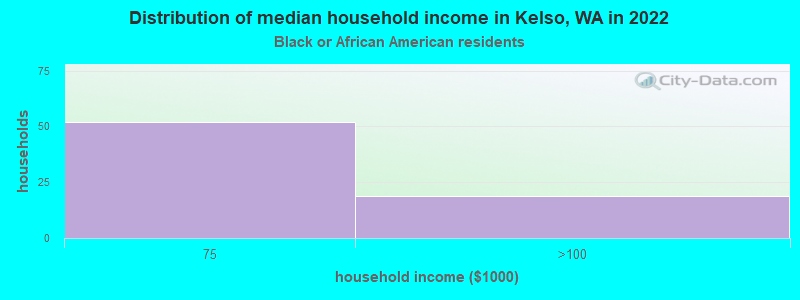
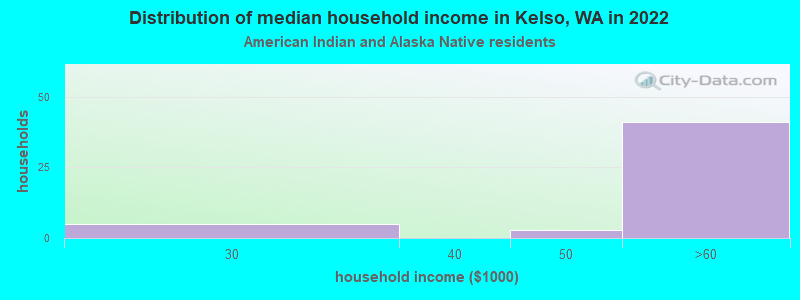
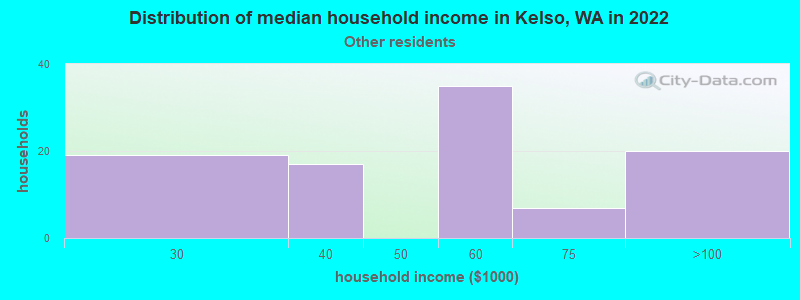
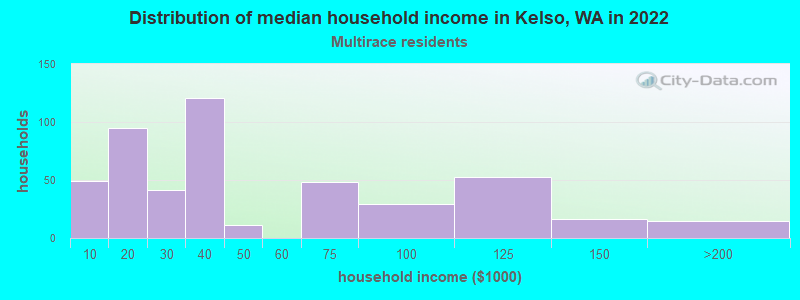
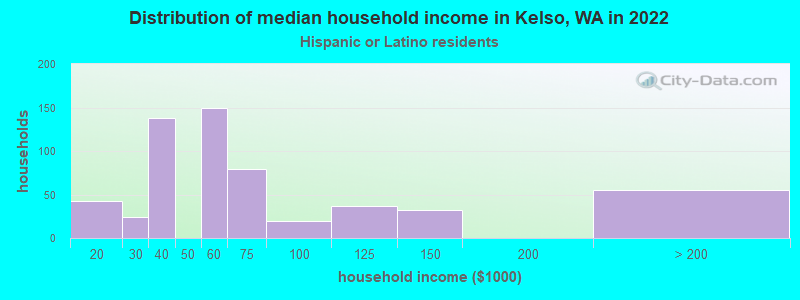
Income and house value in Kelso Median household income in 2022 $60,280 White non-Hispanic householders$62,141 American Indian and Alaska Native householders$58,843 Some other race householders$44,510 Two or more races householders$60,150 Hispanic or Latino race householdersMedian 2022 house value $338,872 White Non-Hispanic householders$456,910 American Indian or Alaska Native householders $797,555 Asian householders$376,800 Two or more races householders$487,395 Hispanic or Latino householders
Median age by race in Kelso
40.5 Median age for White residents39.8 41.0 25.9 Median age for Black or African American residents19.8 49.3 11.3 Median age for American Indian / Alaska Native residents10.8 16.9 64.4 Median age for Asian residents46.0 -557,548,579.4 57.6 Median age for Native Hawaiian / Pacific Islander residents-696,774,192.9 24.2 30.6 Median age for Other race residents26.0 61.8 34.3 Median age for Two or more races residents18.8 32.9 42.7 Median age for White alone residents42.3 44.7 22.0 Median age for Hispanic or Latino residents18.0 24.1
Owner/renter occupied households by race in Kelso
House owners and renters - White residents 2,978 65.0% Owner occupied1,602 35.0% Renter occupiedHouse owners and renters - Black or African American residents 87 100.0% Renter occupiedHouse owners and renters - American Indian / Alaska Native residents 60 89.3% Owner occupied7 10.7% Renter occupiedHouse owners and renters - Asian residents 30 100.0% Owner occupiedHouse owners and renters - Other race residents 48 33.4% Owner occupied95 66.6% Renter occupiedHouse owners and renters - Two or more races residents 222 53.9% Owner occupied190 46.1% Renter occupiedHouse owners and renters - White alone residents 2,846 65.6% Owner occupied1,489 34.4% Renter occupiedHouse owners and renters - Hispanic or Latino residents 226 43.1% Owner occupied298 56.9% Renter occupied
Language usage in Kelso
English speakers - Total 88.9% of residents of Kelso speak English at home.
10.3% of residents speak Spanish at home 893 71.8% Speak English very well351 28.2% Speak English less than very well1.3% of residents speak other language at home 131 80.9% Speak English very well31 19.1% Speak English less than very well
English speakers - Born in the United States 94.4% of residents of Kelso speak English at home.
4.4% of residents speak Spanish at home 175 74.5% Speak English very well60 25.5% Speak English less than very well1.1% of residents speak other language at home 59 100.0% Speak English very well
English speakers - Native, born elsewhere 63.6% of residents of Kelso speak English at home.
34.5% of residents speak other language at home 38 100.0% Speak English very well
English speakers - Foreign-born 10.6% of residents of Kelso speak English at home.
80.3% of residents speak Spanish at home 417 68.7% Speak English very well190 31.3% Speak English less than very well6.2% of residents speak other language at home 29 61.7% Speak English very well18 38.3% Speak English less than very well
White (Caucasian) - Speak only English Native:
99.1% (9,423)Foreign-born:
19.1% (77)
White (Caucasian) - Speak another language Native:
1.2% (112)Foreign-born:
80.9% (326)
Black or African American - Speak only English Native:
100.0% (184)Foreign-born:
100.0% (12)
American Indian / Alaska Native - Speak another language Native:
82.3% (144)Foreign-born:
100.0% (120)
Asian - Speak another language Native:
33.8% (24)Foreign-born:
97.1% (25)
Other race - Speak another language Native:
30.1% (78)Foreign-born:
100.0% (60)
Two or more races - Speak another language Native:
27.9% (297)Foreign-born:
100.0% (154)
White alone - Speak only English Native:
99.2% (8,889)Foreign-born:
66.5% (94)
White alone - Speak another language Native:
1.0% (86)Foreign-born:
11.0% (15)
Hispanic or Latino - Speak another language Native:
36.8% (509)Foreign-born:
100.0% (494)
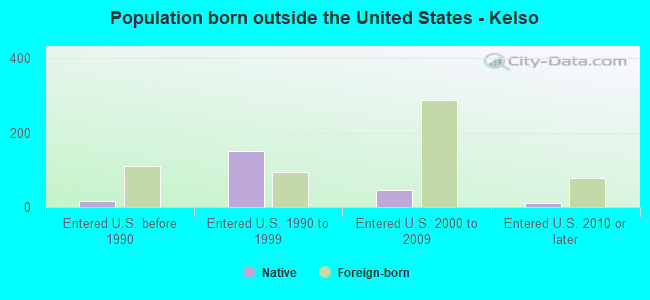
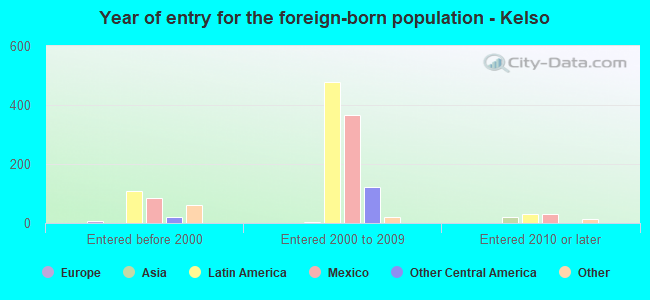
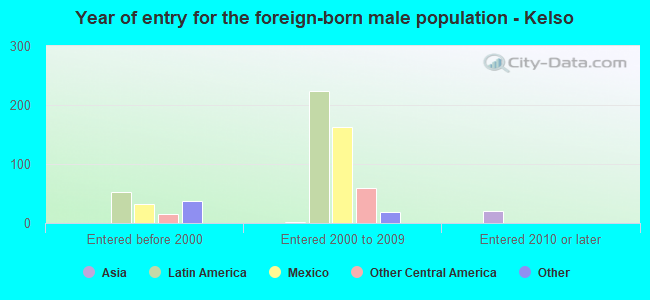
Foreign-born residents in Kelso 801 residents are foreign born (5.1% Latin America , 0.7% North America ).
This city:
6.3%Washington:
14.9%
Marital status for residents in Kelso Marital status - White (Caucasian) population 15 years and over
Males 32.6% Never married46.9% Now married3.4% Separated5.4% Widowed11.7% DivorcedFemales 27.2% Never married44.0% Now married3.3% Separated7.9% Widowed17.7% DivorcedWomen who gave birth in the past 12 months Now married:
50.7% (68)Unmarried:
49.3% (66)
Women who did not give birth in the past 12 months Now married:
43.0% (930)Unmarried:
57.0% (1,230)
Marital status - Black or African American population 15 years and over
Males 52.1% Never married43.8% Now married0.0% Separated0.0% Widowed4.2% DivorcedFemales 28.3% Never married11.3% Now married0.0% Separated0.0% Widowed60.4% DivorcedWomen who did not give birth in the past 12 months Now married:
11.3% (12)Unmarried:
88.7% (94)
Marital status - American Indian / Alaska Native population 15 years and over
Males 84.1% Never married15.9% Now married0.0% Separated0.0% Widowed0.0% DivorcedFemales 81.8% Never married0.0% Now married0.0% Separated0.0% Widowed18.2% DivorcedWomen who did not give birth in the past 12 months Now married:
0.0% (0)Unmarried:
100.0% (71)
Marital status - Asian population 15 years and over
Males 0.0% Never married62.2% Now married0.0% Separated0.0% Widowed37.8% DivorcedFemales 0.0% Never married100.0% Now married0.0% Separated0.0% Widowed0.0% DivorcedWomen who did not give birth in the past 12 months Now married:
100.0% (29)Unmarried:
0.0% (0)
Marital status - Native Hawaiian / Pacific Islander population 15 years and over
Males 0.0% Never married100.0% Now married0.0% Separated0.0% Widowed0.0% DivorcedFemales 100.0% Never married0.0% Now married0.0% Separated0.0% Widowed0.0% DivorcedWomen who did not give birth in the past 12 months Now married:
0.0% (0)Unmarried:
100.0% (5)
Marital status - Other race population 15 years and over
Males 100.0% Never married0.0% Now married0.0% Separated0.0% Widowed0.0% DivorcedFemales 39.8% Never married7.2% Now married0.0% Separated0.0% Widowed53.0% DivorcedWomen who gave birth in the past 12 months Now married:
0.0% (0)Unmarried:
100.0% (21)
Women who did not give birth in the past 12 months Now married:
14.0% (7)Unmarried:
86.0% (43)
Marital status - Two or more races population 15 years and over
Males 50.0% Never married27.6% Now married7.1% Separated7.1% Widowed8.2% DivorcedFemales 46.7% Never married38.6% Now married0.0% Separated2.4% Widowed12.3% DivorcedWomen who gave birth in the past 12 months Now married:
100.0% (14)Unmarried:
0.0% (0)
Women who did not give birth in the past 12 months Now married:
25.5% (98)Unmarried:
74.5% (286)
Marital status - White alone, not Hispanic / Latino population 15 years and over
Males 31.1% Never married46.6% Now married3.5% Separated6.0% Widowed12.8% DivorcedFemales 23.6% Never married45.6% Now married3.2% Separated8.6% Widowed19.0% DivorcedWomen who gave birth in the past 12 months Now married:
54.9% (27)Unmarried:
45.1% (23)
Women who did not give birth in the past 12 months Now married:
45.2% (901)Unmarried:
54.8% (1,091)
Marital status - Hispanic or Latino population 15 years and over
Males 63.3% Never married32.0% Now married1.6% Separated3.1% Widowed0.0% DivorcedFemales 70.1% Never married18.6% Now married2.6% Separated0.0% Widowed8.6% DivorcedWomen who gave birth in the past 12 months Now married:
40.4% (46)Unmarried:
59.6% (68)
Women who did not give birth in the past 12 months Now married:
16.6% (73)Unmarried:
83.4% (365)
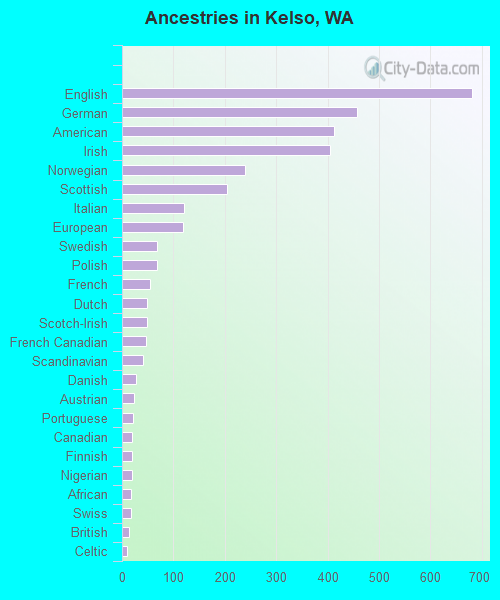
Ancestries in Kelso
680 11.4% English458 7.6% German413 6.9% American405 6.8% Irish240 4.0% Norwegian205 3.4% Scottish120 2.0% Italian119 2.0% European69 1.2% Swedish68 1.1% Polish54 0.9% French49 0.8% Dutch49 0.8% Scotch-Irish47 0.8% French Canadian41 0.7% Scandinavian27 0.5% Danish24 0.4% Austrian22 0.4% Portuguese20 0.3% Canadian20 0.3% Finnish19 0.3% Nigerian17 0.3% African17 0.3% Swiss14 0.2% British10 0.2% Celtic6 0.1% Lithuanian
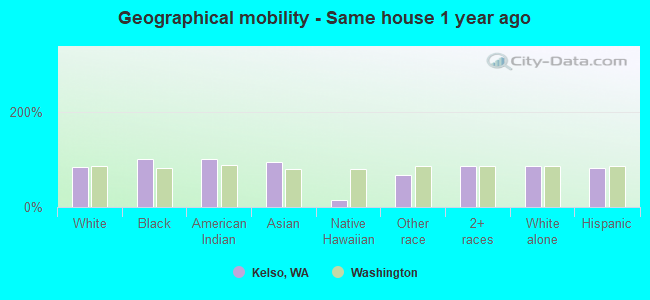
Geographical mobility in Kelso Same house 1 year ago 8,685 84.3% White (Caucasian)250 100.0% Black or African American454 100.0% American Indian / Alaska Native103 93.6% Asian5 13.9% Native Hawaiian / Pacific Islander148 66.8% Other race1,115 86.4% Two or more races8,221 86.4% White alone, not Hispanic / Latino1,677 80.7% Hispanic or LatinoMoved within same county 1,193 11.6% White / Caucasian2 1.0% Black or African American29 75.2% Native Hawaiian / Pacific Islander26 11.7% Other race35 2.7% Two or more races957 10.1% White alone, not Hispanic / Latino235 11.3% Hispanic or LatinoMoved within same state 94 0.9% White / Caucasian4 1.5% Black or African American5 4.4% Asian7 3.1% Other race79 6.1% Two or more races95 1.0% White alone, not Hispanic / Latino55 2.6% Hispanic or LatinoMoved from different state 211 2.0% White / Caucasian22 1.7% Two or more races159 1.7% White alone, not Hispanic / Latino48 2.3% Hispanic or LatinoMoved from abroad 64 0.6% White41 18.2% Other race36 0.4% White alone, not Hispanic / Latino71 3.4% Hispanic or Latino
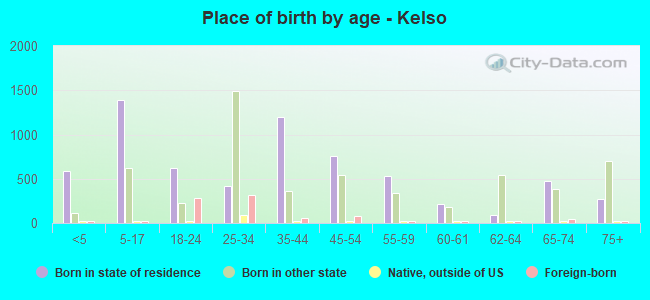
Children Nativity (place of birth) in Kelso
Children under 6 years - Living with two parents Both parents native 234 100.0% NativeBoth parents foreign-born 40 100.0% NativeOne native, one foreign-born parent 40 100.0% NativeChildren under 6 years - Living with one parent Native parent 249 100.0% NativeForeign-born parent 176 100.0% NativeChildren 6 to 17 years - Living with two parents Both parents native 700 100.0% NativeBoth parents foreign-born 33 100.0% NativeOne native, one foreign-born parent 20 100.0% NativeChildren 6 to 17 years - Living with one parent Native parent 846 100.0% NativeForeign-born parent 226 48.7% Native239 51.3% Foreign-born
Grandparents responsible for own grandchildren in Kelso
Grandparents (30 to 59 years) White / Caucasian 34 7.4% Responsible for grandchildren422 92.6% Not responsible for grandchildrenAmerican Indian / Alaska Native 5 100.0% Responsible for grandchildrenWhite alone, not Hispanic / Latino 34 21.9% Responsible for grandchildren121 78.1% Not responsible for grandchildrenHispanic or Latino 48 100.0% Not responsible for grandchildrenGrandparents (60 years and over) White / Caucasian 101 59.0% Responsible for grandchildren70 41.0% Not responsible for grandchildrenWhite alone, not Hispanic / Latino 113 60.2% Responsible for grandchildren75 39.8% Not responsible for grandchildren