Races in Kenmore, Washington (WA) Detailed Stats
Data:
Races - White alone (%)
Races - White alone (% change since 2000)
Races - Black alone (%)
Races - Black alone (% change since 2000)
Races - American Indian alone (%)
Races - American Indian alone (% change since 2000)
Races - Asian alone (%)
Races - Asian alone (% change since 2000)
Races - Hispanic (%)
Races - Hispanic (% change since 2000)
Races - Native Hawaiian and Other Pacific Islander alone (%)
Races - Native Hawaiian and Other Pacific Islander alone (% change since 2000)
Races - Two or more races(%)
Races - Two or more races(% change since 2000)
Races - Other race alone (%)
Races - Other race alone (% change since 2000)
Racial diversity
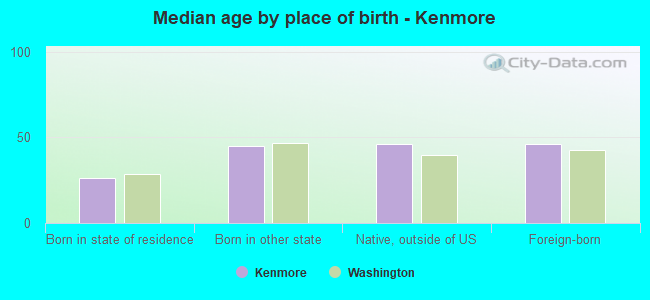
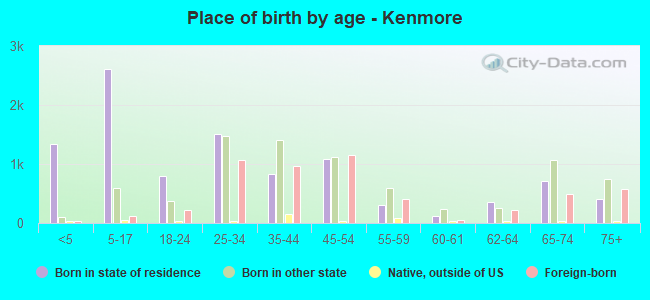
Place of birth - Born in state of residence (%)
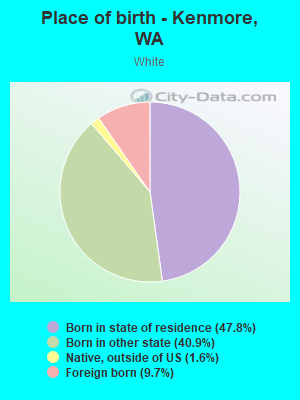
Place of birth - Born in state of residence (%) - White
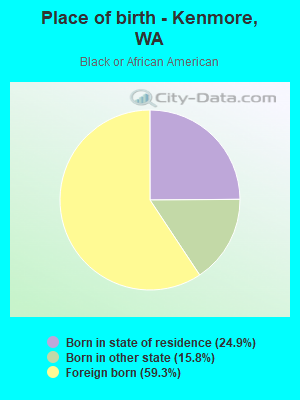
Place of birth - Born in state of residence (%) - Black or African American
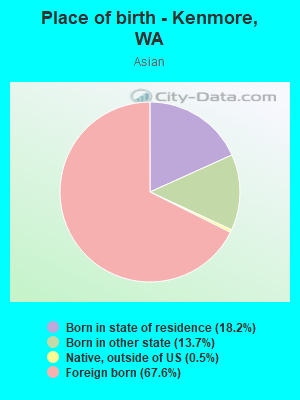
Place of birth - Born in state of residence (%) - Asian
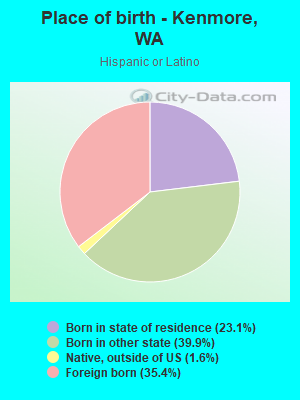
Place of birth - Born in state of residence (%) - Hispanic or Latino
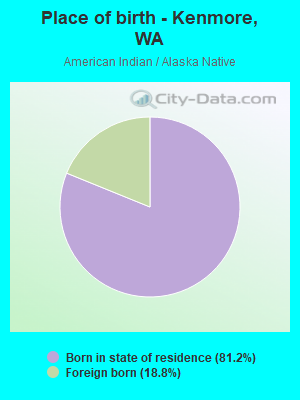
Place of birth - Born in state of residence (%) - American Indian and Alaska Native
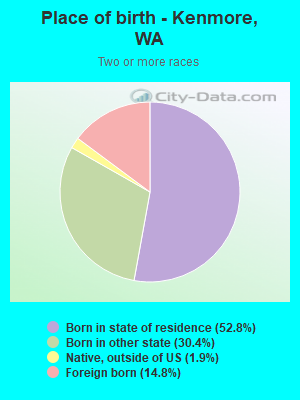
Place of birth - Born in state of residence (%) - Multirace
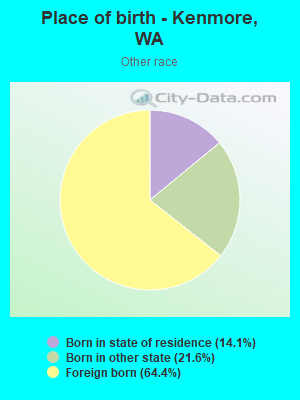
Place of birth - Born in state of residence (%) - Other Race
Place of birth - Born in other state (%)
Place of birth - Born in other state (%) - White
Place of birth - Born in other state (%) - Black or African American
Place of birth - Born in other state (%) - Asian
Place of birth - Born in other state (%) - Hispanic or Latino
Place of birth - Born in other state (%) - American Indian and Alaska Native
Place of birth - Born in other state (%) - Multirace
Place of birth - Born in other state (%) - Other Race
Place of birth - Native, outside of US (%)
Place of birth - Native, outside of US (%) - White
Place of birth - Native, outside of US (%) - Black or African American
Place of birth - Native, outside of US (%) - Asian
Place of birth - Native, outside of US (%) - Hispanic or Latino
Place of birth - Native, outside of US (%) - American Indian and Alaska Native
Place of birth - Native, outside of US (%) - Multirace
Place of birth - Native, outside of US (%) - Other Race
Place of birth - Foreign born (%)
Place of birth - Foreign born (%) - White
Place of birth - Foreign born (%) - Black or African American
Place of birth - Foreign born (%) - Asian
Place of birth - Foreign born (%) - Hispanic or Latino
Place of birth - Foreign born (%) - American Indian and Alaska Native
Place of birth - Foreign born (%) - Multirace
Place of birth - Foreign born (%) - Other Race
Residents speaking English at home (%)
Residents speaking English at home - Born in the United States (%)
Residents speaking English at home - Native, born elsewhere (%)
Residents speaking English at home - Foreign born (%)
Residents speaking Spanish at home (%)
Residents speaking Spanish at home - Born in the United States (%)
Residents speaking Spanish at home - Native, born elsewhere (%)
Residents speaking Spanish at home - Foreign born (%)
Residents speaking other language at home (%)
Residents speaking other language at home - Born in the United States (%)
Residents speaking other language at home - Native, born elsewhere (%)
Residents speaking other language at home - Foreign born (%)
Marital status - Never married (%)
Marital status - Now married (%)
Marital status - Separated (%)
Marital status - Widowed (%)
Marital status - Divorced (%)
Ancestries Reported - Arab (%)
Ancestries Reported - Czech (%)
Ancestries Reported - Danish (%)
Ancestries Reported - Dutch (%)
Ancestries Reported - English (%)
Ancestries Reported - French (%)
Ancestries Reported - French Canadian (%)
Ancestries Reported - German (%)
Ancestries Reported - Greek (%)
Ancestries Reported - Hungarian (%)
Ancestries Reported - Irish (%)
Ancestries Reported - Italian (%)
Ancestries Reported - Lithuanian (%)
Ancestries Reported - Norwegian (%)
Ancestries Reported - Polish (%)
Ancestries Reported - Portuguese (%)
Ancestries Reported - Russian (%)
Ancestries Reported - Scotch-Irish (%)
Ancestries Reported - Scottish (%)
Ancestries Reported - Slovak (%)
Ancestries Reported - Subsaharan African (%)
Ancestries Reported - Swedish (%)
Ancestries Reported - Swiss (%)
Ancestries Reported - Ukrainian (%)
Ancestries Reported - United States (%)
Ancestries Reported - Welsh (%)
Ancestries Reported - West Indian (%)
Ancestries Reported - Other (%)
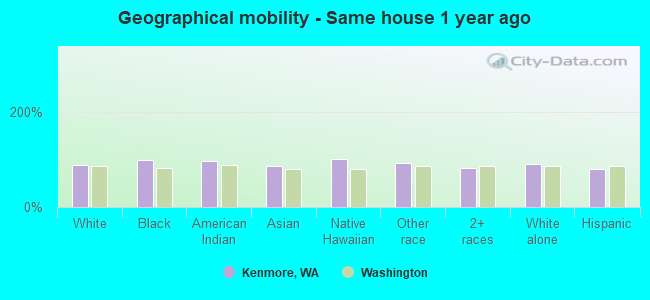
Geographical mobility - Same house 1 year ago (%)
Geographical mobility - Same house 1 year ago (%) - White
Geographical mobility - Same house 1 year ago (%) - Black or African American
Geographical mobility - Same house 1 year ago (%) - Asian
Geographical mobility - Same house 1 year ago (%) - Hispanic or Latino
Geographical mobility - Same house 1 year ago (%) - American Indian and Alaska Native
Geographical mobility - Same house 1 year ago (%) - Multirace
Geographical mobility - Same house 1 year ago (%) - Other Race
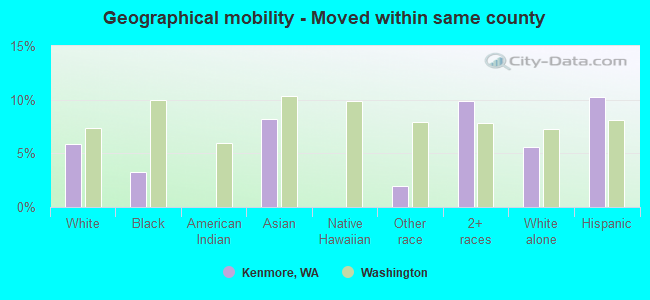
Geographical mobility - Moved within same county (%)
Geographical mobility - Moved within same county (%) - White
Geographical mobility - Moved within same county (%) - Black or African American
Geographical mobility - Moved within same county (%) - Asian
Geographical mobility - Moved within same county (%) - Hispanic or Latino
Geographical mobility - Moved within same county (%) - American Indian and Alaska Native
Geographical mobility - Moved within same county (%) - Multirace
Geographical mobility - Moved within same county (%) - Other Race
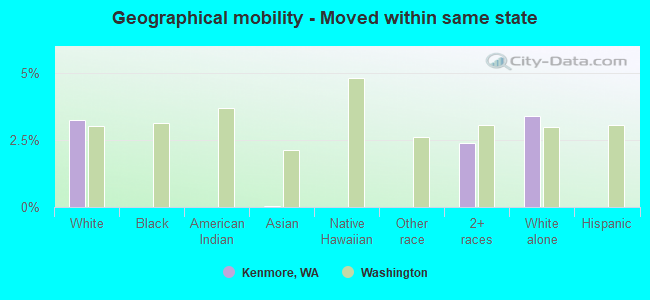
Geographical mobility - Moved from different county within same state (%)
Geographical mobility - Moved from different county within same state (%) - White
Geographical mobility - Moved from different county within same state (%) - Black or African American
Geographical mobility - Moved from different county within same state (%) - Asian
Geographical mobility - Moved from different county within same state (%) - Hispanic or Latino
Geographical mobility - Moved from different county within same state (%) - American Indian and Alaska Native
Geographical mobility - Moved from different county within same state (%) - Multirace
Geographical mobility - Moved from different county within same state (%) - Other Race
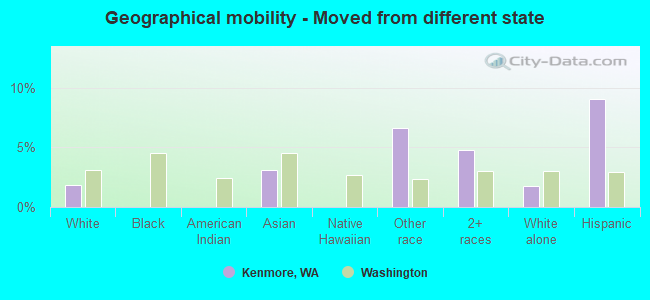
Geographical mobility - Moved from different state (%)
Geographical mobility - Moved from different state (%) - White
Geographical mobility - Moved from different state (%) - Black or African American
Geographical mobility - Moved from different state (%) - Asian
Geographical mobility - Moved from different state (%) - Hispanic or Latino
Geographical mobility - Moved from different state (%) - American Indian and Alaska Native
Geographical mobility - Moved from different state (%) - Multirace
Geographical mobility - Moved from different state (%) - Other Race
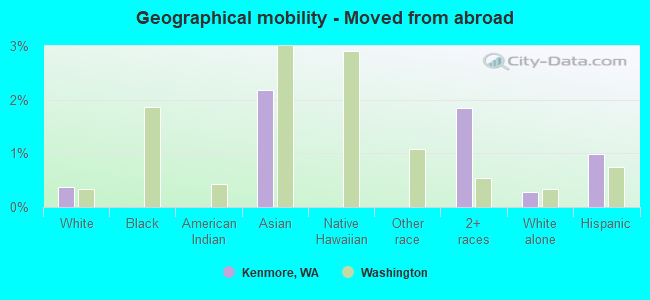
Geographical mobility - Moved from abroad (%)
Geographical mobility - Moved from abroad (%) - White
Geographical mobility - Moved from abroad (%) - Black or African American
Geographical mobility - Moved from abroad (%) - Asian
Geographical mobility - Moved from abroad (%) - Hispanic or Latino
Geographical mobility - Moved from abroad (%) - American Indian and Alaska Native
Geographical mobility - Moved from abroad (%) - Multirace
Geographical mobility - Moved from abroad (%) - Other Race
Place of birth for the foreign-born population - Ireland (%)
Place of birth for the foreign-born population - Denmark (%)
Place of birth for the foreign-born population - Norway (%)
Place of birth for the foreign-born population - Sweden (%)
Place of birth for the foreign-born population - United Kingdom (%)
Place of birth for the foreign-born population - England (%)
Place of birth for the foreign-born population - Scotland (%)
Place of birth for the foreign-born population - Other Northern Europe (%)
Place of birth for the foreign-born population - Austria (%)
Place of birth for the foreign-born population - Belgium (%)
Place of birth for the foreign-born population - France (%)
Place of birth for the foreign-born population - Germany (%)
Place of birth for the foreign-born population - Netherlands (%)
Place of birth for the foreign-born population - Switzerland (%)
Place of birth for the foreign-born population - Other Western Europe (%)
Place of birth for the foreign-born population - Greece (%)
Place of birth for the foreign-born population - Italy (%)
Place of birth for the foreign-born population - Portugal (%)
Place of birth for the foreign-born population - Spain (%)
Place of birth for the foreign-born population - Other Southern Europe (%)
Place of birth for the foreign-born population - Albania (%)
Place of birth for the foreign-born population - Belarus (%)
Place of birth for the foreign-born population - Bosnia and Herzegovina (%)
Place of birth for the foreign-born population - Bulgaria (%)
Place of birth for the foreign-born population - Croatia (%)
Place of birth for the foreign-born population - Czechoslovakia (%)
Place of birth for the foreign-born population - Hungary (%)
Place of birth for the foreign-born population - Latvia (%)
Place of birth for the foreign-born population - Lithuania (%)
Place of birth for the foreign-born population - North Macedonia (Macedonia) (%)
Place of birth for the foreign-born population - Moldova (%)
Place of birth for the foreign-born population - Poland (%)
Place of birth for the foreign-born population - Romania (%)
Place of birth for the foreign-born population - Russia (%)
Place of birth for the foreign-born population - Serbia (%)
Place of birth for the foreign-born population - Ukraine (%)
Place of birth for the foreign-born population - Other Eastern Europe (%)
Place of birth for the foreign-born population - China (%)
Place of birth for the foreign-born population - Hong Kong (%)
Place of birth for the foreign-born population - Taiwan (%)
Place of birth for the foreign-born population - Japan (%)
Place of birth for the foreign-born population - Korea (%)
Place of birth for the foreign-born population - Other Eastern Asia (%)
Place of birth for the foreign-born population - Afghanistan (%)
Place of birth for the foreign-born population - Bangladesh (%)
Place of birth for the foreign-born population - India (%)
Place of birth for the foreign-born population - Iran (%)
Place of birth for the foreign-born population - Kazakhstan (%)
Place of birth for the foreign-born population - Nepal (%)
Place of birth for the foreign-born population - Pakistan (%)
Place of birth for the foreign-born population - Sri Lanka (%)
Place of birth for the foreign-born population - Uzbekistan (%)
Place of birth for the foreign-born population - Other South Central Asia (%)
Place of birth for the foreign-born population - Burma (%)
Place of birth for the foreign-born population - Cambodia (%)
Place of birth for the foreign-born population - Indonesia (%)
Place of birth for the foreign-born population - Laos (%)
Place of birth for the foreign-born population - Malaysia (%)
Place of birth for the foreign-born population - Philippines (%)
Place of birth for the foreign-born population - Singapore (%)
Place of birth for the foreign-born population - Thailand (%)
Place of birth for the foreign-born population - Vietnam (%)
Place of birth for the foreign-born population - Other South Eastern Asia (%)
Place of birth for the foreign-born population - Armenia (%)
Place of birth for the foreign-born population - Iraq (%)
Place of birth for the foreign-born population - Israel (%)
Place of birth for the foreign-born population - Jordan (%)
Place of birth for the foreign-born population - Kuwait (%)
Place of birth for the foreign-born population - Lebanon (%)
Place of birth for the foreign-born population - Saudi Arabia (%)
Place of birth for the foreign-born population - Syria (%)
Place of birth for the foreign-born population - Turkey (%)
Place of birth for the foreign-born population - Yemen (%)
Place of birth for the foreign-born population - Other Western Asia (%)
Place of birth for the foreign-born population - Eritrea (%)
Place of birth for the foreign-born population - Ethiopia (%)
Place of birth for the foreign-born population - Kenya (%)
Place of birth for the foreign-born population - Somalia (%)
Place of birth for the foreign-born population - Uganda (%)
Place of birth for the foreign-born population - Zimbabwe (%)
Place of birth for the foreign-born population - Other Eastern Africa (%)
Place of birth for the foreign-born population - Cameroon (%)
Place of birth for the foreign-born population - Congo (%)
Place of birth for the foreign-born population - Democratic Republic of Congo (Zaire) (%)
Place of birth for the foreign-born population - Other Middle Africa (%)
Place of birth for the foreign-born population - Egypt (%)
Place of birth for the foreign-born population - Morocco (%)
Place of birth for the foreign-born population - Sudan (%)
Place of birth for the foreign-born population - Other Northern Africa (%)
Place of birth for the foreign-born population - South Africa (%)
Place of birth for the foreign-born population - Other Southern Africa (%)
Place of birth for the foreign-born population - Cabo Verde (%)
Place of birth for the foreign-born population - Ghana (%)
Place of birth for the foreign-born population - Liberia (%)
Place of birth for the foreign-born population - Nigeria (%)
Place of birth for the foreign-born population - Senegal (%)
Place of birth for the foreign-born population - Sierra Leone (%)
Place of birth for the foreign-born population - Other Western Africa (%)
Place of birth for the foreign-born population - Australia (%)
Place of birth for the foreign-born population - New Zealand (%)
Place of birth for the foreign-born population - Fiji (%)
Place of birth for the foreign-born population - Micronesia (%)
Place of birth for the foreign-born population - Bahamas (%)
Place of birth for the foreign-born population - Barbados (%)
Place of birth for the foreign-born population - Cuba (%)
Place of birth for the foreign-born population - Dominica (%)
Place of birth for the foreign-born population - Dominican Republic (%)
Place of birth for the foreign-born population - Grenada (%)
Place of birth for the foreign-born population - Haiti (%)
Place of birth for the foreign-born population - Jamaica (%)
Place of birth for the foreign-born population - St. Vincent and the Grenadines (%)
Place of birth for the foreign-born population - Trinidad and Tobago (%)
Place of birth for the foreign-born population - West Indies (%)
Place of birth for the foreign-born population - Other Caribbean (%)
Place of birth for the foreign-born population - Belize (%)
Place of birth for the foreign-born population - Costa Rica (%)
Place of birth for the foreign-born population - El Salvador (%)
Place of birth for the foreign-born population - Guatemala (%)
Place of birth for the foreign-born population - Honduras (%)
Place of birth for the foreign-born population - Mexico (%)
Place of birth for the foreign-born population - Nicaragua (%)
Place of birth for the foreign-born population - Panama (%)
Place of birth for the foreign-born population - Other Central America (%)
Place of birth for the foreign-born population - Argentina (%)
Place of birth for the foreign-born population - Bolivia (%)
Place of birth for the foreign-born population - Brazil (%)
Place of birth for the foreign-born population - Chile (%)
Place of birth for the foreign-born population - Colombia (%)
Place of birth for the foreign-born population - Ecuador (%)
Place of birth for the foreign-born population - Guyana (%)
Place of birth for the foreign-born population - Peru (%)
Place of birth for the foreign-born population - Uruguay (%)
Place of birth for the foreign-born population - Venezuela (%)
Place of birth for the foreign-born population - Other South America (%)
Place of birth for the foreign-born population - Canada (%)
Place of birth for the foreign-born population - Other Northern America (%)
Place of birth for the foreign-born population - Other (%)
Latest news about races in Kenmore, WA collected exclusively by city-data.com from local newspapers, TV, and radio stations
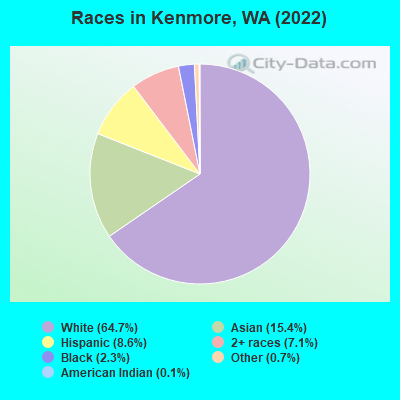
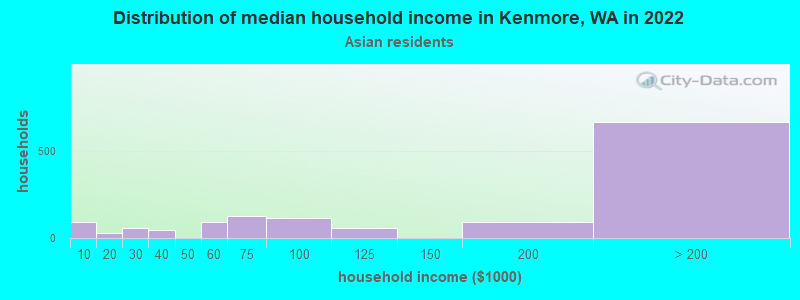
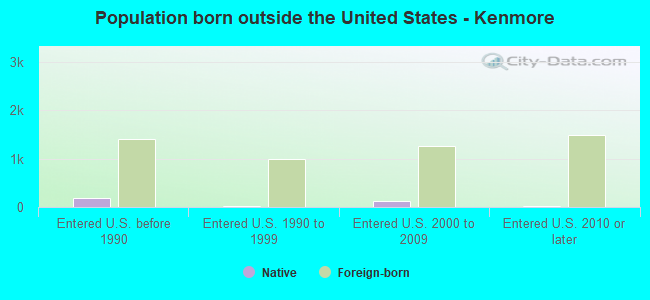
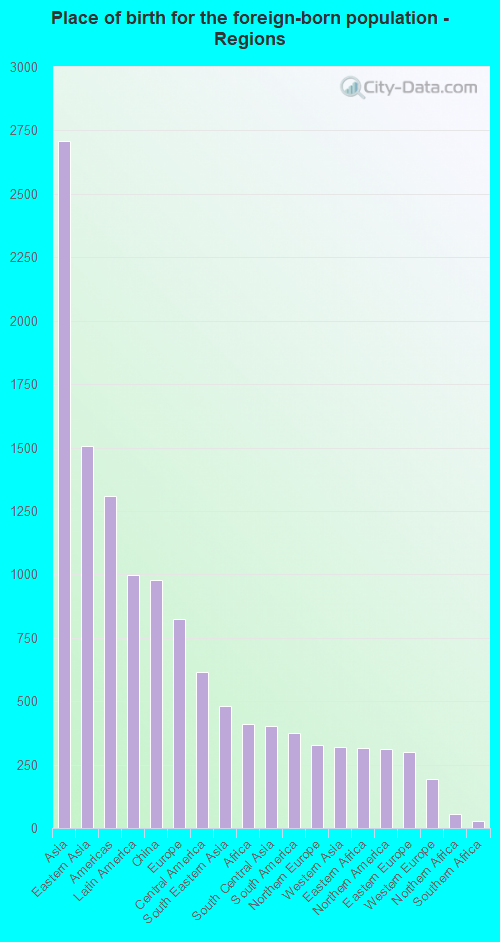
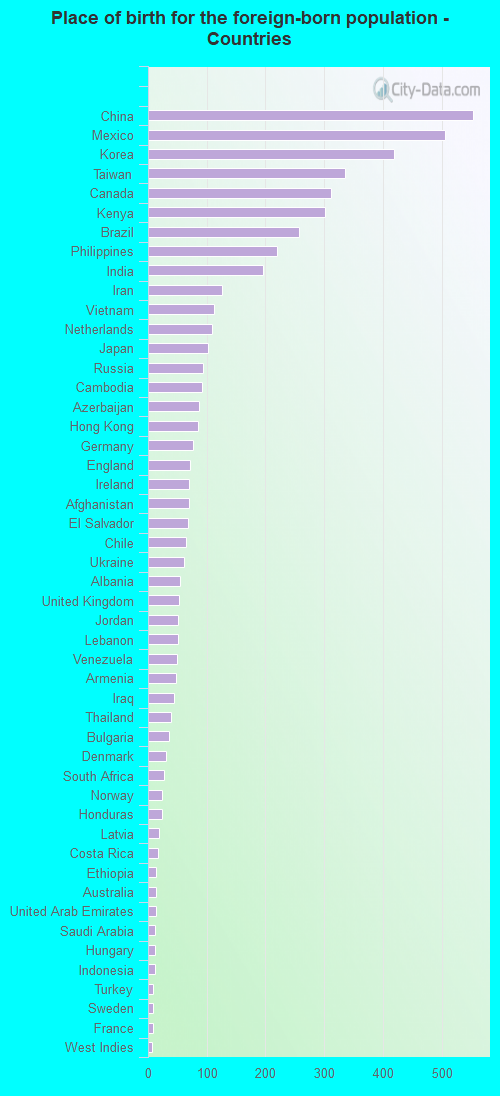
According to 2022 data, the most numerous races in Kenmore, WA are White alone (15,371 residents), Hispanic (2,041 residents), and Asian alone (3,654 residents). 72.1% of Kenmore residents speak English at home. 22.2% of Kenmore, WA residents are foreign-born (10.9% born in Asia, 4.0% born in Latin America, 3.3% born in Europe), which is 32.4% greater than the foreign-born rate of 15.0% across the entire state of Washington.
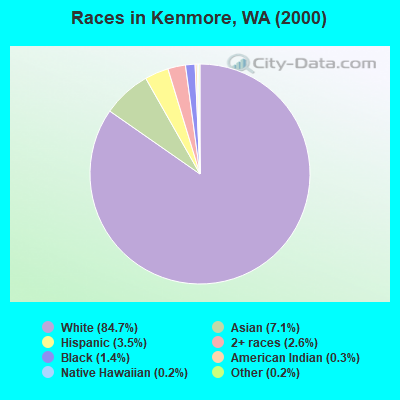
Race distribution in Kenmore
2000 2022
4,652,490 78.9% White alone 441,509 7.5% Hispanic 319,401 5.4% Asian alone 184,631 3.1% Black alone 175,926 3.0% Two or more races 85,396 1.4% American Indian alone 22,779 0.4% Native Hawaiian and Other 11,989 0.2% Other race alone
4,941,456 63.5% White alone 1,093,313 14.0% Hispanic 755,832 9.7% Asian alone 523,448 6.7% Two or more races 299,537 3.8% Black alone 69,024 0.9% American Indian alone 52,231 0.7% Native Hawaiian and Other 50,945 0.7% Other race alone
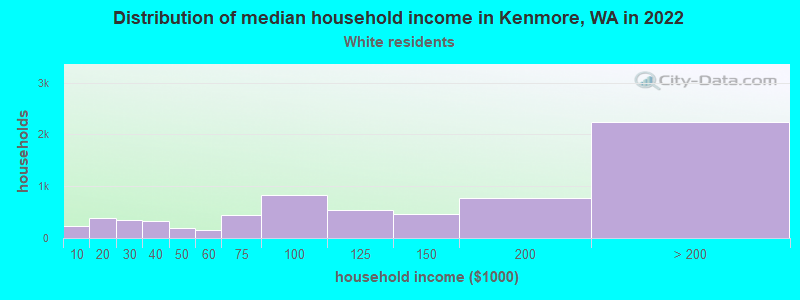
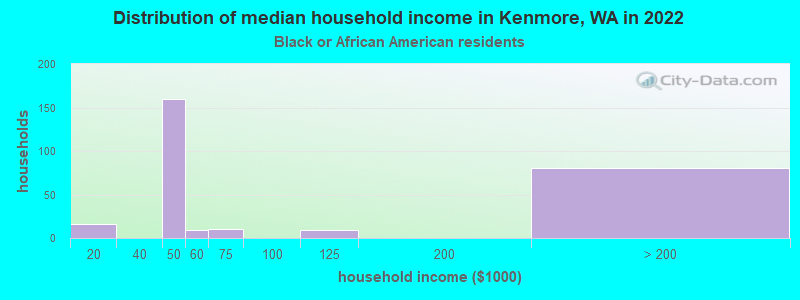
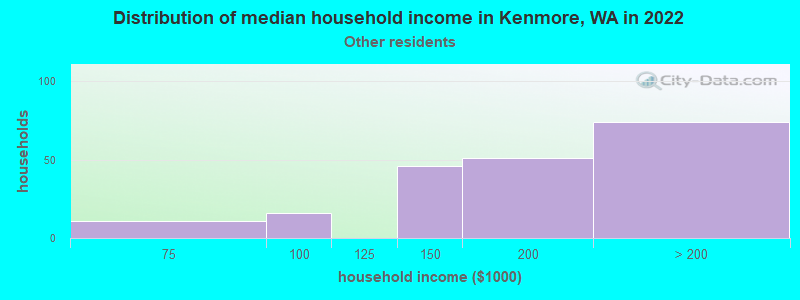
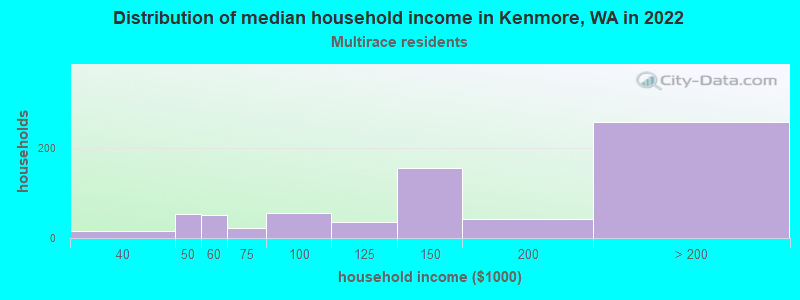
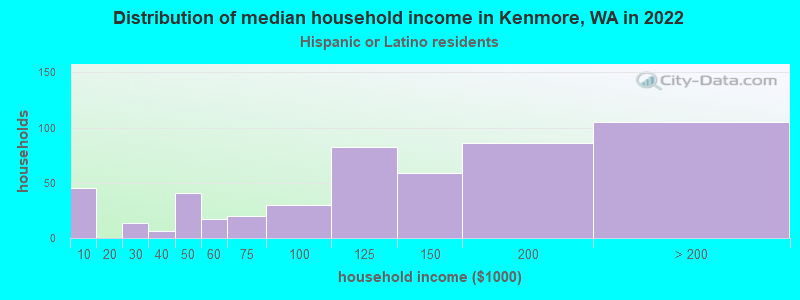
Income and house value in Kenmore Median household income in 2022 $128,509 White non-Hispanic householders$183,821 Asian householders$170,997 Some other race householders$147,825 Two or more races householders$108,311 Hispanic or Latino race householdersMedian 2022 house value $940,368 White Non-Hispanic householdersover $1,000,000 Black or African American householders$753,663 American Indian or Alaska Native householders $914,511 Asian householders$738,073 Native Hawaiian and other Pacific Islander householders$546,805 Some other race householdersover $1,000,000 Two or more races householders$789,407 Hispanic or Latino householders
Median age by race in Kenmore
42.2 Median age for White residents40.7 44.0 34.1 Median age for Black or African American residents31.5 36.2 29.5 Median age for American Indian / Alaska Native residents51.2 -631,249,999.4 43.0 Median age for Asian residents42.3 44.1 -653,927,812.5 Median age for Native Hawaiian / Pacific Islander residents-664,509,168.7 -651,945,320.1 40.2 Median age for Other race residents38.3 46.3 25.4 Median age for Two or more races residents24.7 28.4 42.4 Median age for White alone residents40.8 44.2 31.3 Median age for Hispanic or Latino residents32.4 30.7
Owner/renter occupied households by race in Kenmore
House owners and renters - White residents 4,811 69.7% Owner occupied2,095 30.3% Renter occupiedHouse owners and renters - Black or African American residents 74 29.8% Owner occupied175 70.2% Renter occupiedHouse owners and renters - Asian residents 1,083 80.9% Owner occupied256 19.1% Renter occupiedHouse owners and renters - Other race residents 94 52.3% Owner occupied86 47.7% Renter occupiedHouse owners and renters - Two or more races residents 346 49.5% Owner occupied352 50.5% Renter occupiedHouse owners and renters - White alone residents 4,736 69.9% Owner occupied2,040 30.1% Renter occupiedHouse owners and renters - Hispanic or Latino residents 229 45.8% Owner occupied271 54.2% Renter occupied
Language usage in Kenmore
English speakers - Total 72.1% of residents of Kenmore speak English at home.
5.0% of residents speak Spanish at home 582 52.5% Speak English very well527 47.5% Speak English less than very well22.6% of residents speak other language at home 3,387 67.3% Speak English very well1,646 32.7% Speak English less than very well
English speakers - Born in the United States 89.3% of residents of Kenmore speak English at home.
3.3% of residents speak Spanish at home 130 49.6% Speak English very well132 50.4% Speak English less than very well7.8% of residents speak other language at home 548 89.7% Speak English very well63 10.3% Speak English less than very well
English speakers - Native, born elsewhere 72.1% of residents of Kenmore speak English at home.
11.8% of residents speak Spanish at home 8 18.6% Speak English very well35 81.4% Speak English less than very well15.9% of residents speak other language at home 58 100.0% Speak English very well
English speakers - Foreign-born 18.4% of residents of Kenmore speak English at home.
13.8% of residents speak Spanish at home 345 47.7% Speak English very well378 52.3% Speak English less than very well67.8% of residents speak other language at home 2,119 59.5% Speak English very well1,442 40.5% Speak English less than very well
White (Caucasian) - Speak only English Native:
93.5% (12,383)Foreign-born:
26.6% (402)
White (Caucasian) - Speak another language Native:
6.4% (849)Foreign-born:
73.5% (1,111)
Black or African American - Speak only English Native:
88.9% (192)Foreign-born:
2.2% (7)
Black or African American - Speak another language Native:
11.1% (24)Foreign-born:
95.5% (311)
American Indian / Alaska Native - Speak only English Native:
95.1% (47)Foreign-born:
70.2% (7)
Asian - Speak only English Native:
58.4% (634)Foreign-born:
20.0% (494)
Asian - Speak another language Native:
41.2% (447)Foreign-born:
80.1% (1,979)
Other race - Speak another language Native:
41.3% (113)Foreign-born:
100.0% (455)
Two or more races - Speak only English Native:
82.1% (1,526)Foreign-born:
9.3% (37)
Two or more races - Speak another language Native:
18.2% (338)Foreign-born:
90.8% (361)
White alone - Speak only English Native:
94.3% (12,247)Foreign-born:
27.5% (409)
White alone - Speak another language Native:
6.0% (774)Foreign-born:
73.4% (1,094)
Hispanic or Latino - Speak another language Native:
30.6% (361)Foreign-born:
100.0% (703)
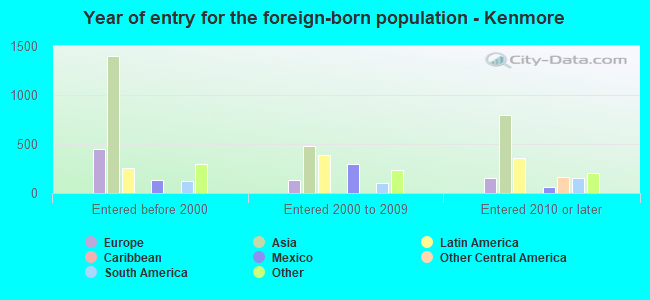
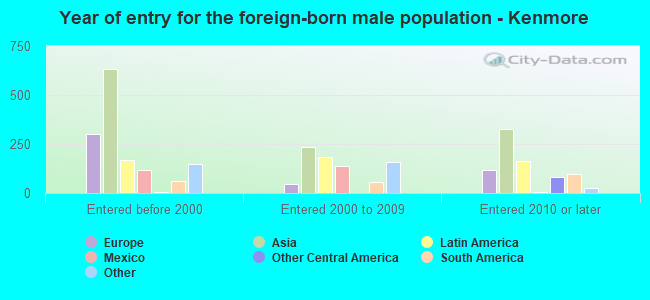
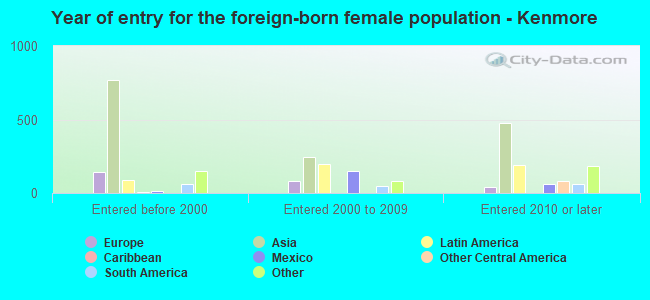
Foreign-born residents in Kenmore 5,269 residents are foreign born (10.9% Asia , 4.0% Latin America , 3.3% Europe ).
This city:
22.2%Washington:
14.9%
Marital status for residents in Kenmore Marital status - White (Caucasian) population 15 years and over
Males 34.1% Never married55.6% Now married0.2% Separated1.4% Widowed8.7% DivorcedFemales 20.4% Never married57.5% Now married1.7% Separated6.1% Widowed14.3% DivorcedWomen who gave birth in the past 12 months Now married:
69.1% (184)Unmarried:
30.9% (82)
Women who did not give birth in the past 12 months Now married:
60.5% (1,731)Unmarried:
39.5% (1,130)
Marital status - Black or African American population 15 years and over
Males 83.4% Never married14.9% Now married0.8% Separated0.0% Widowed0.8% DivorcedFemales 60.5% Never married22.2% Now married5.3% Separated0.0% Widowed12.0% DivorcedWomen who did not give birth in the past 12 months Now married:
15.6% (29)Unmarried:
84.4% (155)
Marital status - American Indian / Alaska Native population 15 years and over
Males 36.0% Never married64.0% Now married0.0% Separated0.0% Widowed0.0% DivorcedFemales 0.0% Never married100.0% Now married0.0% Separated0.0% Widowed0.0% DivorcedWomen who did not give birth in the past 12 months Now married:
100.0% (28)Unmarried:
0.0% (0)
Marital status - Asian population 15 years and over
Males 29.5% Never married69.6% Now married0.0% Separated0.0% Widowed1.0% DivorcedFemales 21.1% Never married63.9% Now married0.0% Separated5.5% Widowed9.6% DivorcedWomen who gave birth in the past 12 months Now married:
100.0% (66)Unmarried:
0.0% (0)
Women who did not give birth in the past 12 months Now married:
60.6% (657)Unmarried:
39.4% (427)
Marital status - Other race population 15 years and over
Males 35.7% Never married60.3% Now married0.0% Separated0.0% Widowed4.0% DivorcedFemales 23.0% Never married76.1% Now married1.0% Separated0.0% Widowed0.0% DivorcedWomen who did not give birth in the past 12 months Now married:
71.7% (106)Unmarried:
28.3% (42)
Marital status - Two or more races population 15 years and over
Males 56.5% Never married34.7% Now married0.0% Separated1.2% Widowed7.7% DivorcedFemales 48.1% Never married40.9% Now married0.0% Separated0.0% Widowed11.0% DivorcedWomen who gave birth in the past 12 months Now married:
38.6% (31)Unmarried:
61.4% (49)
Women who did not give birth in the past 12 months Now married:
36.0% (186)Unmarried:
64.0% (330)
Marital status - White alone, not Hispanic / Latino population 15 years and over
Males 33.9% Never married55.7% Now married0.2% Separated1.4% Widowed8.8% DivorcedFemales 20.1% Never married57.5% Now married1.8% Separated6.4% Widowed14.2% DivorcedWomen who gave birth in the past 12 months Now married:
69.1% (189)Unmarried:
30.9% (85)
Women who did not give birth in the past 12 months Now married:
60.8% (1,667)Unmarried:
39.2% (1,077)
Marital status - Hispanic or Latino population 15 years and over
Males 40.2% Never married52.5% Now married0.0% Separated0.0% Widowed7.2% DivorcedFemales 35.7% Never married49.8% Now married0.3% Separated0.0% Widowed14.2% DivorcedWomen who gave birth in the past 12 months Now married:
0.0% (0)Unmarried:
100.0% (45)
Women who did not give birth in the past 12 months Now married:
53.9% (289)Unmarried:
46.1% (248)
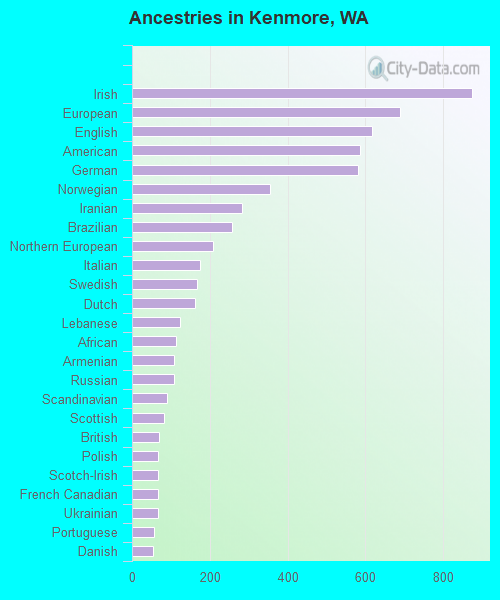
Ancestries in Kenmore
874 7.6% Irish690 6.0% European616 5.4% English586 5.1% American582 5.1% German356 3.1% Norwegian282 2.5% Iranian256 2.2% Brazilian208 1.8% Northern European175 1.5% Italian168 1.5% Swedish161 1.4% Dutch123 1.1% Lebanese114 1.0% African109 0.9% Armenian107 0.9% Russian90 0.8% Scandinavian82 0.7% Scottish70 0.6% British68 0.6% Polish67 0.6% Scotch-Irish66 0.6% French Canadian66 0.6% Ukrainian56 0.5% Portuguese54 0.5% Danish46 0.4% Canadian43 0.4% Albanian43 0.4% Ethiopian41 0.4% Icelander35 0.3% Bulgarian28 0.2% French27 0.2% Finnish21 0.2% Afghan19 0.2% Swiss18 0.2% Welsh11 0.10% Turkish10 0.09% Belgian9 0.08% Czech7 0.06% Hungarian7 0.06% Eastern European3 0.03% Lithuanian3 0.03% West Indian
Geographical mobility in Kenmore Same house 1 year ago 13,824 89.3% White (Caucasian)537 97.5% Black or African American59 96.7% American Indian / Alaska Native3,143 86.3% Asian1 100.0% Native Hawaiian / Pacific Islander680 92.6% Other race2,012 80.6% Two or more races13,613 89.6% White alone, not Hispanic / Latino1,565 79.7% Hispanic or LatinoMoved within same county 915 5.9% White / Caucasian18 3.2% Black or African American299 8.2% Asian14 1.9% Other race247 9.9% Two or more races847 5.6% White alone, not Hispanic / Latino201 10.2% Hispanic or LatinoMoved within same state 502 3.2% White / Caucasian2 0.0% Asian60 2.4% Two or more races517 3.4% White alone, not Hispanic / LatinoMoved from different state 281 1.8% White / Caucasian113 3.1% Asian48 6.6% Other race120 4.8% Two or more races271 1.8% White alone, not Hispanic / Latino177 9.0% Hispanic or LatinoMoved from abroad 58 0.4% White79 2.2% Asian46 1.9% Two or more races42 0.3% White alone, not Hispanic / Latino19 1.0% Hispanic or Latino
Children Nativity (place of birth) in Kenmore
Children under 6 years - Living with two parents Both parents native 1,016 100.0% NativeBoth parents foreign-born 214 91.2% Native21 8.8% Foreign-bornOne native, one foreign-born parent 127 100.0% NativeChildren under 6 years - Living with one parent Native parent 188 86.8% Native29 13.2% Foreign-bornForeign-born parent 112 100.0% NativeChildren 6 to 17 years - Living with two parents Both parents native 1,581 98.8% Native18 1.2% Foreign-bornBoth parents foreign-born 510 87.8% Native71 12.2% Foreign-bornOne native, one foreign-born parent 406 100.0% NativeChildren 6 to 17 years - Living with one parent Native parent 336 100.0% NativeForeign-born parent 150 50.9% Native144 49.1% Foreign-born