Races in Kennett Square, Pennsylvania (PA) Detailed Stats
Data:
Races - White alone (%)
Races - White alone (% change since 2000)
Races - Black alone (%)
Races - Black alone (% change since 2000)
Races - American Indian alone (%)
Races - American Indian alone (% change since 2000)
Races - Asian alone (%)
Races - Asian alone (% change since 2000)
Races - Hispanic (%)
Races - Hispanic (% change since 2000)
Races - Native Hawaiian and Other Pacific Islander alone (%)
Races - Native Hawaiian and Other Pacific Islander alone (% change since 2000)
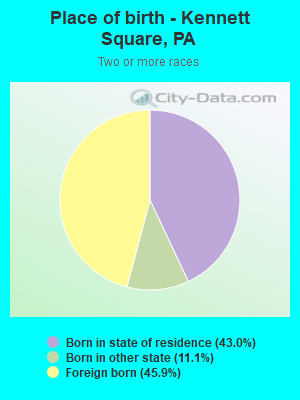
Races - Two or more races(%)
Races - Two or more races(% change since 2000)
Races - Other race alone (%)
Races - Other race alone (% change since 2000)
Racial diversity
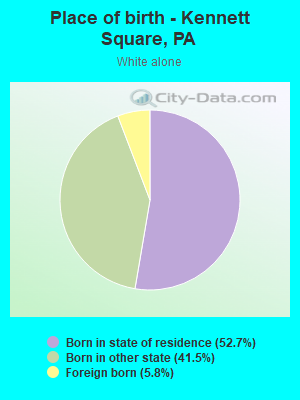
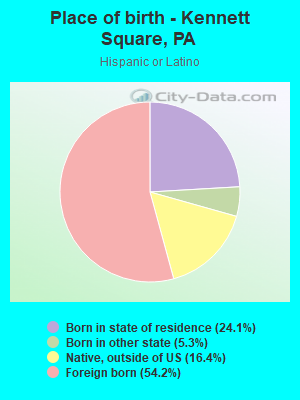
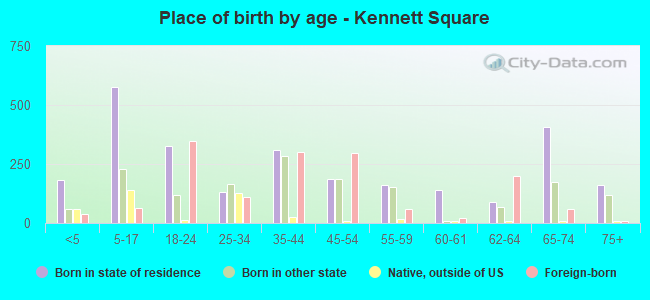
Place of birth - Born in state of residence (%)
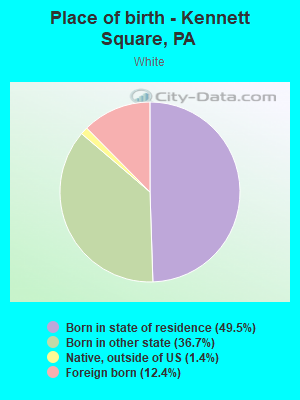
Place of birth - Born in state of residence (%) - White
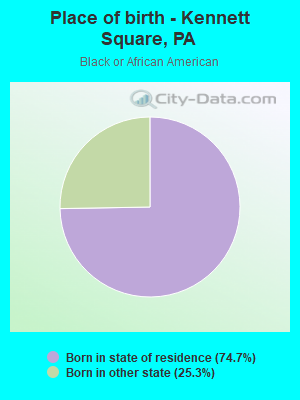
Place of birth - Born in state of residence (%) - Black or African American
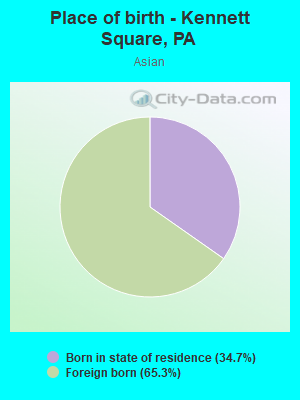
Place of birth - Born in state of residence (%) - Asian
Place of birth - Born in state of residence (%) - Hispanic or Latino
Place of birth - Born in state of residence (%) - American Indian and Alaska Native
Place of birth - Born in state of residence (%) - Multirace
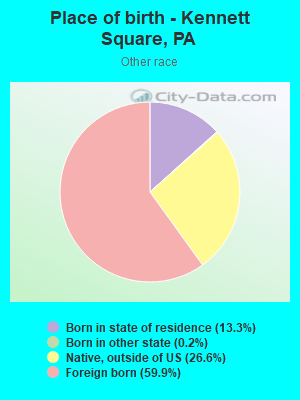
Place of birth - Born in state of residence (%) - Other Race
Place of birth - Born in other state (%)
Place of birth - Born in other state (%) - White
Place of birth - Born in other state (%) - Black or African American
Place of birth - Born in other state (%) - Asian
Place of birth - Born in other state (%) - Hispanic or Latino
Place of birth - Born in other state (%) - American Indian and Alaska Native
Place of birth - Born in other state (%) - Multirace
Place of birth - Born in other state (%) - Other Race
Place of birth - Native, outside of US (%)
Place of birth - Native, outside of US (%) - White
Place of birth - Native, outside of US (%) - Black or African American
Place of birth - Native, outside of US (%) - Asian
Place of birth - Native, outside of US (%) - Hispanic or Latino
Place of birth - Native, outside of US (%) - American Indian and Alaska Native
Place of birth - Native, outside of US (%) - Multirace
Place of birth - Native, outside of US (%) - Other Race
Place of birth - Foreign born (%)
Place of birth - Foreign born (%) - White
Place of birth - Foreign born (%) - Black or African American
Place of birth - Foreign born (%) - Asian
Place of birth - Foreign born (%) - Hispanic or Latino
Place of birth - Foreign born (%) - American Indian and Alaska Native
Place of birth - Foreign born (%) - Multirace
Place of birth - Foreign born (%) - Other Race
Residents speaking English at home (%)
Residents speaking English at home - Born in the United States (%)
Residents speaking English at home - Native, born elsewhere (%)
Residents speaking English at home - Foreign born (%)
Residents speaking Spanish at home (%)
Residents speaking Spanish at home - Born in the United States (%)
Residents speaking Spanish at home - Native, born elsewhere (%)
Residents speaking Spanish at home - Foreign born (%)
Residents speaking other language at home (%)
Residents speaking other language at home - Born in the United States (%)
Residents speaking other language at home - Native, born elsewhere (%)
Residents speaking other language at home - Foreign born (%)
Marital status - Never married (%)
Marital status - Now married (%)
Marital status - Separated (%)
Marital status - Widowed (%)
Marital status - Divorced (%)
Ancestries Reported - Arab (%)
Ancestries Reported - Czech (%)
Ancestries Reported - Danish (%)
Ancestries Reported - Dutch (%)
Ancestries Reported - English (%)
Ancestries Reported - French (%)
Ancestries Reported - French Canadian (%)
Ancestries Reported - German (%)
Ancestries Reported - Greek (%)
Ancestries Reported - Hungarian (%)
Ancestries Reported - Irish (%)
Ancestries Reported - Italian (%)
Ancestries Reported - Lithuanian (%)
Ancestries Reported - Norwegian (%)
Ancestries Reported - Polish (%)
Ancestries Reported - Portuguese (%)
Ancestries Reported - Russian (%)
Ancestries Reported - Scotch-Irish (%)
Ancestries Reported - Scottish (%)
Ancestries Reported - Slovak (%)
Ancestries Reported - Subsaharan African (%)
Ancestries Reported - Swedish (%)
Ancestries Reported - Swiss (%)
Ancestries Reported - Ukrainian (%)
Ancestries Reported - United States (%)
Ancestries Reported - Welsh (%)
Ancestries Reported - West Indian (%)
Ancestries Reported - Other (%)
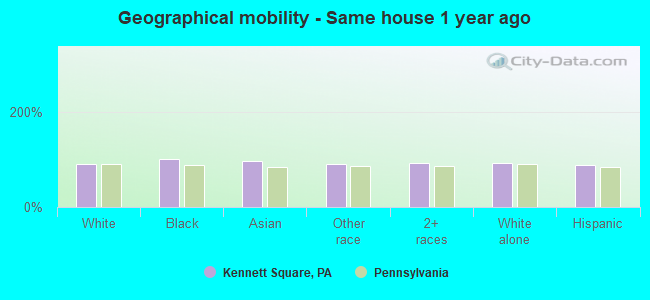
Geographical mobility - Same house 1 year ago (%)
Geographical mobility - Same house 1 year ago (%) - White
Geographical mobility - Same house 1 year ago (%) - Black or African American
Geographical mobility - Same house 1 year ago (%) - Asian
Geographical mobility - Same house 1 year ago (%) - Hispanic or Latino
Geographical mobility - Same house 1 year ago (%) - American Indian and Alaska Native
Geographical mobility - Same house 1 year ago (%) - Multirace
Geographical mobility - Same house 1 year ago (%) - Other Race
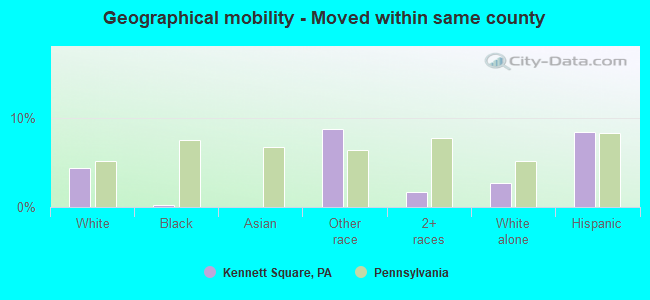
Geographical mobility - Moved within same county (%)
Geographical mobility - Moved within same county (%) - White
Geographical mobility - Moved within same county (%) - Black or African American
Geographical mobility - Moved within same county (%) - Asian
Geographical mobility - Moved within same county (%) - Hispanic or Latino
Geographical mobility - Moved within same county (%) - American Indian and Alaska Native
Geographical mobility - Moved within same county (%) - Multirace
Geographical mobility - Moved within same county (%) - Other Race
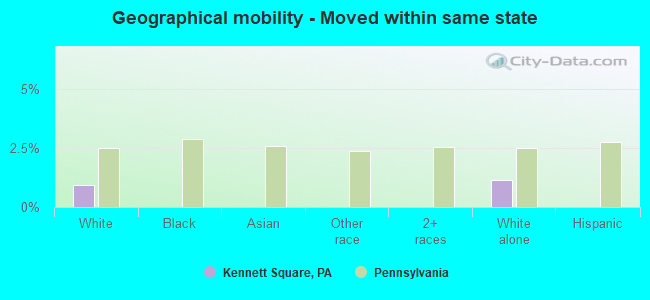
Geographical mobility - Moved from different county within same state (%)
Geographical mobility - Moved from different county within same state (%) - White
Geographical mobility - Moved from different county within same state (%) - Black or African American
Geographical mobility - Moved from different county within same state (%) - Asian
Geographical mobility - Moved from different county within same state (%) - Hispanic or Latino
Geographical mobility - Moved from different county within same state (%) - American Indian and Alaska Native
Geographical mobility - Moved from different county within same state (%) - Multirace
Geographical mobility - Moved from different county within same state (%) - Other Race
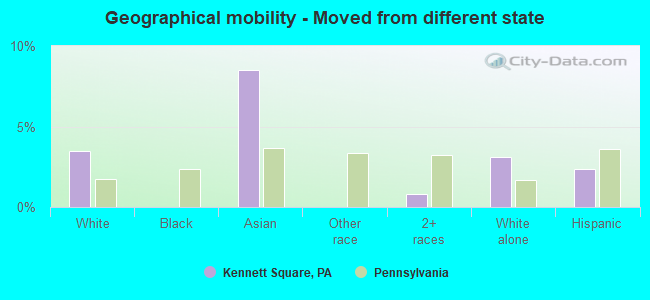
Geographical mobility - Moved from different state (%)
Geographical mobility - Moved from different state (%) - White
Geographical mobility - Moved from different state (%) - Black or African American
Geographical mobility - Moved from different state (%) - Asian
Geographical mobility - Moved from different state (%) - Hispanic or Latino
Geographical mobility - Moved from different state (%) - American Indian and Alaska Native
Geographical mobility - Moved from different state (%) - Multirace
Geographical mobility - Moved from different state (%) - Other Race
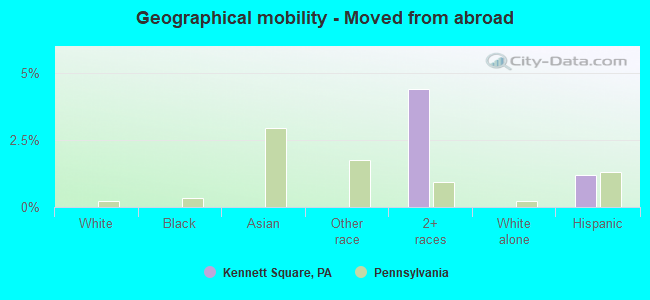
Geographical mobility - Moved from abroad (%)
Geographical mobility - Moved from abroad (%) - White
Geographical mobility - Moved from abroad (%) - Black or African American
Geographical mobility - Moved from abroad (%) - Asian
Geographical mobility - Moved from abroad (%) - Hispanic or Latino
Geographical mobility - Moved from abroad (%) - American Indian and Alaska Native
Geographical mobility - Moved from abroad (%) - Multirace
Geographical mobility - Moved from abroad (%) - Other Race
Place of birth for the foreign-born population - Ireland (%)
Place of birth for the foreign-born population - Denmark (%)
Place of birth for the foreign-born population - Norway (%)
Place of birth for the foreign-born population - Sweden (%)
Place of birth for the foreign-born population - United Kingdom (%)
Place of birth for the foreign-born population - England (%)
Place of birth for the foreign-born population - Scotland (%)
Place of birth for the foreign-born population - Other Northern Europe (%)
Place of birth for the foreign-born population - Austria (%)
Place of birth for the foreign-born population - Belgium (%)
Place of birth for the foreign-born population - France (%)
Place of birth for the foreign-born population - Germany (%)
Place of birth for the foreign-born population - Netherlands (%)
Place of birth for the foreign-born population - Switzerland (%)
Place of birth for the foreign-born population - Other Western Europe (%)
Place of birth for the foreign-born population - Greece (%)
Place of birth for the foreign-born population - Italy (%)
Place of birth for the foreign-born population - Portugal (%)
Place of birth for the foreign-born population - Spain (%)
Place of birth for the foreign-born population - Other Southern Europe (%)
Place of birth for the foreign-born population - Albania (%)
Place of birth for the foreign-born population - Belarus (%)
Place of birth for the foreign-born population - Bosnia and Herzegovina (%)
Place of birth for the foreign-born population - Bulgaria (%)
Place of birth for the foreign-born population - Croatia (%)
Place of birth for the foreign-born population - Czechoslovakia (%)
Place of birth for the foreign-born population - Hungary (%)
Place of birth for the foreign-born population - Latvia (%)
Place of birth for the foreign-born population - Lithuania (%)
Place of birth for the foreign-born population - North Macedonia (Macedonia) (%)
Place of birth for the foreign-born population - Moldova (%)
Place of birth for the foreign-born population - Poland (%)
Place of birth for the foreign-born population - Romania (%)
Place of birth for the foreign-born population - Russia (%)
Place of birth for the foreign-born population - Serbia (%)
Place of birth for the foreign-born population - Ukraine (%)
Place of birth for the foreign-born population - Other Eastern Europe (%)
Place of birth for the foreign-born population - China (%)
Place of birth for the foreign-born population - Hong Kong (%)
Place of birth for the foreign-born population - Taiwan (%)
Place of birth for the foreign-born population - Japan (%)
Place of birth for the foreign-born population - Korea (%)
Place of birth for the foreign-born population - Other Eastern Asia (%)
Place of birth for the foreign-born population - Afghanistan (%)
Place of birth for the foreign-born population - Bangladesh (%)
Place of birth for the foreign-born population - India (%)
Place of birth for the foreign-born population - Iran (%)
Place of birth for the foreign-born population - Kazakhstan (%)
Place of birth for the foreign-born population - Nepal (%)
Place of birth for the foreign-born population - Pakistan (%)
Place of birth for the foreign-born population - Sri Lanka (%)
Place of birth for the foreign-born population - Uzbekistan (%)
Place of birth for the foreign-born population - Other South Central Asia (%)
Place of birth for the foreign-born population - Burma (%)
Place of birth for the foreign-born population - Cambodia (%)
Place of birth for the foreign-born population - Indonesia (%)
Place of birth for the foreign-born population - Laos (%)
Place of birth for the foreign-born population - Malaysia (%)
Place of birth for the foreign-born population - Philippines (%)
Place of birth for the foreign-born population - Singapore (%)
Place of birth for the foreign-born population - Thailand (%)
Place of birth for the foreign-born population - Vietnam (%)
Place of birth for the foreign-born population - Other South Eastern Asia (%)
Place of birth for the foreign-born population - Armenia (%)
Place of birth for the foreign-born population - Iraq (%)
Place of birth for the foreign-born population - Israel (%)
Place of birth for the foreign-born population - Jordan (%)
Place of birth for the foreign-born population - Kuwait (%)
Place of birth for the foreign-born population - Lebanon (%)
Place of birth for the foreign-born population - Saudi Arabia (%)
Place of birth for the foreign-born population - Syria (%)
Place of birth for the foreign-born population - Turkey (%)
Place of birth for the foreign-born population - Yemen (%)
Place of birth for the foreign-born population - Other Western Asia (%)
Place of birth for the foreign-born population - Eritrea (%)
Place of birth for the foreign-born population - Ethiopia (%)
Place of birth for the foreign-born population - Kenya (%)
Place of birth for the foreign-born population - Somalia (%)
Place of birth for the foreign-born population - Uganda (%)
Place of birth for the foreign-born population - Zimbabwe (%)
Place of birth for the foreign-born population - Other Eastern Africa (%)
Place of birth for the foreign-born population - Cameroon (%)
Place of birth for the foreign-born population - Congo (%)
Place of birth for the foreign-born population - Democratic Republic of Congo (Zaire) (%)
Place of birth for the foreign-born population - Other Middle Africa (%)
Place of birth for the foreign-born population - Egypt (%)
Place of birth for the foreign-born population - Morocco (%)
Place of birth for the foreign-born population - Sudan (%)
Place of birth for the foreign-born population - Other Northern Africa (%)
Place of birth for the foreign-born population - South Africa (%)
Place of birth for the foreign-born population - Other Southern Africa (%)
Place of birth for the foreign-born population - Cabo Verde (%)
Place of birth for the foreign-born population - Ghana (%)
Place of birth for the foreign-born population - Liberia (%)
Place of birth for the foreign-born population - Nigeria (%)
Place of birth for the foreign-born population - Senegal (%)
Place of birth for the foreign-born population - Sierra Leone (%)
Place of birth for the foreign-born population - Other Western Africa (%)
Place of birth for the foreign-born population - Australia (%)
Place of birth for the foreign-born population - New Zealand (%)
Place of birth for the foreign-born population - Fiji (%)
Place of birth for the foreign-born population - Micronesia (%)
Place of birth for the foreign-born population - Bahamas (%)
Place of birth for the foreign-born population - Barbados (%)
Place of birth for the foreign-born population - Cuba (%)
Place of birth for the foreign-born population - Dominica (%)
Place of birth for the foreign-born population - Dominican Republic (%)
Place of birth for the foreign-born population - Grenada (%)
Place of birth for the foreign-born population - Haiti (%)
Place of birth for the foreign-born population - Jamaica (%)
Place of birth for the foreign-born population - St. Vincent and the Grenadines (%)
Place of birth for the foreign-born population - Trinidad and Tobago (%)
Place of birth for the foreign-born population - West Indies (%)
Place of birth for the foreign-born population - Other Caribbean (%)
Place of birth for the foreign-born population - Belize (%)
Place of birth for the foreign-born population - Costa Rica (%)
Place of birth for the foreign-born population - El Salvador (%)
Place of birth for the foreign-born population - Guatemala (%)
Place of birth for the foreign-born population - Honduras (%)
Place of birth for the foreign-born population - Mexico (%)
Place of birth for the foreign-born population - Nicaragua (%)
Place of birth for the foreign-born population - Panama (%)
Place of birth for the foreign-born population - Other Central America (%)
Place of birth for the foreign-born population - Argentina (%)
Place of birth for the foreign-born population - Bolivia (%)
Place of birth for the foreign-born population - Brazil (%)
Place of birth for the foreign-born population - Chile (%)
Place of birth for the foreign-born population - Colombia (%)
Place of birth for the foreign-born population - Ecuador (%)
Place of birth for the foreign-born population - Guyana (%)
Place of birth for the foreign-born population - Peru (%)
Place of birth for the foreign-born population - Uruguay (%)
Place of birth for the foreign-born population - Venezuela (%)
Place of birth for the foreign-born population - Other South America (%)
Place of birth for the foreign-born population - Canada (%)
Place of birth for the foreign-born population - Other Northern America (%)
Place of birth for the foreign-born population - Other (%)
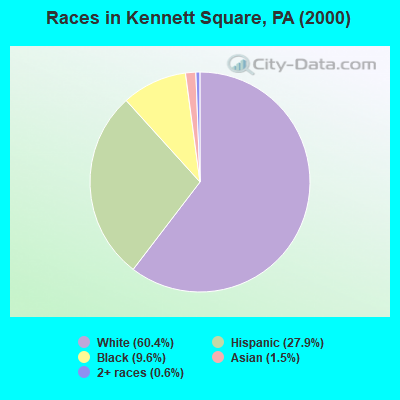
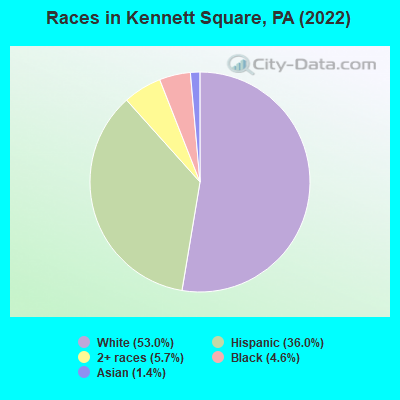
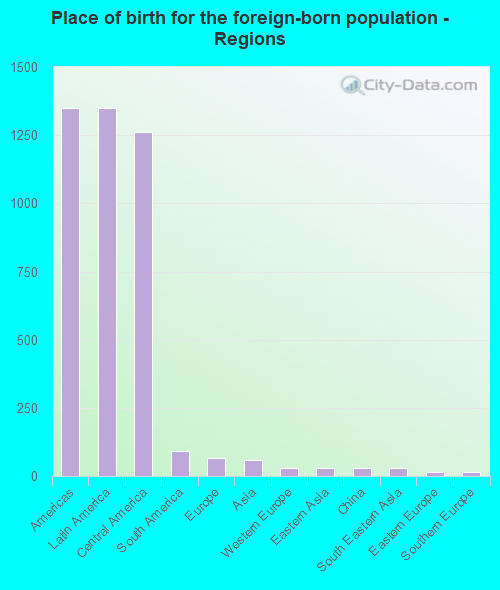
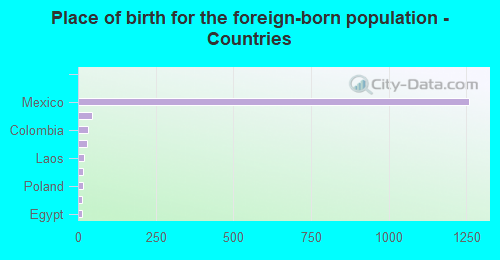
According to 2022 data, the most numerous races in Kennett Square, PA are White alone (3,226 residents), Black alone (278 residents), and Hispanic (2,191 residents). 65.3% of Kennett Square residents speak English at home. 24.4% of Kennett Square, PA residents are foreign-born (21.7% born in Latin America), which is 71.4% greater than the foreign-born rate of 7.0% across the entire state of Pennsylvania.
Race distribution in Kennett Square
2000 2022
10,322,455 84.1% White alone 1,202,437 9.8% Black alone 394,088 3.2% Hispanic 218,296 1.8% Asian alone 113,097 0.9% Two or more races 13,086 0.1% Other race alone 14,904 0.1% American Indian alone 2,691 0.02% Native Hawaiian and Other
9,487,228 73.1% White alone 1,311,581 10.1% Black alone 1,115,997 8.6% Hispanic 493,942 3.8% Two or more races 487,124 3.8% Asian alone 63,582 0.5% Other race alone 10,130 0.08% American Indian alone 2,424 0.02% Native Hawaiian and Other
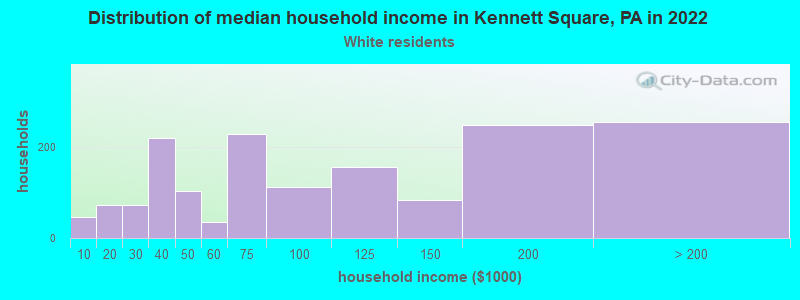
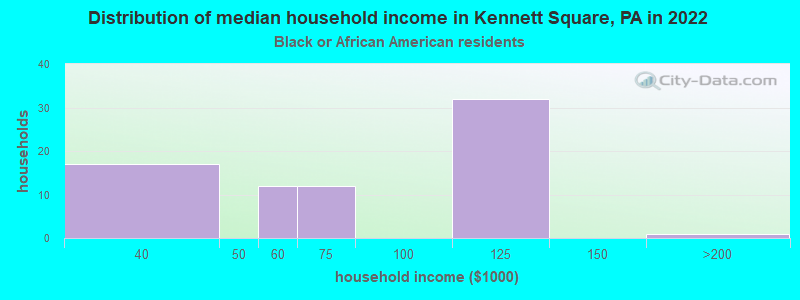
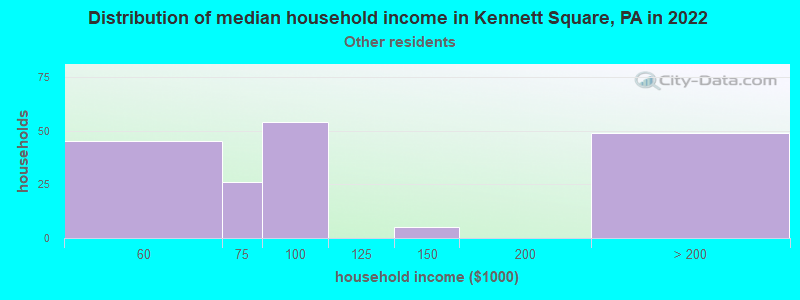
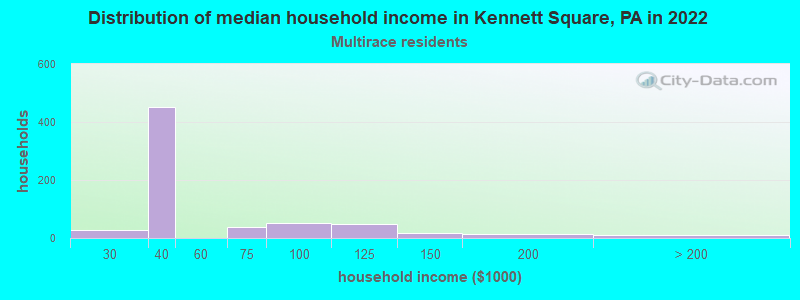
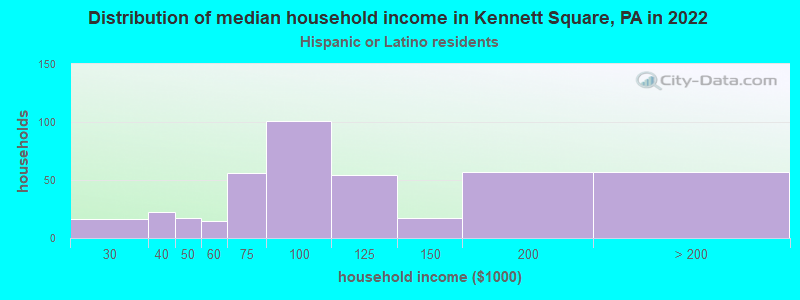
Income and house value in Kennett Square Median household income in 2022 $70,599 White non-Hispanic householders$62,415 Black householders$78,000 Some other race householders$89,924 Hispanic or Latino race householdersMedian 2022 house value $347,988 White Non-Hispanic householders$343,194 Black or African American householders $133,950 Asian householders$323,736 Some other race householders$331,350 Hispanic or Latino householders
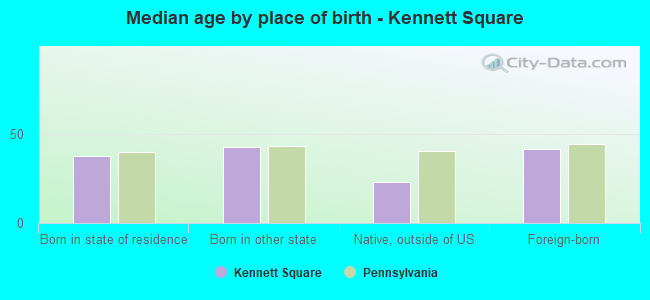
Median age by race in Kennett Square
41.8 Median age for White residents37.5 43.1 49.0 Median age for Black or African American residents47.9 49.9 -591,549,295.2 Median age for American Indian / Alaska Native residents-596,491,227.5 -593,055,555.0 39.1 Median age for Asian residents39.5 24.8 -596,045,197.1 Median age for Native Hawaiian / Pacific Islander residents-665,394,401.4 -747,474,746.7 23.5 Median age for Other race residents23.4 19.9 42.0 Median age for Two or more races residents51.2 25.7 42.7 Median age for White alone residents41.4 42.8 25.3 Median age for Hispanic or Latino residents24.8 26.4
Owner/renter occupied households by race in Kennett Square
House owners and renters - White residents 1,088 66.9% Owner occupied538 33.1% Renter occupiedHouse owners and renters - Black or African American residents 47 65.9% Owner occupied24 34.1% Renter occupiedHouse owners and renters - Asian residents 10 100.0% Owner occupiedHouse owners and renters - Other race residents 99 66.3% Owner occupied50 33.7% Renter occupiedHouse owners and renters - Two or more races residents 114 20.3% Owner occupied448 79.7% Renter occupiedHouse owners and renters - White alone residents 931 64.8% Owner occupied506 35.2% Renter occupiedHouse owners and renters - Hispanic or Latino residents 334 67.9% Owner occupied158 32.1% Renter occupied
Language usage in Kennett Square
English speakers - Total 65.3% of residents of Kennett Square speak English at home.
30.5% of residents speak Spanish at home 845 48.1% Speak English very well910 51.9% Speak English less than very well2.8% of residents speak other language at home 71 43.8% Speak English very well91 56.2% Speak English less than very well
English speakers - Born in the United States 92.8% of residents of Kennett Square speak English at home.
4.2% of residents speak Spanish at home 62 96.9% Speak English very well2 3.1% Speak English less than very well2.9% of residents speak other language at home 7 15.9% Speak English very well37 84.1% Speak English less than very well
English speakers - Native, born elsewhere 28.2% of residents of Kennett Square speak English at home.
39.3% of residents speak Spanish at home 105 87.5% Speak English very well15 12.5% Speak English less than very well
English speakers - Foreign-born 6.6% of residents of Kennett Square speak English at home.
79.3% of residents speak Spanish at home 346 30.0% Speak English very well809 70.0% Speak English less than very well6.2% of residents speak other language at home 44 48.9% Speak English very well46 51.1% Speak English less than very well
White (Caucasian) - Speak only English Native:
95.6% (2,917)Foreign-born:
3.3% (15)
White (Caucasian) - Speak another language Native:
4.4% (134)Foreign-born:
90.0% (417)
Asian - Speak only English Native:
44.8% (14)Foreign-born:
65.8% (37)
Asian - Speak another language Native:
56.3% (17)Foreign-born:
46.9% (26)
Other race - Speak only English Native:
13.8% (46)Foreign-born:
10.7% (55)
Other race - Speak another language Native:
81.1% (271)Foreign-born:
88.4% (449)
Two or more races - Speak only English Native:
64.1% (469)Foreign-born:
1.4% (9)
Two or more races - Speak another language Native:
38.6% (282)Foreign-born:
100.0% (664)
White alone - Speak only English Native:
97.5% (2,789)Foreign-born:
7.9% (15)
White alone - Speak another language Native:
2.1% (61)Foreign-born:
100.0% (188)
Hispanic or Latino - Speak only English Native:
35.9% (320)Foreign-born:
5.5% (62)
Hispanic or Latino - Speak another language Native:
59.8% (533)Foreign-born:
92.7% (1,040)
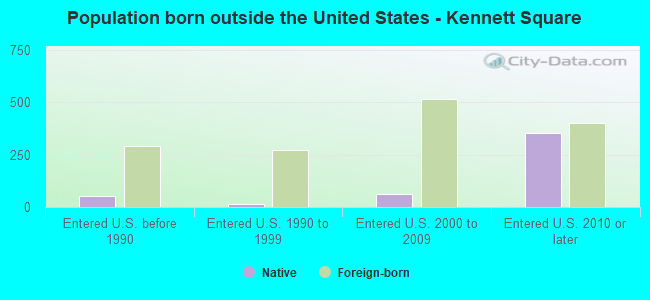
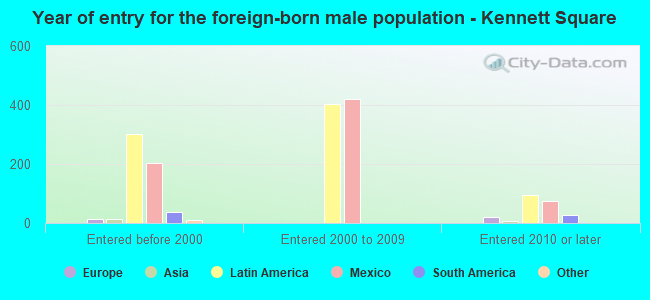
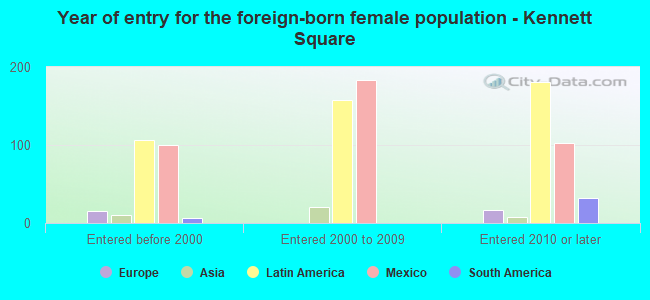
Foreign-born residents in Kennett Square 1,488 residents are foreign born (21.7% Latin America ).
This city:
24.4%Pennsylvania:
7.3%
Marital status for residents in Kennett Square Marital status - White (Caucasian) population 15 years and over
Males 35.8% Never married51.9% Now married3.0% Separated5.1% Widowed4.4% DivorcedFemales 28.8% Never married47.9% Now married2.4% Separated6.2% Widowed14.7% DivorcedWomen who gave birth in the past 12 months Now married:
100.0% (30)Unmarried:
0.0% (0)
Women who did not give birth in the past 12 months Now married:
43.8% (358)Unmarried:
56.2% (460)
Marital status - Black or African American population 15 years and over
Males 27.1% Never married57.4% Now married15.5% Separated0.0% Widowed0.0% DivorcedFemales 55.2% Never married44.8% Now married0.0% Separated0.0% Widowed0.0% DivorcedWomen who gave birth in the past 12 months Now married:
0.0% (0)Unmarried:
100.0% (2)
Women who did not give birth in the past 12 months Now married:
49.1% (24)Unmarried:
50.9% (25)
Marital status - Asian population 15 years and over
Males 71.9% Never married28.1% Now married0.0% Separated0.0% Widowed0.0% DivorcedFemales 55.0% Never married45.0% Now married0.0% Separated0.0% Widowed0.0% DivorcedWomen who did not give birth in the past 12 months Now married:
29.0% (10)Unmarried:
71.0% (24)
Marital status - Other race population 15 years and over
Males 63.6% Never married35.6% Now married0.0% Separated0.8% Widowed0.0% DivorcedFemales 38.3% Never married60.1% Now married1.6% Separated0.0% Widowed0.0% DivorcedWomen who did not give birth in the past 12 months Now married:
55.3% (144)Unmarried:
44.7% (116)
Marital status - Two or more races population 15 years and over
Males 25.9% Never married26.4% Now married0.0% Separated42.4% Widowed5.3% DivorcedFemales 55.3% Never married34.6% Now married0.0% Separated4.2% Widowed5.9% DivorcedWomen who gave birth in the past 12 months Now married:
100.0% (17)Unmarried:
0.0% (0)
Women who did not give birth in the past 12 months Now married:
34.8% (101)Unmarried:
65.2% (189)
Marital status - White alone, not Hispanic / Latino population 15 years and over
Males 24.9% Never married58.7% Now married3.9% Separated6.7% Widowed5.8% DivorcedFemales 31.5% Never married42.4% Now married2.7% Separated6.9% Widowed16.5% DivorcedWomen who gave birth in the past 12 months Now married:
100.0% (30)Unmarried:
0.0% (0)
Women who did not give birth in the past 12 months Now married:
40.2% (307)Unmarried:
59.8% (458)
Marital status - Hispanic or Latino population 15 years and over
Males 61.0% Never married36.1% Now married0.0% Separated0.3% Widowed2.5% DivorcedFemales 33.4% Never married64.6% Now married0.6% Separated0.0% Widowed1.3% DivorcedWomen who gave birth in the past 12 months Now married:
100.0% (12)Unmarried:
0.0% (0)
Women who did not give birth in the past 12 months Now married:
54.1% (240)Unmarried:
45.9% (204)
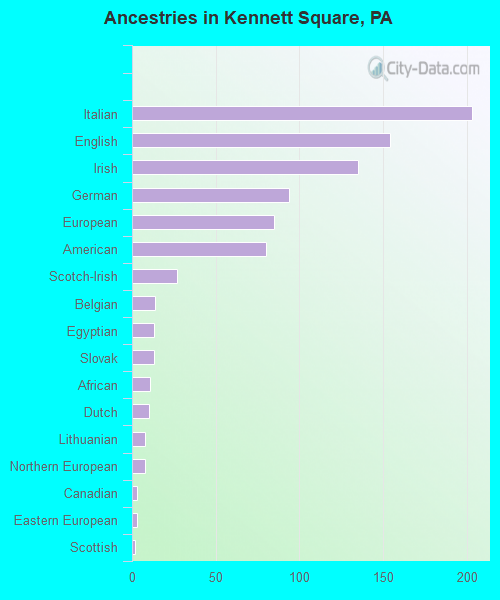
Ancestries in Kennett Square
203 6.8% Italian154 5.2% English135 4.5% Irish94 3.2% German85 2.9% European80 2.7% American27 0.9% Scotch-Irish14 0.5% Belgian13 0.4% Egyptian13 0.4% Slovak11 0.4% African10 0.3% Dutch8 0.3% Lithuanian8 0.3% Northern European3 0.1% Canadian3 0.1% Eastern European2 0.07% Scottish1 0.03% French
Children Nativity (place of birth) in Kennett Square
Children under 6 years - Living with two parents Both parents native 234 100.0% NativeBoth parents foreign-born 7 13.1% Native49 86.9% Foreign-bornOne native, one foreign-born parent 28 100.0% NativeChildren under 6 years - Living with one parent Native parent 15 100.0% NativeForeign-born parent 51 100.0% NativeChildren 6 to 17 years - Living with two parents Both parents native 213 98.7% Native3 1.3% Foreign-bornBoth parents foreign-born 221 82.6% Native47 17.4% Foreign-bornOne native, one foreign-born parent 179 100.0% NativeChildren 6 to 17 years - Living with one parent Native parent 155 100.0% NativeForeign-born parent 115 52.5% Native104 47.5% Foreign-born
Grandparents responsible for own grandchildren in Kennett Square
Grandparents (30 to 59 years) White / Caucasian 18 100.0% Not responsible for grandchildrenOther race 27 32.3% Responsible for grandchildren56 67.7% Not responsible for grandchildrenWhite alone, not Hispanic / Latino 21 100.0% Not responsible for grandchildrenHispanic or Latino 21 33.4% Responsible for grandchildren43 66.6% Not responsible for grandchildren
Grandparents (60 years and over)