Races in Kennewick, Washington (WA) Detailed Stats
Data:
Races - White alone (%)
Races - White alone (% change since 2000)
Races - Black alone (%)
Races - Black alone (% change since 2000)
Races - American Indian alone (%)
Races - American Indian alone (% change since 2000)
Races - Asian alone (%)
Races - Asian alone (% change since 2000)
Races - Hispanic (%)
Races - Hispanic (% change since 2000)
Races - Native Hawaiian and Other Pacific Islander alone (%)
Races - Native Hawaiian and Other Pacific Islander alone (% change since 2000)
Races - Two or more races(%)
Races - Two or more races(% change since 2000)
Races - Other race alone (%)
Races - Other race alone (% change since 2000)
Racial diversity
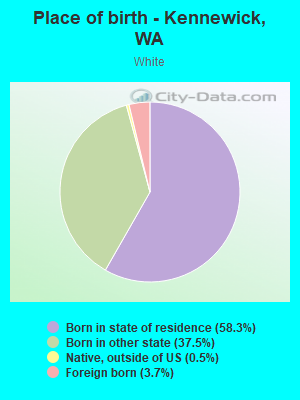
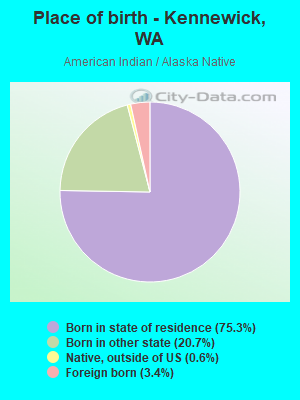
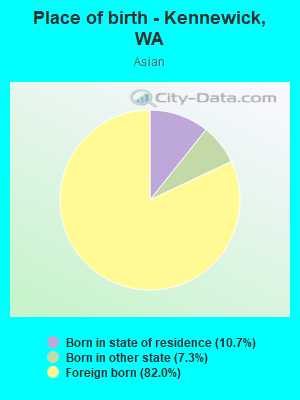
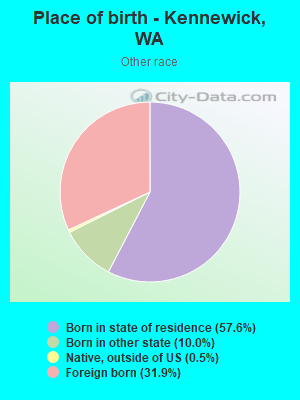
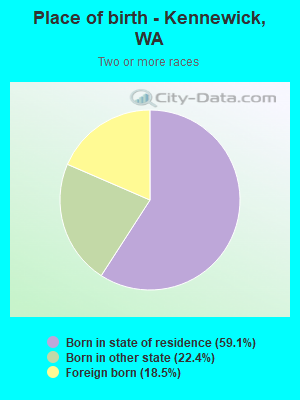
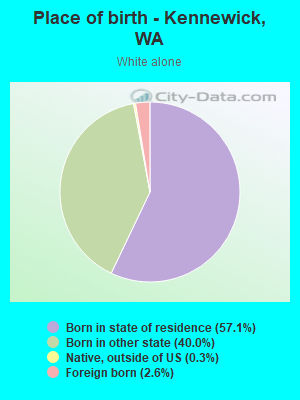
Place of birth - Born in state of residence (%)
Place of birth - Born in state of residence (%) - White
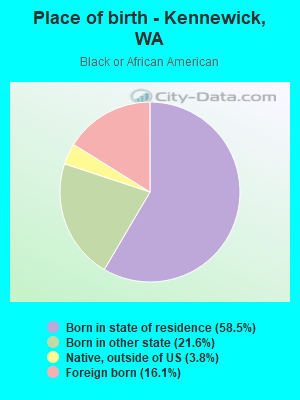
Place of birth - Born in state of residence (%) - Black or African American
Place of birth - Born in state of residence (%) - Asian
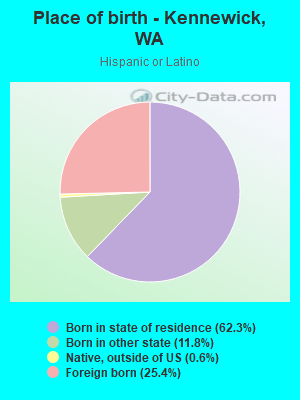
Place of birth - Born in state of residence (%) - Hispanic or Latino
Place of birth - Born in state of residence (%) - American Indian and Alaska Native
Place of birth - Born in state of residence (%) - Multirace
Place of birth - Born in state of residence (%) - Other Race
Place of birth - Born in other state (%)
Place of birth - Born in other state (%) - White
Place of birth - Born in other state (%) - Black or African American
Place of birth - Born in other state (%) - Asian
Place of birth - Born in other state (%) - Hispanic or Latino
Place of birth - Born in other state (%) - American Indian and Alaska Native
Place of birth - Born in other state (%) - Multirace
Place of birth - Born in other state (%) - Other Race
Place of birth - Native, outside of US (%)
Place of birth - Native, outside of US (%) - White
Place of birth - Native, outside of US (%) - Black or African American
Place of birth - Native, outside of US (%) - Asian
Place of birth - Native, outside of US (%) - Hispanic or Latino
Place of birth - Native, outside of US (%) - American Indian and Alaska Native
Place of birth - Native, outside of US (%) - Multirace
Place of birth - Native, outside of US (%) - Other Race
Place of birth - Foreign born (%)
Place of birth - Foreign born (%) - White
Place of birth - Foreign born (%) - Black or African American
Place of birth - Foreign born (%) - Asian
Place of birth - Foreign born (%) - Hispanic or Latino
Place of birth - Foreign born (%) - American Indian and Alaska Native
Place of birth - Foreign born (%) - Multirace
Place of birth - Foreign born (%) - Other Race
Residents speaking English at home (%)
Residents speaking English at home - Born in the United States (%)
Residents speaking English at home - Native, born elsewhere (%)
Residents speaking English at home - Foreign born (%)
Residents speaking Spanish at home (%)
Residents speaking Spanish at home - Born in the United States (%)
Residents speaking Spanish at home - Native, born elsewhere (%)
Residents speaking Spanish at home - Foreign born (%)
Residents speaking other language at home (%)
Residents speaking other language at home - Born in the United States (%)
Residents speaking other language at home - Native, born elsewhere (%)
Residents speaking other language at home - Foreign born (%)
Marital status - Never married (%)
Marital status - Now married (%)
Marital status - Separated (%)
Marital status - Widowed (%)
Marital status - Divorced (%)
Ancestries Reported - Arab (%)
Ancestries Reported - Czech (%)
Ancestries Reported - Danish (%)
Ancestries Reported - Dutch (%)
Ancestries Reported - English (%)
Ancestries Reported - French (%)
Ancestries Reported - French Canadian (%)
Ancestries Reported - German (%)
Ancestries Reported - Greek (%)
Ancestries Reported - Hungarian (%)
Ancestries Reported - Irish (%)
Ancestries Reported - Italian (%)
Ancestries Reported - Lithuanian (%)
Ancestries Reported - Norwegian (%)
Ancestries Reported - Polish (%)
Ancestries Reported - Portuguese (%)
Ancestries Reported - Russian (%)
Ancestries Reported - Scotch-Irish (%)
Ancestries Reported - Scottish (%)
Ancestries Reported - Slovak (%)
Ancestries Reported - Subsaharan African (%)
Ancestries Reported - Swedish (%)
Ancestries Reported - Swiss (%)
Ancestries Reported - Ukrainian (%)
Ancestries Reported - United States (%)
Ancestries Reported - Welsh (%)
Ancestries Reported - West Indian (%)
Ancestries Reported - Other (%)
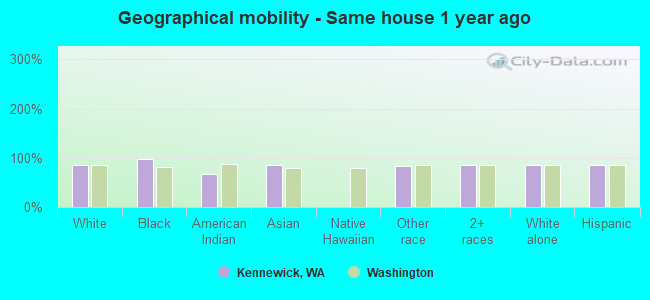
Geographical mobility - Same house 1 year ago (%)
Geographical mobility - Same house 1 year ago (%) - White
Geographical mobility - Same house 1 year ago (%) - Black or African American
Geographical mobility - Same house 1 year ago (%) - Asian
Geographical mobility - Same house 1 year ago (%) - Hispanic or Latino
Geographical mobility - Same house 1 year ago (%) - American Indian and Alaska Native
Geographical mobility - Same house 1 year ago (%) - Multirace
Geographical mobility - Same house 1 year ago (%) - Other Race
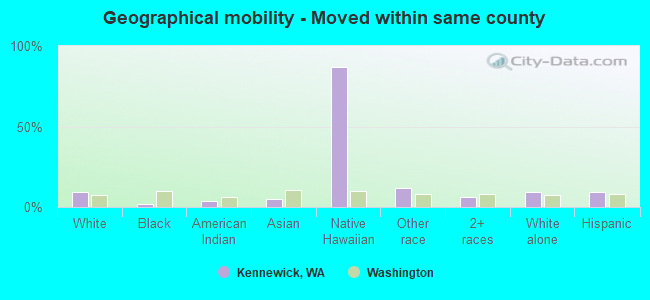
Geographical mobility - Moved within same county (%)
Geographical mobility - Moved within same county (%) - White
Geographical mobility - Moved within same county (%) - Black or African American
Geographical mobility - Moved within same county (%) - Asian
Geographical mobility - Moved within same county (%) - Hispanic or Latino
Geographical mobility - Moved within same county (%) - American Indian and Alaska Native
Geographical mobility - Moved within same county (%) - Multirace
Geographical mobility - Moved within same county (%) - Other Race
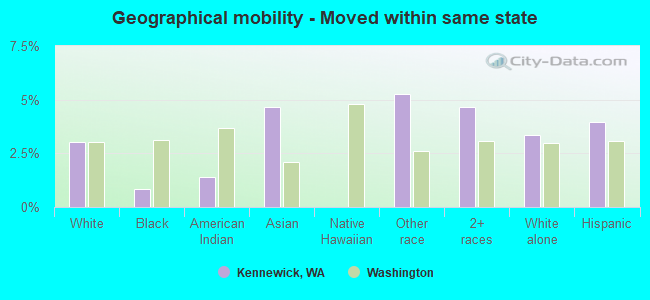
Geographical mobility - Moved from different county within same state (%)
Geographical mobility - Moved from different county within same state (%) - White
Geographical mobility - Moved from different county within same state (%) - Black or African American
Geographical mobility - Moved from different county within same state (%) - Asian
Geographical mobility - Moved from different county within same state (%) - Hispanic or Latino
Geographical mobility - Moved from different county within same state (%) - American Indian and Alaska Native
Geographical mobility - Moved from different county within same state (%) - Multirace
Geographical mobility - Moved from different county within same state (%) - Other Race
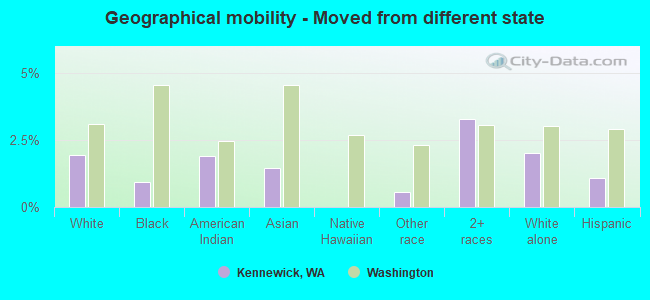
Geographical mobility - Moved from different state (%)
Geographical mobility - Moved from different state (%) - White
Geographical mobility - Moved from different state (%) - Black or African American
Geographical mobility - Moved from different state (%) - Asian
Geographical mobility - Moved from different state (%) - Hispanic or Latino
Geographical mobility - Moved from different state (%) - American Indian and Alaska Native
Geographical mobility - Moved from different state (%) - Multirace
Geographical mobility - Moved from different state (%) - Other Race
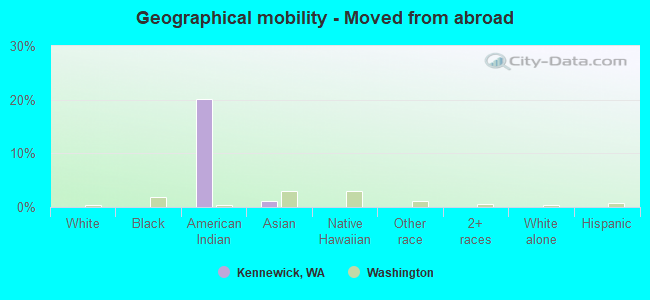
Geographical mobility - Moved from abroad (%)
Geographical mobility - Moved from abroad (%) - White
Geographical mobility - Moved from abroad (%) - Black or African American
Geographical mobility - Moved from abroad (%) - Asian
Geographical mobility - Moved from abroad (%) - Hispanic or Latino
Geographical mobility - Moved from abroad (%) - American Indian and Alaska Native
Geographical mobility - Moved from abroad (%) - Multirace
Geographical mobility - Moved from abroad (%) - Other Race
Place of birth for the foreign-born population - Ireland (%)
Place of birth for the foreign-born population - Denmark (%)
Place of birth for the foreign-born population - Norway (%)
Place of birth for the foreign-born population - Sweden (%)
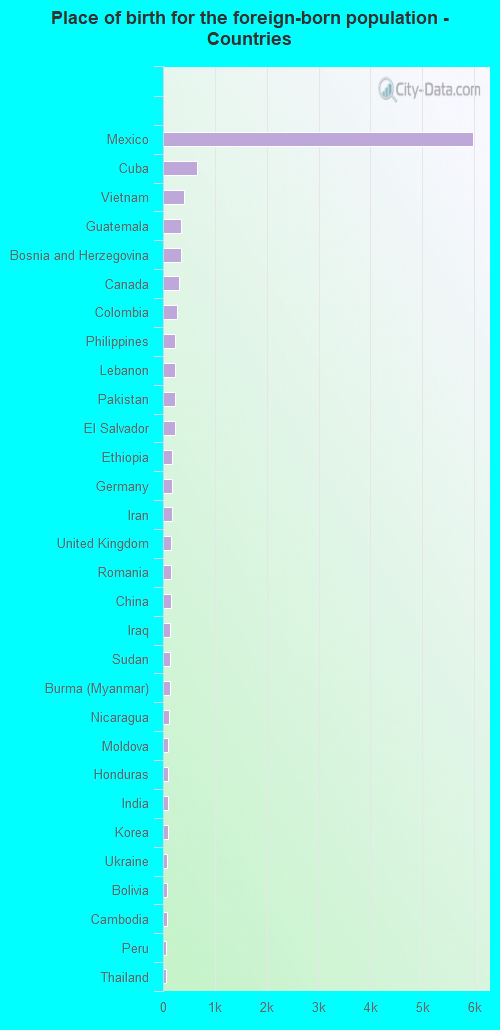
Place of birth for the foreign-born population - United Kingdom (%)
Place of birth for the foreign-born population - England (%)
Place of birth for the foreign-born population - Scotland (%)
Place of birth for the foreign-born population - Other Northern Europe (%)
Place of birth for the foreign-born population - Austria (%)
Place of birth for the foreign-born population - Belgium (%)
Place of birth for the foreign-born population - France (%)
Place of birth for the foreign-born population - Germany (%)
Place of birth for the foreign-born population - Netherlands (%)
Place of birth for the foreign-born population - Switzerland (%)
Place of birth for the foreign-born population - Other Western Europe (%)
Place of birth for the foreign-born population - Greece (%)
Place of birth for the foreign-born population - Italy (%)
Place of birth for the foreign-born population - Portugal (%)
Place of birth for the foreign-born population - Spain (%)
Place of birth for the foreign-born population - Other Southern Europe (%)
Place of birth for the foreign-born population - Albania (%)
Place of birth for the foreign-born population - Belarus (%)
Place of birth for the foreign-born population - Bosnia and Herzegovina (%)
Place of birth for the foreign-born population - Bulgaria (%)
Place of birth for the foreign-born population - Croatia (%)
Place of birth for the foreign-born population - Czechoslovakia (%)
Place of birth for the foreign-born population - Hungary (%)
Place of birth for the foreign-born population - Latvia (%)
Place of birth for the foreign-born population - Lithuania (%)
Place of birth for the foreign-born population - North Macedonia (Macedonia) (%)
Place of birth for the foreign-born population - Moldova (%)
Place of birth for the foreign-born population - Poland (%)
Place of birth for the foreign-born population - Romania (%)
Place of birth for the foreign-born population - Russia (%)
Place of birth for the foreign-born population - Serbia (%)
Place of birth for the foreign-born population - Ukraine (%)
Place of birth for the foreign-born population - Other Eastern Europe (%)
Place of birth for the foreign-born population - China (%)
Place of birth for the foreign-born population - Hong Kong (%)
Place of birth for the foreign-born population - Taiwan (%)
Place of birth for the foreign-born population - Japan (%)
Place of birth for the foreign-born population - Korea (%)
Place of birth for the foreign-born population - Other Eastern Asia (%)
Place of birth for the foreign-born population - Afghanistan (%)
Place of birth for the foreign-born population - Bangladesh (%)
Place of birth for the foreign-born population - India (%)
Place of birth for the foreign-born population - Iran (%)
Place of birth for the foreign-born population - Kazakhstan (%)
Place of birth for the foreign-born population - Nepal (%)
Place of birth for the foreign-born population - Pakistan (%)
Place of birth for the foreign-born population - Sri Lanka (%)
Place of birth for the foreign-born population - Uzbekistan (%)
Place of birth for the foreign-born population - Other South Central Asia (%)
Place of birth for the foreign-born population - Burma (%)
Place of birth for the foreign-born population - Cambodia (%)
Place of birth for the foreign-born population - Indonesia (%)
Place of birth for the foreign-born population - Laos (%)
Place of birth for the foreign-born population - Malaysia (%)
Place of birth for the foreign-born population - Philippines (%)
Place of birth for the foreign-born population - Singapore (%)
Place of birth for the foreign-born population - Thailand (%)
Place of birth for the foreign-born population - Vietnam (%)
Place of birth for the foreign-born population - Other South Eastern Asia (%)
Place of birth for the foreign-born population - Armenia (%)
Place of birth for the foreign-born population - Iraq (%)
Place of birth for the foreign-born population - Israel (%)
Place of birth for the foreign-born population - Jordan (%)
Place of birth for the foreign-born population - Kuwait (%)
Place of birth for the foreign-born population - Lebanon (%)
Place of birth for the foreign-born population - Saudi Arabia (%)
Place of birth for the foreign-born population - Syria (%)
Place of birth for the foreign-born population - Turkey (%)
Place of birth for the foreign-born population - Yemen (%)
Place of birth for the foreign-born population - Other Western Asia (%)
Place of birth for the foreign-born population - Eritrea (%)
Place of birth for the foreign-born population - Ethiopia (%)
Place of birth for the foreign-born population - Kenya (%)
Place of birth for the foreign-born population - Somalia (%)
Place of birth for the foreign-born population - Uganda (%)
Place of birth for the foreign-born population - Zimbabwe (%)
Place of birth for the foreign-born population - Other Eastern Africa (%)
Place of birth for the foreign-born population - Cameroon (%)
Place of birth for the foreign-born population - Congo (%)
Place of birth for the foreign-born population - Democratic Republic of Congo (Zaire) (%)
Place of birth for the foreign-born population - Other Middle Africa (%)
Place of birth for the foreign-born population - Egypt (%)
Place of birth for the foreign-born population - Morocco (%)
Place of birth for the foreign-born population - Sudan (%)
Place of birth for the foreign-born population - Other Northern Africa (%)
Place of birth for the foreign-born population - South Africa (%)
Place of birth for the foreign-born population - Other Southern Africa (%)
Place of birth for the foreign-born population - Cabo Verde (%)
Place of birth for the foreign-born population - Ghana (%)
Place of birth for the foreign-born population - Liberia (%)
Place of birth for the foreign-born population - Nigeria (%)
Place of birth for the foreign-born population - Senegal (%)
Place of birth for the foreign-born population - Sierra Leone (%)
Place of birth for the foreign-born population - Other Western Africa (%)
Place of birth for the foreign-born population - Australia (%)
Place of birth for the foreign-born population - New Zealand (%)
Place of birth for the foreign-born population - Fiji (%)
Place of birth for the foreign-born population - Micronesia (%)
Place of birth for the foreign-born population - Bahamas (%)
Place of birth for the foreign-born population - Barbados (%)
Place of birth for the foreign-born population - Cuba (%)
Place of birth for the foreign-born population - Dominica (%)
Place of birth for the foreign-born population - Dominican Republic (%)
Place of birth for the foreign-born population - Grenada (%)
Place of birth for the foreign-born population - Haiti (%)
Place of birth for the foreign-born population - Jamaica (%)
Place of birth for the foreign-born population - St. Vincent and the Grenadines (%)
Place of birth for the foreign-born population - Trinidad and Tobago (%)
Place of birth for the foreign-born population - West Indies (%)
Place of birth for the foreign-born population - Other Caribbean (%)
Place of birth for the foreign-born population - Belize (%)
Place of birth for the foreign-born population - Costa Rica (%)
Place of birth for the foreign-born population - El Salvador (%)
Place of birth for the foreign-born population - Guatemala (%)
Place of birth for the foreign-born population - Honduras (%)
Place of birth for the foreign-born population - Mexico (%)
Place of birth for the foreign-born population - Nicaragua (%)
Place of birth for the foreign-born population - Panama (%)
Place of birth for the foreign-born population - Other Central America (%)
Place of birth for the foreign-born population - Argentina (%)
Place of birth for the foreign-born population - Bolivia (%)
Place of birth for the foreign-born population - Brazil (%)
Place of birth for the foreign-born population - Chile (%)
Place of birth for the foreign-born population - Colombia (%)
Place of birth for the foreign-born population - Ecuador (%)
Place of birth for the foreign-born population - Guyana (%)
Place of birth for the foreign-born population - Peru (%)
Place of birth for the foreign-born population - Uruguay (%)
Place of birth for the foreign-born population - Venezuela (%)
Place of birth for the foreign-born population - Other South America (%)
Place of birth for the foreign-born population - Canada (%)
Place of birth for the foreign-born population - Other Northern America (%)
Place of birth for the foreign-born population - Other (%)
Latest news about races in Kennewick, WA collected exclusively by city-data.com from local newspapers, TV, and radio stations
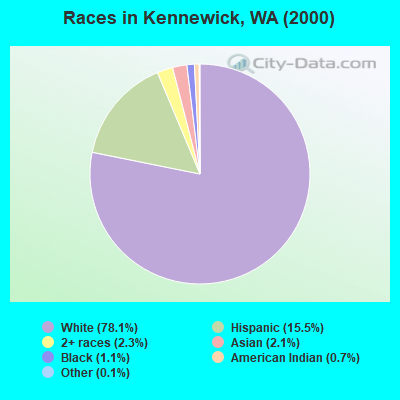
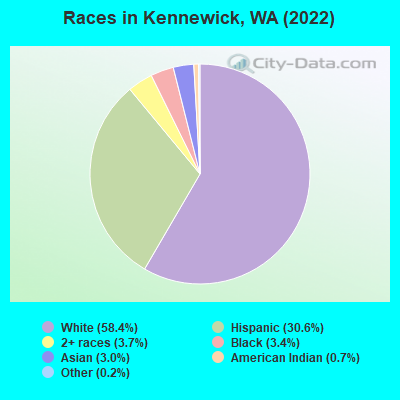
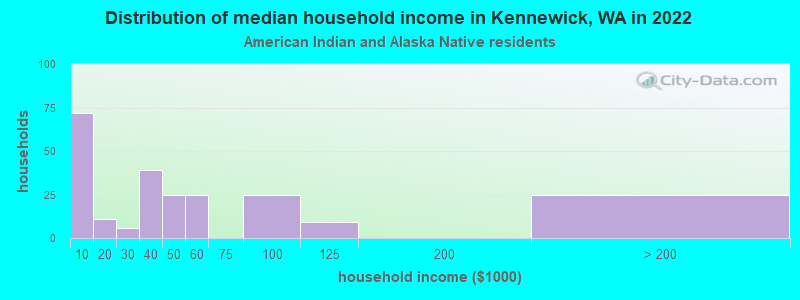
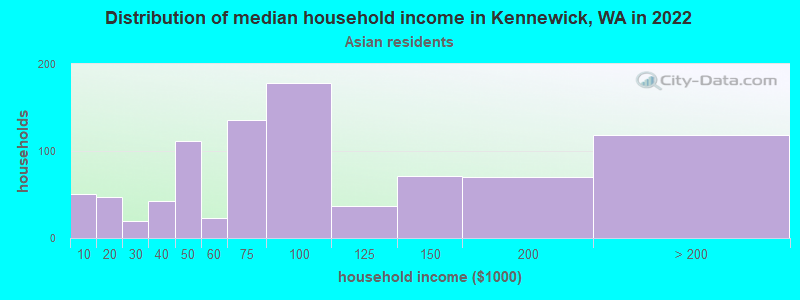
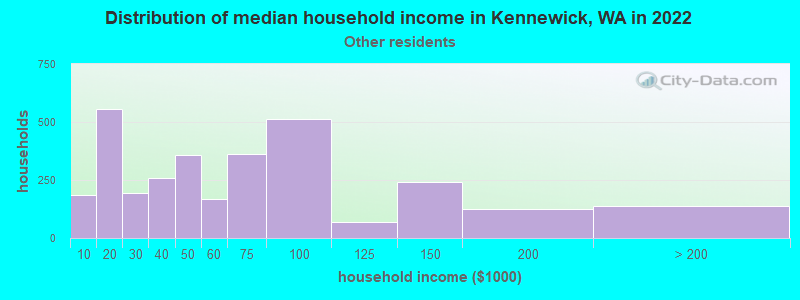
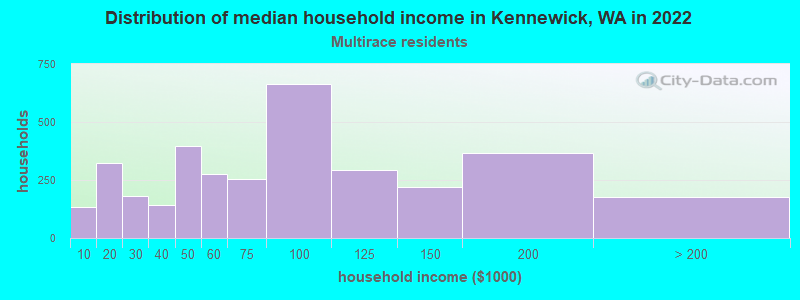
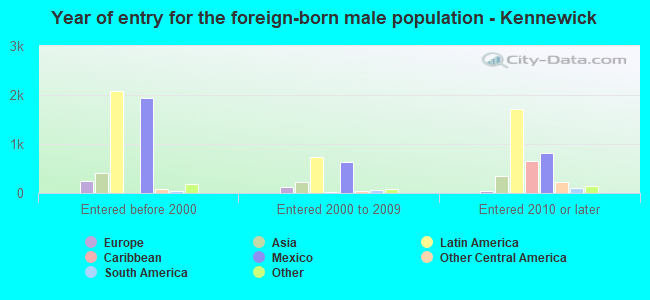
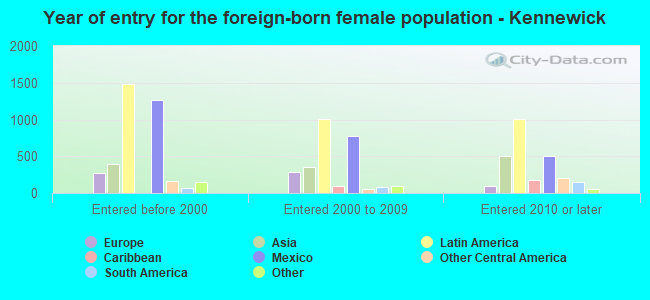
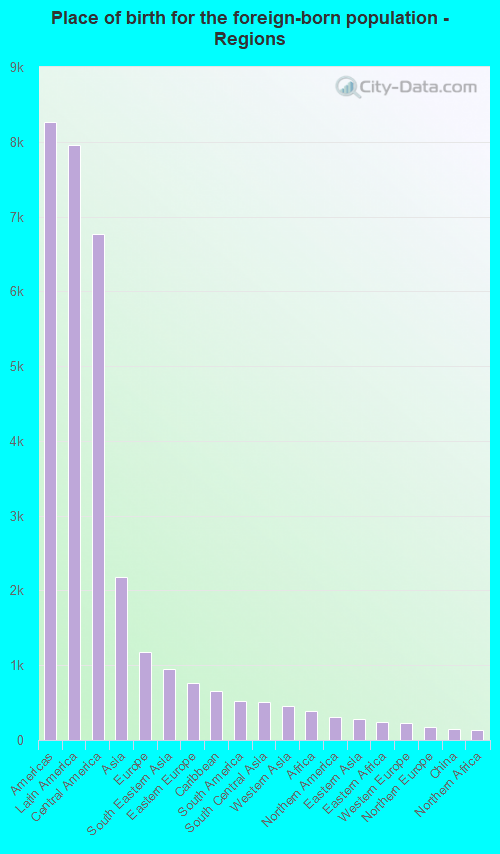
According to 2022 data, the most numerous races in Kennewick, WA are White alone (49,492 residents), Hispanic (25,969 residents), and Asian alone (2,519 residents). 75.1% of Kennewick residents speak English at home. 14.0% of Kennewick, WA residents are foreign-born (9.1% born in Latin America, 2.5% born in Asia), which is 6.9% less than the foreign-born rate of 15.0% across the entire state of Washington.
Race distribution in Kennewick
2000 2022
4,652,490 78.9% White alone 441,509 7.5% Hispanic 319,401 5.4% Asian alone 184,631 3.1% Black alone 175,926 3.0% Two or more races 85,396 1.4% American Indian alone 22,779 0.4% Native Hawaiian and Other 11,989 0.2% Other race alone
4,941,456 63.5% White alone 1,093,313 14.0% Hispanic 755,832 9.7% Asian alone 523,448 6.7% Two or more races 299,537 3.8% Black alone 69,024 0.9% American Indian alone 52,231 0.7% Native Hawaiian and Other 50,945 0.7% Other race alone
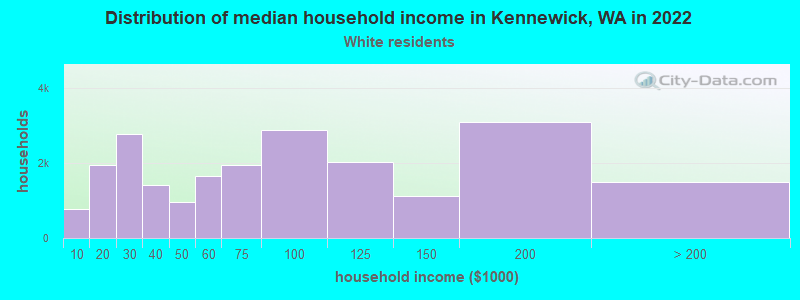
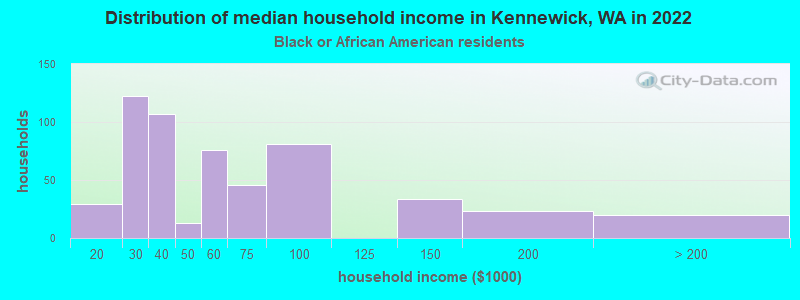
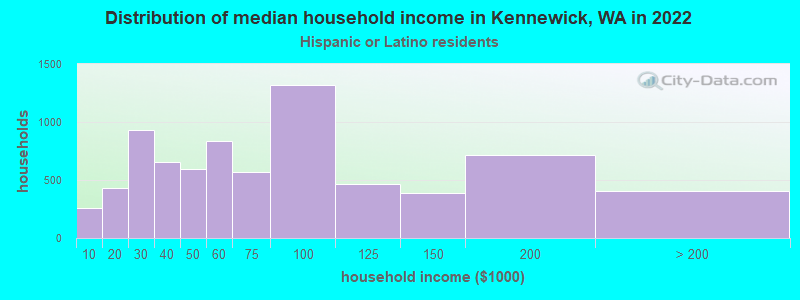
Income and house value in Kennewick Median household income in 2022 $69,344 White non-Hispanic householders$91,110 Black householders$130,545 Asian householders$64,924 Some other race householders$82,101 Two or more races householders$81,000 Hispanic or Latino race householdersMedian 2022 house value $395,177 White Non-Hispanic householders$386,965 Black or African American householders$330,854 American Indian or Alaska Native householders $366,437 Asian householders$506,374 Native Hawaiian and other Pacific Islander householders$283,638 Some other race householders$437,945 Two or more races householders$267,215 Hispanic or Latino householders
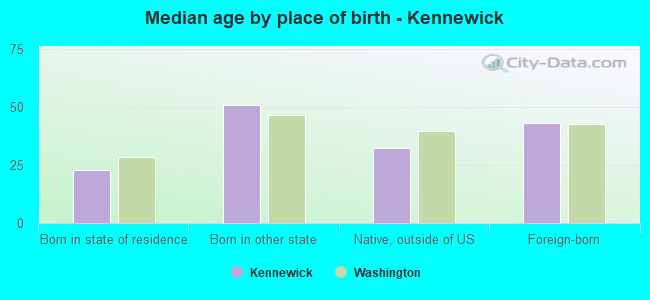
Median age by race in Kennewick
40.2 Median age for White residents38.4 41.9 18.9 Median age for Black or African American residents18.2 43.3 29.4 Median age for American Indian / Alaska Native residents12.3 33.9 42.4 Median age for Asian residents34.4 47.0 -666,666,666.0 Median age for Native Hawaiian / Pacific Islander residents-666,666,666.0 -666,666,666.0 19.9 Median age for Other race residents24.1 15.9 24.5 Median age for Two or more races residents23.8 25.8 42.6 Median age for White alone residents41.0 43.9 21.8 Median age for Hispanic or Latino residents23.6 19.3
Owner/renter occupied households by race in Kennewick
House owners and renters - White residents 14,590 66.2% Owner occupied7,458 33.8% Renter occupiedHouse owners and renters - Black or African American residents 107 21.9% Owner occupied382 78.1% Renter occupiedHouse owners and renters - American Indian / Alaska Native residents 143 61.6% Owner occupied90 38.4% Renter occupiedHouse owners and renters - Asian residents 589 64.0% Owner occupied332 36.0% Renter occupiedHouse owners and renters - Other race residents 2,159 63.5% Owner occupied1,243 36.5% Renter occupiedHouse owners and renters - Two or more races residents 2,145 65.8% Owner occupied1,113 34.2% Renter occupiedHouse owners and renters - White alone residents 13,859 65.7% Owner occupied7,240 34.3% Renter occupiedHouse owners and renters - Hispanic or Latino residents 4,491 69.6% Owner occupied1,965 30.4% Renter occupied
Language usage in Kennewick
English speakers - Total 75.1% of residents of Kennewick speak English at home.
19.5% of residents speak Spanish at home 9,909 64.8% Speak English very well5,380 35.2% Speak English less than very well5.5% of residents speak other language at home 2,686 62.3% Speak English very well1,627 37.7% Speak English less than very well
English speakers - Born in the United States 92.7% of residents of Kennewick speak English at home.
6.2% of residents speak Spanish at home 1,434 92.1% Speak English very well123 7.9% Speak English less than very well1.1% of residents speak other language at home 217 79.8% Speak English very well55 20.2% Speak English less than very well
English speakers - Native, born elsewhere 52.5% of residents of Kennewick speak English at home.
44.5% of residents speak Spanish at home 86 59.3% Speak English very well59 40.7% Speak English less than very well3.1% of residents speak other language at home 10 100.0% Speak English very well
English speakers - Foreign-born 7.2% of residents of Kennewick speak English at home.
60.0% of residents speak Spanish at home 2,776 44.6% Speak English very well3,446 55.4% Speak English less than very well32.8% of residents speak other language at home 1,835 53.9% Speak English very well1,572 46.1% Speak English less than very well
White (Caucasian) - Speak only English Native:
94.8% (47,342)Foreign-born:
17.5% (358)
White (Caucasian) - Speak another language Native:
5.2% (2,583)Foreign-born:
82.5% (1,689)
Black or African American - Speak only English Native:
85.2% (1,374)Foreign-born:
43.4% (181)
Black or African American - Speak another language Native:
13.6% (219)Foreign-born:
59.4% (248)
American Indian / Alaska Native - Speak another language Native:
57.6% (368)Foreign-born:
100.0% (21)
Asian - Speak only English Native:
45.7% (118)Foreign-born:
1.6% (32)
Asian - Speak another language Native:
54.3% (140)Foreign-born:
98.4% (1,926)
Other race - Speak only English Native:
34.4% (2,272)Foreign-born:
3.2% (126)
Other race - Speak another language Native:
65.6% (4,334)Foreign-born:
96.8% (3,862)
Two or more races - Speak only English Native:
64.9% (5,377)Foreign-born:
11.7% (229)
Two or more races - Speak another language Native:
35.1% (2,906)Foreign-born:
88.3% (1,721)
White alone - Speak only English Native:
98.2% (45,179)Foreign-born:
24.8% (316)
White alone - Speak another language Native:
1.8% (837)Foreign-born:
75.2% (958)
Hispanic or Latino - Speak only English Native:
45.8% (7,385)Foreign-born:
2.6% (168)
Hispanic or Latino - Speak another language Native:
54.2% (8,722)Foreign-born:
97.4% (6,222)
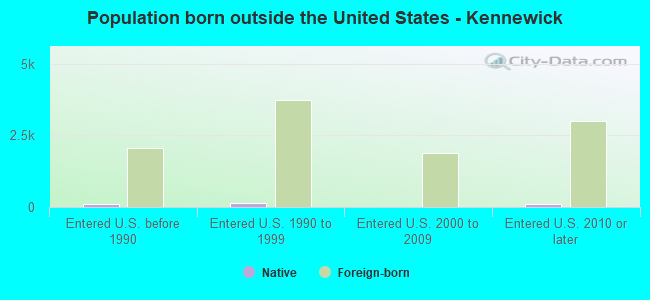
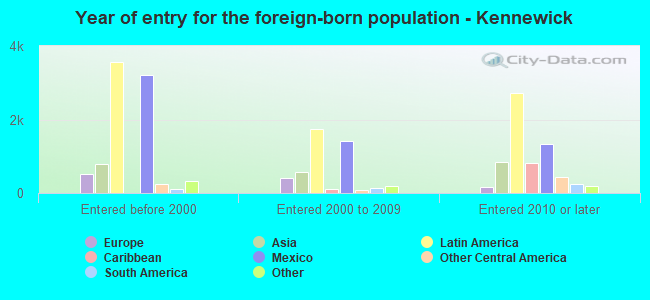
Foreign-born residents in Kennewick 12,056 residents are foreign born (9.1% Latin America , 2.5% Asia ).
This city:
14.0%Washington:
14.9%
Marital status for residents in Kennewick Marital status - White (Caucasian) population 15 years and over
Males 37.0% Never married48.9% Now married0.7% Separated2.6% Widowed10.8% DivorcedFemales 24.0% Never married48.9% Now married1.8% Separated10.8% Widowed14.5% DivorcedWomen who gave birth in the past 12 months Now married:
78.5% (335)Unmarried:
21.5% (92)
Women who did not give birth in the past 12 months Now married:
46.1% (5,200)Unmarried:
53.9% (6,090)
Marital status - Black or African American population 15 years and over
Males 38.4% Never married41.6% Now married2.9% Separated7.6% Widowed9.4% DivorcedFemales 42.6% Never married24.4% Now married9.8% Separated5.4% Widowed17.9% DivorcedWomen who gave birth in the past 12 months Now married:
0.0% (0)Unmarried:
100.0% (43)
Women who did not give birth in the past 12 months Now married:
44.9% (209)Unmarried:
55.1% (256)
Marital status - American Indian / Alaska Native population 15 years and over
Males 67.8% Never married9.3% Now married3.0% Separated8.1% Widowed11.9% DivorcedFemales 39.9% Never married44.0% Now married0.0% Separated0.0% Widowed16.0% DivorcedWomen who did not give birth in the past 12 months Now married:
43.0% (113)Unmarried:
57.0% (150)
Marital status - Asian population 15 years and over
Males 44.9% Never married53.3% Now married0.0% Separated0.5% Widowed1.3% DivorcedFemales 44.0% Never married36.2% Now married0.0% Separated15.3% Widowed4.5% DivorcedWomen who gave birth in the past 12 months Now married:
100.0% (26)Unmarried:
0.0% (0)
Women who did not give birth in the past 12 months Now married:
33.5% (239)Unmarried:
66.5% (474)
Marital status - Other race population 15 years and over
Males 57.7% Never married38.1% Now married0.0% Separated1.2% Widowed3.0% DivorcedFemales 50.1% Never married32.7% Now married5.2% Separated0.1% Widowed11.8% DivorcedWomen who gave birth in the past 12 months Now married:
100.0% (206)Unmarried:
0.0% (0)
Women who did not give birth in the past 12 months Now married:
32.2% (1,107)Unmarried:
67.8% (2,336)
Marital status - Two or more races population 15 years and over
Males 65.1% Never married30.0% Now married0.0% Separated0.0% Widowed4.9% DivorcedFemales 50.4% Never married31.9% Now married5.9% Separated4.6% Widowed7.2% DivorcedWomen who gave birth in the past 12 months Now married:
28.2% (31)Unmarried:
71.8% (80)
Women who did not give birth in the past 12 months Now married:
25.1% (718)Unmarried:
74.9% (2,140)
Marital status - White alone, not Hispanic / Latino population 15 years and over
Males 35.8% Never married49.3% Now married0.7% Separated2.8% Widowed11.3% DivorcedFemales 24.3% Never married47.4% Now married2.0% Separated11.7% Widowed14.7% DivorcedWomen who gave birth in the past 12 months Now married:
100.0% (335)Unmarried:
0.0% (0)
Women who did not give birth in the past 12 months Now married:
43.1% (4,389)Unmarried:
56.9% (5,806)
Marital status - Hispanic or Latino population 15 years and over
Males 59.6% Never married37.2% Now married0.0% Separated1.0% Widowed2.3% DivorcedFemales 49.2% Never married39.6% Now married3.2% Separated1.8% Widowed6.1% DivorcedWomen who gave birth in the past 12 months Now married:
35.6% (206)Unmarried:
64.4% (372)
Women who did not give birth in the past 12 months Now married:
39.1% (2,313)Unmarried:
60.9% (3,610)
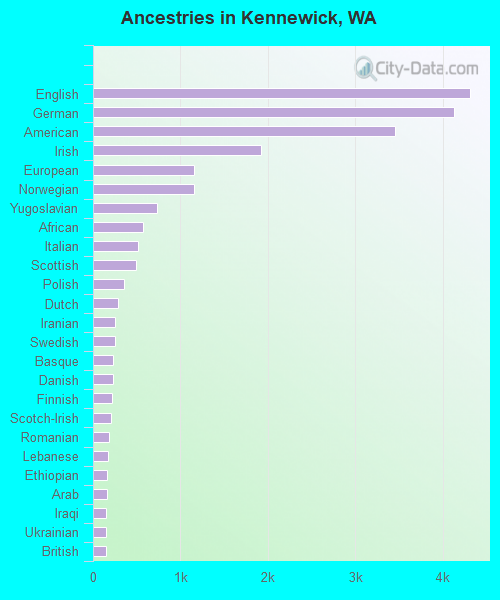
Ancestries in Kennewick
4,311 9.2% English4,130 8.8% German3,450 7.4% American1,919 4.1% Irish1,157 2.5% European1,154 2.5% Norwegian733 1.6% Yugoslavian566 1.2% African511 1.1% Italian495 1.1% Scottish356 0.8% Polish290 0.6% Dutch251 0.5% Iranian246 0.5% Swedish228 0.5% Basque225 0.5% Danish215 0.5% Finnish208 0.4% Scotch-Irish187 0.4% Romanian169 0.4% Lebanese165 0.4% Ethiopian155 0.3% Arab151 0.3% Iraqi150 0.3% Ukrainian144 0.3% British139 0.3% Welsh132 0.3% French131 0.3% Northern European114 0.2% Hungarian96 0.2% Scandinavian85 0.2% Armenian83 0.2% Croatian83 0.2% French Canadian82 0.2% Swiss74 0.2% Sudanese61 0.1% Czech50 0.1% Russian41 0.09% Guyanese38 0.08% Latvian38 0.08% Canadian33 0.07% Eastern European23 0.05% Belgian18 0.04% Austrian17 0.04% Australian11 0.02% Czechoslovakian11 0.02% Pennsylvania German10 0.02% Greek8 0.02% Slavic3 0.01% Jamaican
Geographical mobility in Kennewick Same house 1 year ago 46,304 85.5% White (Caucasian)2,031 97.7% Black or African American521 66.8% American Indian / Alaska Native1,814 86.3% Asian9,308 83.1% Other race9,450 85.8% Two or more races42,047 85.6% White alone, not Hispanic / Latino21,598 85.4% Hispanic or LatinoMoved within same county 5,138 9.5% White / Caucasian41 2.0% Black or African American31 4.0% American Indian / Alaska Native110 5.3% Asian14 87.0% Native Hawaiian / Pacific Islander1,289 11.5% Other race684 6.2% Two or more races4,452 9.1% White alone, not Hispanic / Latino2,417 9.6% Hispanic or LatinoMoved within same state 1,643 3.0% White / Caucasian18 0.8% Black or African American11 1.4% American Indian / Alaska Native98 4.7% Asian590 5.3% Other race514 4.7% Two or more races1,643 3.3% White alone, not Hispanic / Latino996 3.9% Hispanic or LatinoMoved from different state 1,058 2.0% White / Caucasian19 0.9% Black or African American15 1.9% American Indian / Alaska Native31 1.5% Asian61 0.5% Other race362 3.3% Two or more races991 2.0% White alone, not Hispanic / Latino276 1.1% Hispanic or LatinoMoved from abroad 157 20.1% American Indian / Alaska Native22 1.0% Asian
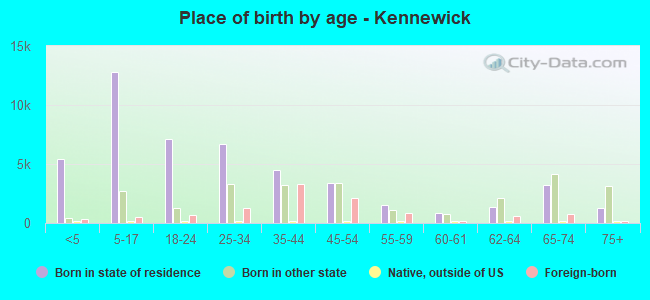
Children Nativity (place of birth) in Kennewick
Children under 6 years - Living with two parents Both parents native 2,246 100.0% NativeBoth parents foreign-born 820 97.7% Native20 2.3% Foreign-bornOne native, one foreign-born parent 907 100.0% NativeChildren under 6 years - Living with one parent Native parent 1,770 99.7% Native5 0.3% Foreign-bornForeign-born parent 554 100.0% NativeChildren 6 to 17 years - Living with two parents Both parents native 5,477 98.6% Native79 1.4% Foreign-bornBoth parents foreign-born 2,875 94.7% Native162 5.3% Foreign-bornOne native, one foreign-born parent 779 100.0% NativeChildren 6 to 17 years - Living with one parent Native parent 2,664 100.0% NativeForeign-born parent 1,646 60.4% Native1,078 39.6% Foreign-born
Grandparents responsible for own grandchildren in Kennewick
Grandparents (30 to 59 years) White / Caucasian 231 39.4% Responsible for grandchildren355 60.6% Not responsible for grandchildrenBlack or African American 19 61.7% Responsible for grandchildren12 38.3% Not responsible for grandchildrenTwo or more races 14 62.6% Responsible for grandchildren8 37.4% Not responsible for grandchildrenWhite alone, not Hispanic / Latino 333 58.8% Responsible for grandchildren234 41.2% Not responsible for grandchildrenHispanic or Latino 41 23.3% Responsible for grandchildren136 76.7% Not responsible for grandchildrenGrandparents (60 years and over) White / Caucasian 208 20.8% Responsible for grandchildren791 79.2% Not responsible for grandchildrenTwo or more races 29 60.2% Responsible for grandchildren19 39.8% Not responsible for grandchildrenWhite alone, not Hispanic / Latino 203 21.2% Responsible for grandchildren754 78.8% Not responsible for grandchildrenHispanic or Latino 20 22.3% Responsible for grandchildren69 77.7% Not responsible for grandchildren