Races in Kent, Connecticut (CT) Detailed Stats
Ancestries, Foreign-born residents, place of birth

Recent posts about races in Kent, Connecticut on our local forum with over 2,400,000 registered users:
 | 2024 Connecticut Town Tournament VI (Celebrating the 10-Year Anniversary & Dazzleman's Memorial) (1089 replies) |
| Weekend/Second Home Suggestions & Questions from NYC (53 replies) |
| Connecticut Weather Discussion 3 (8061 replies) |
| Is Norwich Commutable to NYC? (100 replies) |
| Connecticut TOWN TOURNAMENT V (2022) (831 replies) |
| CT….Where no one comes to vacation. (99 replies) |
Latest news about races in Kent, CT collected exclusively by city-data.com from local newspapers, TV, and radio stations
8.1% of Kent, CT residents are foreign-born (5.9% born in Europe, 1.4% born in Asia), which is 85.6% less than the foreign-born rate of 15.0% across the entire state of Connecticut.
Race distribution in Kent

- 2,70194.5%White alone
- 722.5%Hispanic
- 240.8%Two or more races
- 220.8%American Indian alone
- 210.7%Asian alone
- 160.6%Black alone
- 20.07%Other race alone

2000
2022
-
- 2,638,84577.5%White alone
- 320,3239.4%Hispanic
- 295,5718.7%Black alone
- 81,5642.4%Asian alone
- 52,8961.6%Two or more races
- 8,1410.2%Other race alone
- 7,2670.2%American Indian alone
- 9580.03%Native Hawaiian and Other
Pacific Islander alone

-
- 2,246,91362.0%White alone
- 658,97818.2%Hispanic
- 353,9739.8%Black alone
- 172,9294.8%Asian alone
- 159,6314.4%Two or more races
- 29,7610.8%Other race alone
- 3,4280.09%American Indian alone
- 5920.02%Native Hawaiian and Other
Pacific Islander alone

Income and house value in Kent
- Median household income in 2022
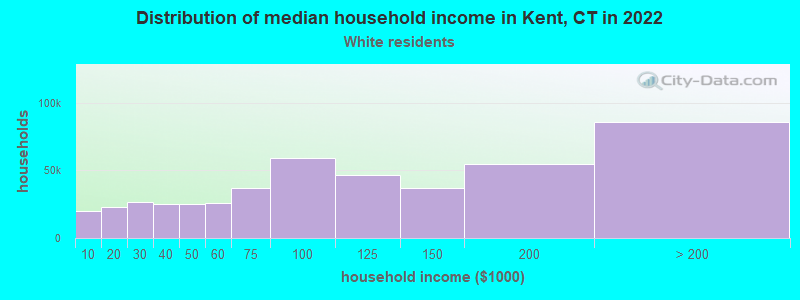
- $93,151White non-Hispanic householders
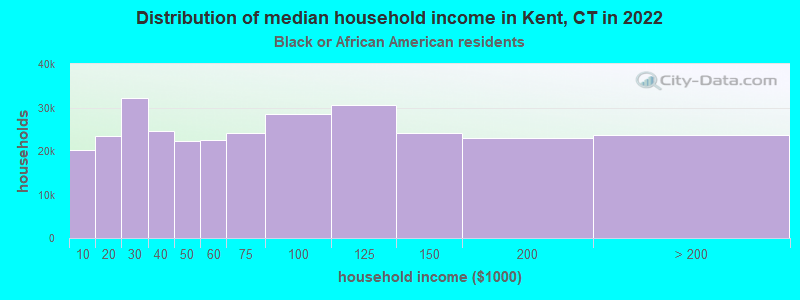
- $109,472Black householders
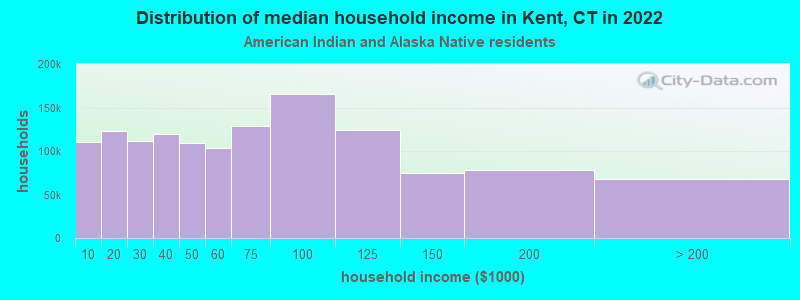
- $43,735American Indian and Alaska Native householders
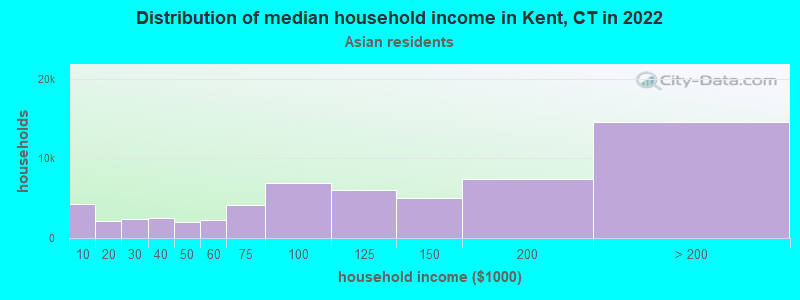
- $149,829Asian householders
- $58,613Some other race householders
- $10,749Hispanic or Latino race householders
- Median 2022 house value
- $408,165White Non-Hispanic householders
- $756,662Black or African American householders
- $351,307American Indian or Alaska Native householders
- $243,212Some other race householders
- $390,005Hispanic or Latino householders
Household income for White non-Hispanic householders
Household income for Black householders
Household income for American Indian and Alaska Native householders
Household income for Asian householders
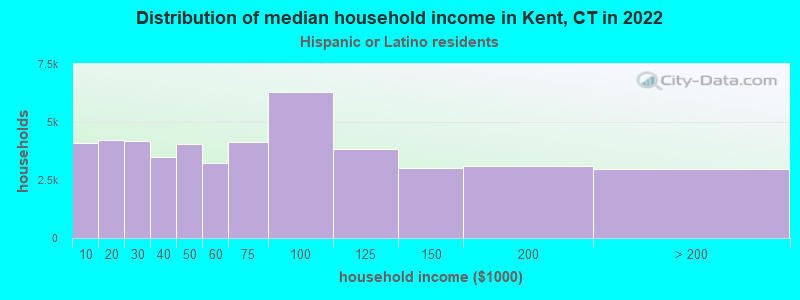
Household income for Hispanic or Latino race householders
Foreign-born residents in Kent
231 residents are foreign born (5.9% Europe, 1.4% Asia).
| This city: | 8.1% |
| Connecticut: | 10.9% |
Ancestries in Kent

- 67818.9%English
- 59116.5%Irish
- 49413.8%German
- 41511.6%Other
- 2527.0%Italian
- 1624.5%Scottish
- 1554.3%French
- 1514.2%Polish
- 1444.0%United States
- 1363.8%Swedish
- 752.1%Dutch
- 601.7%Hungarian
- 501.4%French Canadian
- 411.1%Welsh
- 381.1%Norwegian
- 280.8%Czech
- 260.7%Lithuanian
- 240.7%Scotch-Irish
- 160.4%Swiss
- 130.4%Russian
- 130.4%Slovak
- 100.3%Arab
- 100.3%Subsaharan African
- 80.2%Danish

Zip codes: 06757.