Races in Kentwood, Michigan (MI) Detailed Stats
Data:
Races - White alone (%)
Races - White alone (% change since 2000)
Races - Black alone (%)
Races - Black alone (% change since 2000)
Races - American Indian alone (%)
Races - American Indian alone (% change since 2000)
Races - Asian alone (%)
Races - Asian alone (% change since 2000)
Races - Hispanic (%)
Races - Hispanic (% change since 2000)
Races - Native Hawaiian and Other Pacific Islander alone (%)
Races - Native Hawaiian and Other Pacific Islander alone (% change since 2000)
Races - Two or more races(%)
Races - Two or more races(% change since 2000)
Races - Other race alone (%)
Races - Other race alone (% change since 2000)
Racial diversity
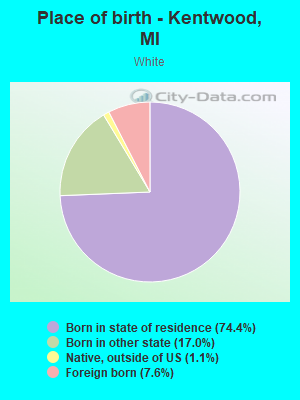
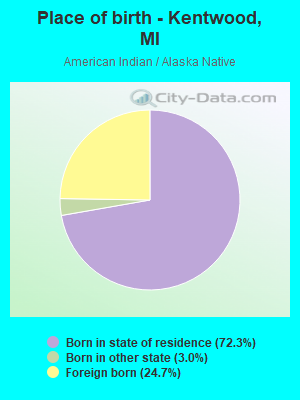
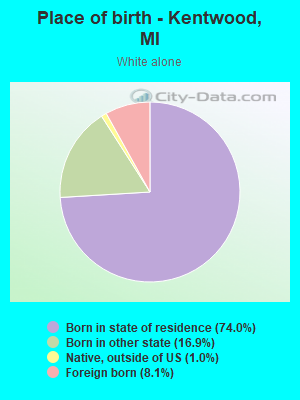
Place of birth - Born in state of residence (%)
Place of birth - Born in state of residence (%) - White
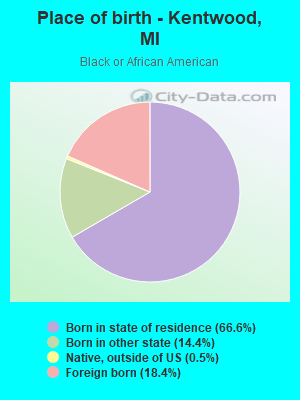
Place of birth - Born in state of residence (%) - Black or African American
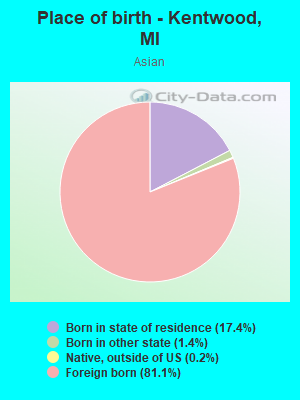
Place of birth - Born in state of residence (%) - Asian
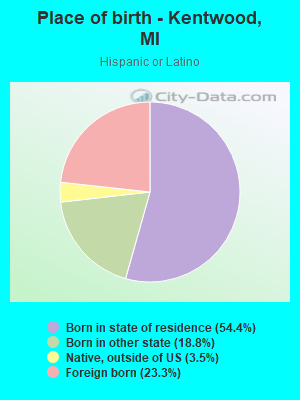
Place of birth - Born in state of residence (%) - Hispanic or Latino
Place of birth - Born in state of residence (%) - American Indian and Alaska Native
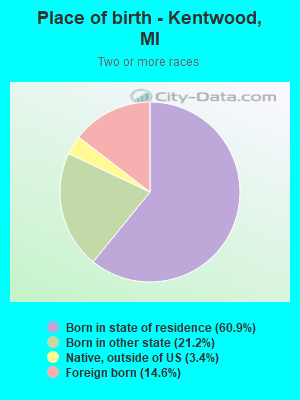
Place of birth - Born in state of residence (%) - Multirace
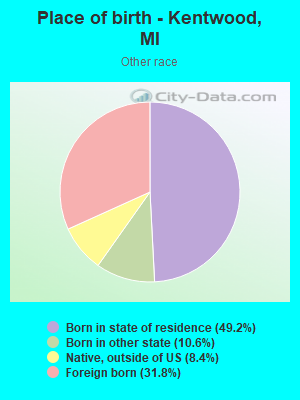
Place of birth - Born in state of residence (%) - Other Race
Place of birth - Born in other state (%)
Place of birth - Born in other state (%) - White
Place of birth - Born in other state (%) - Black or African American
Place of birth - Born in other state (%) - Asian
Place of birth - Born in other state (%) - Hispanic or Latino
Place of birth - Born in other state (%) - American Indian and Alaska Native
Place of birth - Born in other state (%) - Multirace
Place of birth - Born in other state (%) - Other Race
Place of birth - Native, outside of US (%)
Place of birth - Native, outside of US (%) - White
Place of birth - Native, outside of US (%) - Black or African American
Place of birth - Native, outside of US (%) - Asian
Place of birth - Native, outside of US (%) - Hispanic or Latino
Place of birth - Native, outside of US (%) - American Indian and Alaska Native
Place of birth - Native, outside of US (%) - Multirace
Place of birth - Native, outside of US (%) - Other Race
Place of birth - Foreign born (%)
Place of birth - Foreign born (%) - White
Place of birth - Foreign born (%) - Black or African American
Place of birth - Foreign born (%) - Asian
Place of birth - Foreign born (%) - Hispanic or Latino
Place of birth - Foreign born (%) - American Indian and Alaska Native
Place of birth - Foreign born (%) - Multirace
Place of birth - Foreign born (%) - Other Race
Residents speaking English at home (%)
Residents speaking English at home - Born in the United States (%)
Residents speaking English at home - Native, born elsewhere (%)
Residents speaking English at home - Foreign born (%)
Residents speaking Spanish at home (%)
Residents speaking Spanish at home - Born in the United States (%)
Residents speaking Spanish at home - Native, born elsewhere (%)
Residents speaking Spanish at home - Foreign born (%)
Residents speaking other language at home (%)
Residents speaking other language at home - Born in the United States (%)
Residents speaking other language at home - Native, born elsewhere (%)
Residents speaking other language at home - Foreign born (%)
Marital status - Never married (%)
Marital status - Now married (%)
Marital status - Separated (%)
Marital status - Widowed (%)
Marital status - Divorced (%)
Ancestries Reported - Arab (%)
Ancestries Reported - Czech (%)
Ancestries Reported - Danish (%)
Ancestries Reported - Dutch (%)
Ancestries Reported - English (%)
Ancestries Reported - French (%)
Ancestries Reported - French Canadian (%)
Ancestries Reported - German (%)
Ancestries Reported - Greek (%)
Ancestries Reported - Hungarian (%)
Ancestries Reported - Irish (%)
Ancestries Reported - Italian (%)
Ancestries Reported - Lithuanian (%)
Ancestries Reported - Norwegian (%)
Ancestries Reported - Polish (%)
Ancestries Reported - Portuguese (%)
Ancestries Reported - Russian (%)
Ancestries Reported - Scotch-Irish (%)
Ancestries Reported - Scottish (%)
Ancestries Reported - Slovak (%)
Ancestries Reported - Subsaharan African (%)
Ancestries Reported - Swedish (%)
Ancestries Reported - Swiss (%)
Ancestries Reported - Ukrainian (%)
Ancestries Reported - United States (%)
Ancestries Reported - Welsh (%)
Ancestries Reported - West Indian (%)
Ancestries Reported - Other (%)
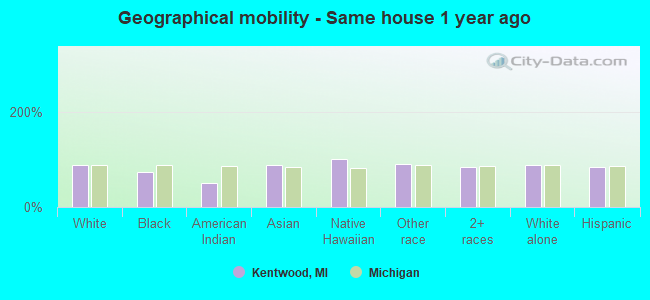
Geographical mobility - Same house 1 year ago (%)
Geographical mobility - Same house 1 year ago (%) - White
Geographical mobility - Same house 1 year ago (%) - Black or African American
Geographical mobility - Same house 1 year ago (%) - Asian
Geographical mobility - Same house 1 year ago (%) - Hispanic or Latino
Geographical mobility - Same house 1 year ago (%) - American Indian and Alaska Native
Geographical mobility - Same house 1 year ago (%) - Multirace
Geographical mobility - Same house 1 year ago (%) - Other Race
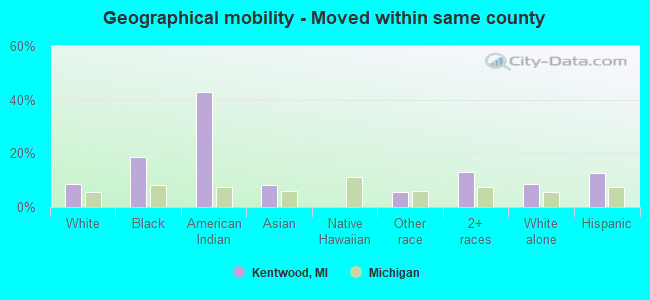
Geographical mobility - Moved within same county (%)
Geographical mobility - Moved within same county (%) - White
Geographical mobility - Moved within same county (%) - Black or African American
Geographical mobility - Moved within same county (%) - Asian
Geographical mobility - Moved within same county (%) - Hispanic or Latino
Geographical mobility - Moved within same county (%) - American Indian and Alaska Native
Geographical mobility - Moved within same county (%) - Multirace
Geographical mobility - Moved within same county (%) - Other Race
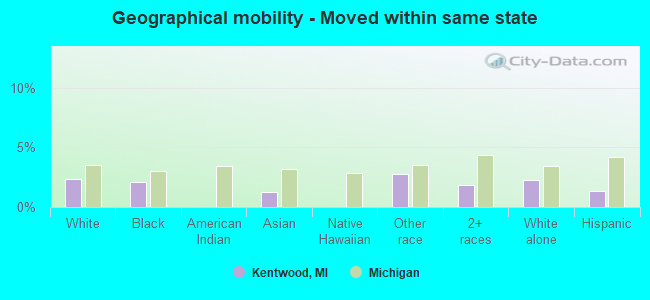
Geographical mobility - Moved from different county within same state (%)
Geographical mobility - Moved from different county within same state (%) - White
Geographical mobility - Moved from different county within same state (%) - Black or African American
Geographical mobility - Moved from different county within same state (%) - Asian
Geographical mobility - Moved from different county within same state (%) - Hispanic or Latino
Geographical mobility - Moved from different county within same state (%) - American Indian and Alaska Native
Geographical mobility - Moved from different county within same state (%) - Multirace
Geographical mobility - Moved from different county within same state (%) - Other Race
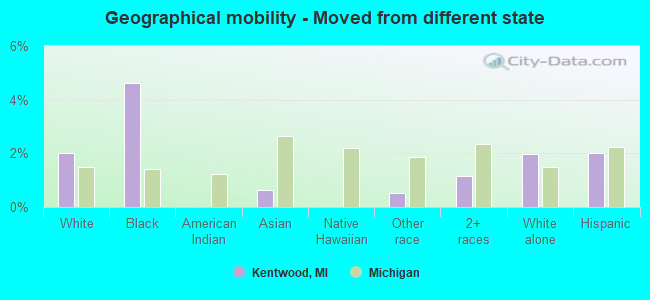
Geographical mobility - Moved from different state (%)
Geographical mobility - Moved from different state (%) - White
Geographical mobility - Moved from different state (%) - Black or African American
Geographical mobility - Moved from different state (%) - Asian
Geographical mobility - Moved from different state (%) - Hispanic or Latino
Geographical mobility - Moved from different state (%) - American Indian and Alaska Native
Geographical mobility - Moved from different state (%) - Multirace
Geographical mobility - Moved from different state (%) - Other Race
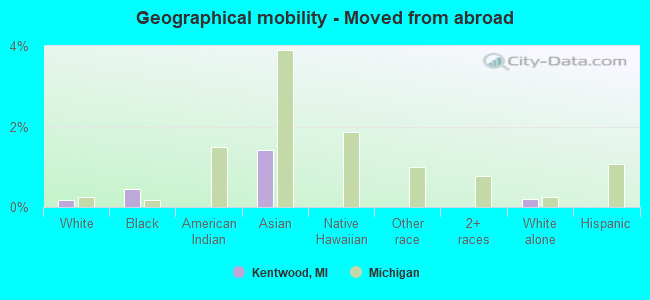
Geographical mobility - Moved from abroad (%)
Geographical mobility - Moved from abroad (%) - White
Geographical mobility - Moved from abroad (%) - Black or African American
Geographical mobility - Moved from abroad (%) - Asian
Geographical mobility - Moved from abroad (%) - Hispanic or Latino
Geographical mobility - Moved from abroad (%) - American Indian and Alaska Native
Geographical mobility - Moved from abroad (%) - Multirace
Geographical mobility - Moved from abroad (%) - Other Race
Place of birth for the foreign-born population - Ireland (%)
Place of birth for the foreign-born population - Denmark (%)
Place of birth for the foreign-born population - Norway (%)
Place of birth for the foreign-born population - Sweden (%)
Place of birth for the foreign-born population - United Kingdom (%)
Place of birth for the foreign-born population - England (%)
Place of birth for the foreign-born population - Scotland (%)
Place of birth for the foreign-born population - Other Northern Europe (%)
Place of birth for the foreign-born population - Austria (%)
Place of birth for the foreign-born population - Belgium (%)
Place of birth for the foreign-born population - France (%)
Place of birth for the foreign-born population - Germany (%)
Place of birth for the foreign-born population - Netherlands (%)
Place of birth for the foreign-born population - Switzerland (%)
Place of birth for the foreign-born population - Other Western Europe (%)
Place of birth for the foreign-born population - Greece (%)
Place of birth for the foreign-born population - Italy (%)
Place of birth for the foreign-born population - Portugal (%)
Place of birth for the foreign-born population - Spain (%)
Place of birth for the foreign-born population - Other Southern Europe (%)
Place of birth for the foreign-born population - Albania (%)
Place of birth for the foreign-born population - Belarus (%)
Place of birth for the foreign-born population - Bosnia and Herzegovina (%)
Place of birth for the foreign-born population - Bulgaria (%)
Place of birth for the foreign-born population - Croatia (%)
Place of birth for the foreign-born population - Czechoslovakia (%)
Place of birth for the foreign-born population - Hungary (%)
Place of birth for the foreign-born population - Latvia (%)
Place of birth for the foreign-born population - Lithuania (%)
Place of birth for the foreign-born population - North Macedonia (Macedonia) (%)
Place of birth for the foreign-born population - Moldova (%)
Place of birth for the foreign-born population - Poland (%)
Place of birth for the foreign-born population - Romania (%)
Place of birth for the foreign-born population - Russia (%)
Place of birth for the foreign-born population - Serbia (%)
Place of birth for the foreign-born population - Ukraine (%)
Place of birth for the foreign-born population - Other Eastern Europe (%)
Place of birth for the foreign-born population - China (%)
Place of birth for the foreign-born population - Hong Kong (%)
Place of birth for the foreign-born population - Taiwan (%)
Place of birth for the foreign-born population - Japan (%)
Place of birth for the foreign-born population - Korea (%)
Place of birth for the foreign-born population - Other Eastern Asia (%)
Place of birth for the foreign-born population - Afghanistan (%)
Place of birth for the foreign-born population - Bangladesh (%)
Place of birth for the foreign-born population - India (%)
Place of birth for the foreign-born population - Iran (%)
Place of birth for the foreign-born population - Kazakhstan (%)
Place of birth for the foreign-born population - Nepal (%)
Place of birth for the foreign-born population - Pakistan (%)
Place of birth for the foreign-born population - Sri Lanka (%)
Place of birth for the foreign-born population - Uzbekistan (%)
Place of birth for the foreign-born population - Other South Central Asia (%)
Place of birth for the foreign-born population - Burma (%)
Place of birth for the foreign-born population - Cambodia (%)
Place of birth for the foreign-born population - Indonesia (%)
Place of birth for the foreign-born population - Laos (%)
Place of birth for the foreign-born population - Malaysia (%)
Place of birth for the foreign-born population - Philippines (%)
Place of birth for the foreign-born population - Singapore (%)
Place of birth for the foreign-born population - Thailand (%)
Place of birth for the foreign-born population - Vietnam (%)
Place of birth for the foreign-born population - Other South Eastern Asia (%)
Place of birth for the foreign-born population - Armenia (%)
Place of birth for the foreign-born population - Iraq (%)
Place of birth for the foreign-born population - Israel (%)
Place of birth for the foreign-born population - Jordan (%)
Place of birth for the foreign-born population - Kuwait (%)
Place of birth for the foreign-born population - Lebanon (%)
Place of birth for the foreign-born population - Saudi Arabia (%)
Place of birth for the foreign-born population - Syria (%)
Place of birth for the foreign-born population - Turkey (%)
Place of birth for the foreign-born population - Yemen (%)
Place of birth for the foreign-born population - Other Western Asia (%)
Place of birth for the foreign-born population - Eritrea (%)
Place of birth for the foreign-born population - Ethiopia (%)
Place of birth for the foreign-born population - Kenya (%)
Place of birth for the foreign-born population - Somalia (%)
Place of birth for the foreign-born population - Uganda (%)
Place of birth for the foreign-born population - Zimbabwe (%)
Place of birth for the foreign-born population - Other Eastern Africa (%)
Place of birth for the foreign-born population - Cameroon (%)
Place of birth for the foreign-born population - Congo (%)
Place of birth for the foreign-born population - Democratic Republic of Congo (Zaire) (%)
Place of birth for the foreign-born population - Other Middle Africa (%)
Place of birth for the foreign-born population - Egypt (%)
Place of birth for the foreign-born population - Morocco (%)
Place of birth for the foreign-born population - Sudan (%)
Place of birth for the foreign-born population - Other Northern Africa (%)
Place of birth for the foreign-born population - South Africa (%)
Place of birth for the foreign-born population - Other Southern Africa (%)
Place of birth for the foreign-born population - Cabo Verde (%)
Place of birth for the foreign-born population - Ghana (%)
Place of birth for the foreign-born population - Liberia (%)
Place of birth for the foreign-born population - Nigeria (%)
Place of birth for the foreign-born population - Senegal (%)
Place of birth for the foreign-born population - Sierra Leone (%)
Place of birth for the foreign-born population - Other Western Africa (%)
Place of birth for the foreign-born population - Australia (%)
Place of birth for the foreign-born population - New Zealand (%)
Place of birth for the foreign-born population - Fiji (%)
Place of birth for the foreign-born population - Micronesia (%)
Place of birth for the foreign-born population - Bahamas (%)
Place of birth for the foreign-born population - Barbados (%)
Place of birth for the foreign-born population - Cuba (%)
Place of birth for the foreign-born population - Dominica (%)
Place of birth for the foreign-born population - Dominican Republic (%)
Place of birth for the foreign-born population - Grenada (%)
Place of birth for the foreign-born population - Haiti (%)
Place of birth for the foreign-born population - Jamaica (%)
Place of birth for the foreign-born population - St. Vincent and the Grenadines (%)
Place of birth for the foreign-born population - Trinidad and Tobago (%)
Place of birth for the foreign-born population - West Indies (%)
Place of birth for the foreign-born population - Other Caribbean (%)
Place of birth for the foreign-born population - Belize (%)
Place of birth for the foreign-born population - Costa Rica (%)
Place of birth for the foreign-born population - El Salvador (%)
Place of birth for the foreign-born population - Guatemala (%)
Place of birth for the foreign-born population - Honduras (%)
Place of birth for the foreign-born population - Mexico (%)
Place of birth for the foreign-born population - Nicaragua (%)
Place of birth for the foreign-born population - Panama (%)
Place of birth for the foreign-born population - Other Central America (%)
Place of birth for the foreign-born population - Argentina (%)
Place of birth for the foreign-born population - Bolivia (%)
Place of birth for the foreign-born population - Brazil (%)
Place of birth for the foreign-born population - Chile (%)
Place of birth for the foreign-born population - Colombia (%)
Place of birth for the foreign-born population - Ecuador (%)
Place of birth for the foreign-born population - Guyana (%)
Place of birth for the foreign-born population - Peru (%)
Place of birth for the foreign-born population - Uruguay (%)
Place of birth for the foreign-born population - Venezuela (%)
Place of birth for the foreign-born population - Other South America (%)
Place of birth for the foreign-born population - Canada (%)
Place of birth for the foreign-born population - Other Northern America (%)
Place of birth for the foreign-born population - Other (%)
Latest news about races in Kentwood, MI collected exclusively by city-data.com from local newspapers, TV, and radio stations
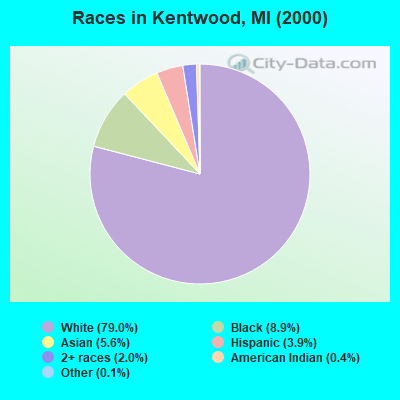
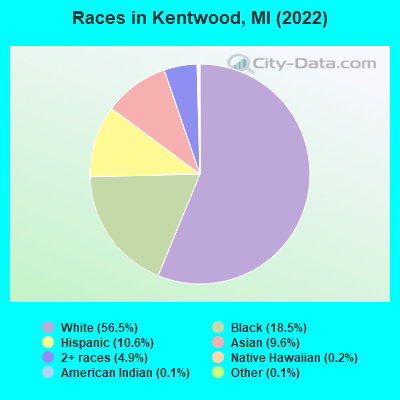
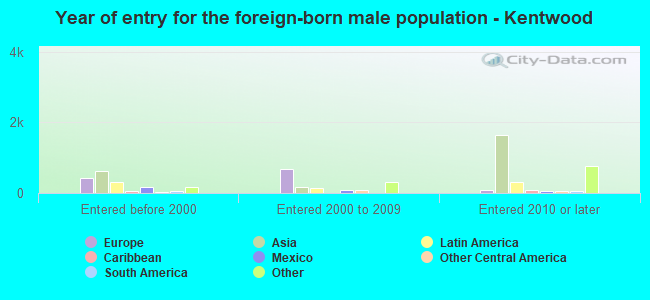
According to 2022 data, the most numerous races in Kentwood, MI are White alone (30,633 residents), Black alone (10,018 residents), and Hispanic (5,734 residents). 76.8% of Kentwood residents speak English at home. 18.3% of Kentwood, MI residents are foreign-born (8.0% born in Asia, 4.2% born in Africa, 3.5% born in Europe, 2.5% born in Latin America), which is 67.1% greater than the foreign-born rate of 6.0% across the entire state of Michigan.
Race distribution in Kentwood
2000 2022
7,806,691 78.6% White alone 1,402,047 14.1% Black alone 323,877 3.3% Hispanic 175,311 1.8% Asian alone 163,487 1.6% Two or more races 53,421 0.5% American Indian alone 11,465 0.1% Other race alone 2,145 0.02% Native Hawaiian and Other
7,289,051 72.6% White alone 1,310,464 13.1% Black alone 572,405 5.7% Hispanic 450,031 4.5% Two or more races 335,732 3.3% Asian alone 45,217 0.5% Other race alone 29,011 0.3% American Indian alone 2,207 0.02% Native Hawaiian and Other
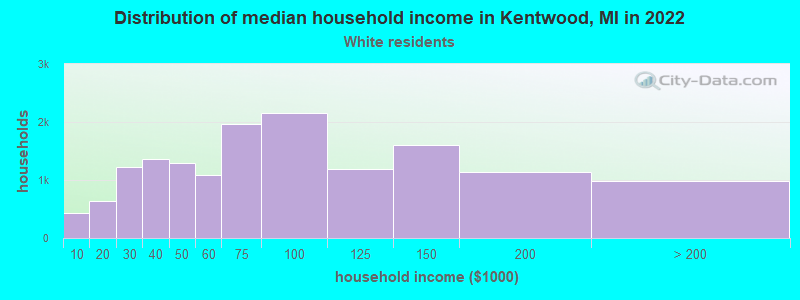
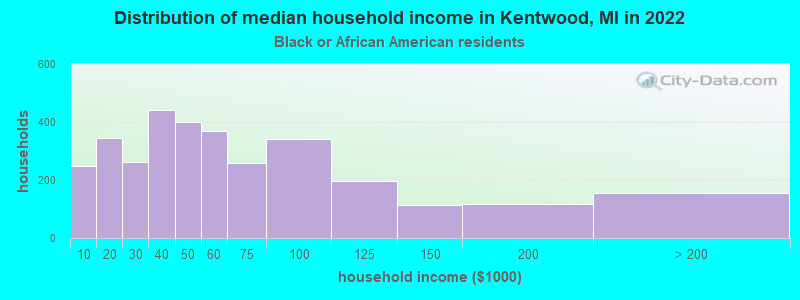
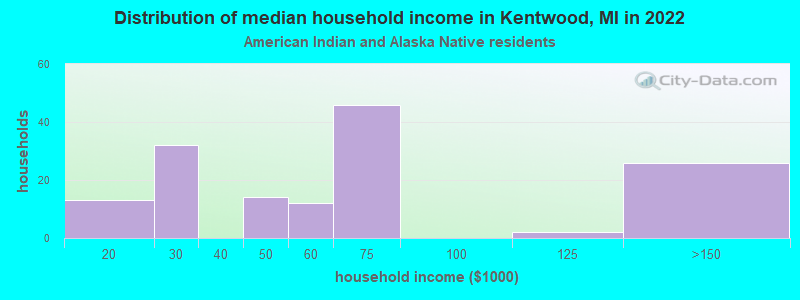
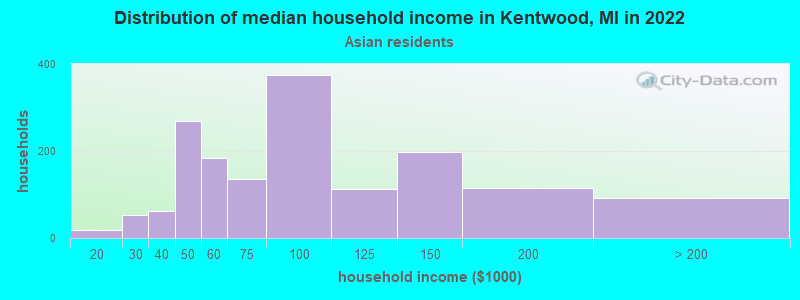
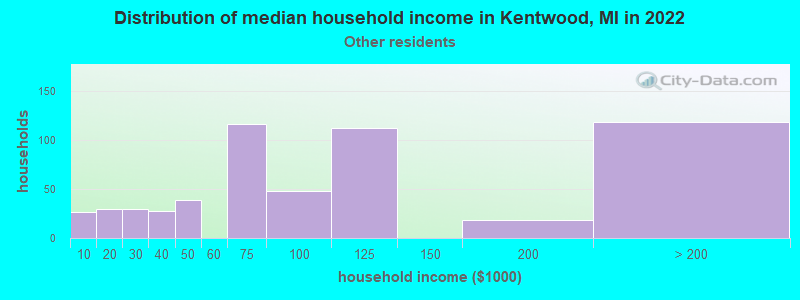
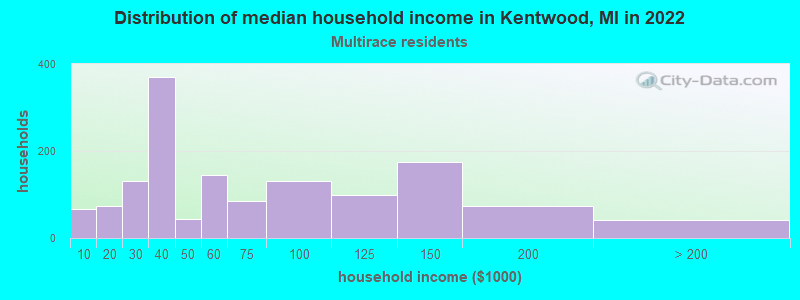
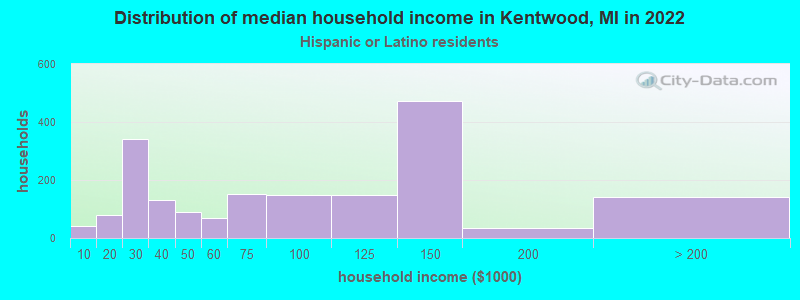
Income and house value in Kentwood Median household income in 2022 $71,359 White non-Hispanic householders$46,015 Black householders$53,555 American Indian and Alaska Native householders$76,133 Asian householders$83,559 Some other race householders$59,456 Two or more races householders$69,924 Hispanic or Latino race householdersMedian 2022 house value $276,036 White Non-Hispanic householders$313,719 Black or African American householders$313,719 American Indian or Alaska Native householders $304,010 Asian householders$265,864 Some other race householders$236,041 Two or more races householders$282,509 Hispanic or Latino householders
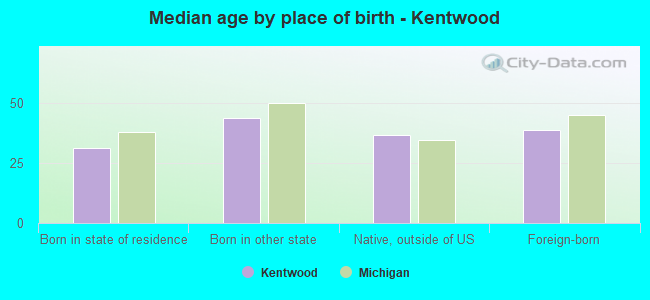
Median age by race in Kentwood
41.1 Median age for White residents39.7 42.6 26.5 Median age for Black or African American residents26.6 29.1 28.9 Median age for American Indian / Alaska Native residents28.6 36.4 33.1 Median age for Asian residents30.9 34.4 -670,531,400.3 Median age for Native Hawaiian / Pacific Islander residents-674,772,035.8 -699,588,476.7 36.9 Median age for Other race residents35.0 29.6 17.0 Median age for Two or more races residents17.5 16.2 41.9 Median age for White alone residents40.5 43.7 24.9 Median age for Hispanic or Latino residents25.1 24.8
Owner/renter occupied households by race in Kentwood
House owners and renters - White residents 9,448 62.1% Owner occupied5,757 37.9% Renter occupiedHouse owners and renters - Black or African American residents 1,216 37.3% Owner occupied2,040 62.7% Renter occupiedHouse owners and renters - American Indian / Alaska Native residents 60 38.0% Owner occupied98 62.0% Renter occupiedHouse owners and renters - Asian residents 1,148 69.2% Owner occupied512 30.8% Renter occupiedHouse owners and renters - Native Hawaiian / Pacific Islander residents 28 100.0% Owner occupiedHouse owners and renters - Other race residents 141 40.1% Owner occupied211 59.9% Renter occupiedHouse owners and renters - Two or more races residents 859 63.8% Owner occupied487 36.2% Renter occupiedHouse owners and renters - White alone residents 9,150 62.9% Owner occupied5,390 37.1% Renter occupiedHouse owners and renters - Hispanic or Latino residents 965 54.1% Owner occupied819 45.9% Renter occupied
Language usage in Kentwood
English speakers - Total 76.8% of residents of Kentwood speak English at home.
4.2% of residents speak Spanish at home 1,362 64.2% Speak English very well760 35.8% Speak English less than very well20.6% of residents speak other language at home 4,122 39.5% Speak English very well6,309 60.5% Speak English less than very well
English speakers - Born in the United States 92.5% of residents of Kentwood speak English at home.
3.7% of residents speak Spanish at home 235 80.2% Speak English very well58 19.8% Speak English less than very well2.9% of residents speak other language at home 116 51.1% Speak English very well111 48.9% Speak English less than very well
English speakers - Native, born elsewhere 75.4% of residents of Kentwood speak English at home.
20.1% of residents speak Spanish at home 106 83.5% Speak English very well21 16.5% Speak English less than very well6.6% of residents speak other language at home 42 100.0% Speak English very well
English speakers - Foreign-born 13.2% of residents of Kentwood speak English at home.
10.3% of residents speak Spanish at home 501 47.9% Speak English very well546 52.1% Speak English less than very well77.3% of residents speak other language at home 2,540 32.4% Speak English very well5,308 67.6% Speak English less than very well
White (Caucasian) - Speak only English Native:
96.5% (27,134)Foreign-born:
18.0% (421)
White (Caucasian) - Speak another language Native:
3.4% (968)Foreign-born:
81.4% (1,906)
Black or African American - Speak only English Native:
87.5% (6,377)Foreign-born:
12.0% (229)
Black or African American - Speak another language Native:
14.7% (1,068)Foreign-born:
89.6% (1,712)
American Indian / Alaska Native - Speak another language Native:
80.1% (115)Foreign-born:
100.0% (31)
Asian - Speak only English Native:
39.0% (275)Foreign-born:
7.8% (331)
Asian - Speak another language Native:
61.2% (431)Foreign-born:
92.1% (3,907)
Other race - Speak only English Native:
73.3% (453)Foreign-born:
27.1% (88)
Other race - Speak another language Native:
33.5% (207)Foreign-born:
73.8% (239)
Two or more races - Speak only English Native:
86.1% (3,331)Foreign-born:
26.2% (205)
Two or more races - Speak another language Native:
11.8% (456)Foreign-born:
73.8% (577)
White alone - Speak only English Native:
97.5% (26,171)Foreign-born:
14.9% (359)
White alone - Speak another language Native:
2.6% (707)Foreign-born:
89.6% (2,150)
Hispanic or Latino - Speak only English Native:
75.7% (3,058)Foreign-born:
21.7% (282)
Hispanic or Latino - Speak another language Native:
26.6% (1,073)Foreign-born:
78.9% (1,022)
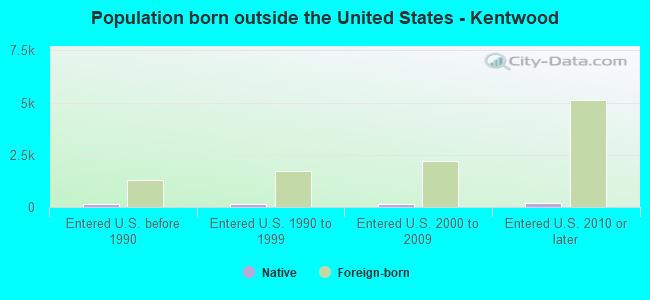
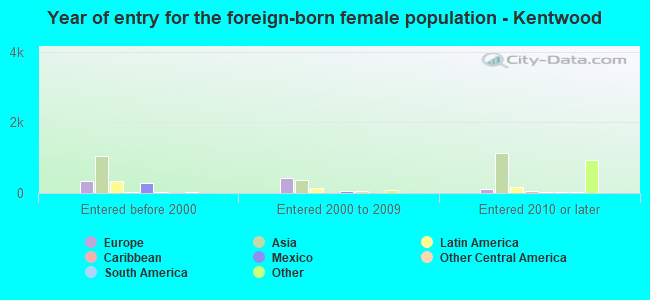
Foreign-born residents in Kentwood 9,896 residents are foreign born (8.0% Asia , 4.2% Africa , 3.5% Europe , 2.5% Latin America ).
This city:
18.3%Michigan:
6.9%
Marital status for residents in Kentwood Marital status - White (Caucasian) population 15 years and over
Males 34.3% Never married53.5% Now married0.6% Separated2.6% Widowed9.0% DivorcedFemales 28.0% Never married47.6% Now married0.6% Separated8.5% Widowed15.3% DivorcedWomen who gave birth in the past 12 months Now married:
81.0% (340)Unmarried:
19.0% (80)
Women who did not give birth in the past 12 months Now married:
44.8% (3,225)Unmarried:
55.2% (3,976)
Marital status - Black or African American population 15 years and over
Males 46.9% Never married39.9% Now married1.7% Separated1.5% Widowed10.0% DivorcedFemales 49.2% Never married25.8% Now married0.6% Separated3.1% Widowed21.3% DivorcedWomen who gave birth in the past 12 months Now married:
46.1% (111)Unmarried:
53.9% (130)
Women who did not give birth in the past 12 months Now married:
25.4% (655)Unmarried:
74.6% (1,926)
Marital status - American Indian / Alaska Native population 15 years and over
Males 68.7% Never married2.4% Now married0.0% Separated0.0% Widowed28.9% DivorcedFemales 20.8% Never married35.4% Now married0.0% Separated2.1% Widowed41.7% DivorcedWomen who did not give birth in the past 12 months Now married:
42.5% (18)Unmarried:
57.5% (24)
Marital status - Asian population 15 years and over
Males 43.2% Never married50.2% Now married0.0% Separated1.7% Widowed5.0% DivorcedFemales 29.2% Never married55.7% Now married0.0% Separated0.4% Widowed14.7% DivorcedWomen who gave birth in the past 12 months Now married:
75.9% (112)Unmarried:
24.1% (36)
Women who did not give birth in the past 12 months Now married:
43.0% (534)Unmarried:
57.0% (710)
Marital status - Other race population 15 years and over
Males 37.7% Never married34.2% Now married5.2% Separated0.0% Widowed22.9% DivorcedFemales 35.0% Never married43.6% Now married0.0% Separated17.4% Widowed3.9% DivorcedWomen who gave birth in the past 12 months Now married:
100.0% (25)Unmarried:
0.0% (0)
Women who did not give birth in the past 12 months Now married:
74.4% (103)Unmarried:
25.6% (35)
Marital status - Two or more races population 15 years and over
Males 50.7% Never married44.0% Now married0.0% Separated0.0% Widowed5.3% DivorcedFemales 46.1% Never married38.2% Now married0.1% Separated3.1% Widowed12.5% DivorcedWomen who gave birth in the past 12 months Now married:
29.4% (20)Unmarried:
70.6% (48)
Women who did not give birth in the past 12 months Now married:
36.5% (354)Unmarried:
63.5% (617)
Marital status - White alone, not Hispanic / Latino population 15 years and over
Males 33.3% Never married54.3% Now married0.7% Separated2.7% Widowed9.0% DivorcedFemales 27.1% Never married47.5% Now married0.7% Separated8.9% Widowed15.9% DivorcedWomen who gave birth in the past 12 months Now married:
80.0% (324)Unmarried:
20.0% (81)
Women who did not give birth in the past 12 months Now married:
44.3% (2,958)Unmarried:
55.7% (3,717)
Marital status - Hispanic or Latino population 15 years and over
Males 41.9% Never married40.9% Now married1.7% Separated0.0% Widowed15.5% DivorcedFemales 38.8% Never married46.7% Now married0.0% Separated7.0% Widowed7.5% DivorcedWomen who gave birth in the past 12 months Now married:
100.0% (54)Unmarried:
0.0% (0)
Women who did not give birth in the past 12 months Now married:
51.4% (637)Unmarried:
48.6% (603)
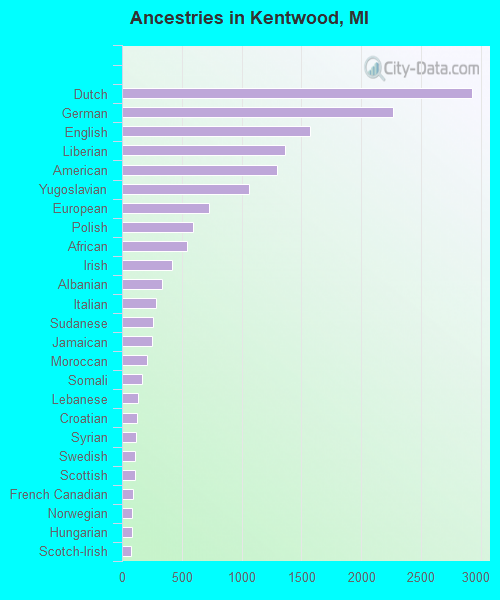
Ancestries in Kentwood
2,924 10.8% Dutch2,271 8.4% German1,573 5.8% English1,360 5.0% Liberian1,293 4.8% American1,062 3.9% Yugoslavian731 2.7% European598 2.2% Polish546 2.0% African416 1.5% Irish338 1.2% Albanian287 1.1% Italian260 1.0% Sudanese248 0.9% Jamaican206 0.8% Moroccan166 0.6% Somali132 0.5% Lebanese124 0.5% Croatian117 0.4% Syrian110 0.4% Swedish109 0.4% Scottish91 0.3% French Canadian83 0.3% Norwegian80 0.3% Hungarian76 0.3% Scotch-Irish69 0.3% Ethiopian66 0.2% Arab65 0.2% Haitian53 0.2% Ukrainian51 0.2% Palestinian50 0.2% Canadian48 0.2% Scandinavian47 0.2% Danish46 0.2% Kenyan38 0.1% Latvian37 0.1% Eastern European31 0.1% Belgian30 0.1% French28 0.1% Iraqi26 0.10% Maltese25 0.09% Russian23 0.08% Pennsylvania German23 0.08% Swiss21 0.08% Dutch West Indian19 0.07% Lithuanian17 0.06% Welsh17 0.06% Austrian17 0.06% Egyptian14 0.05% Northern European14 0.05% Brazilian10 0.04% Czechoslovakian10 0.04% Slovene5 0.02% British5 0.02% Israeli3 0.01% Slavic3 0.01% Slovak
Geographical mobility in Kentwood Same house 1 year ago 27,696 87.1% White (Caucasian)7,594 74.3% Black or African American95 49.6% American Indian / Alaska Native4,509 88.9% Asian52 100.0% Native Hawaiian / Pacific Islander898 90.9% Other race4,466 83.2% Two or more races26,452 87.1% White alone, not Hispanic / Latino4,763 83.8% Hispanic or LatinoMoved within same county 2,675 8.4% White / Caucasian1,901 18.6% Black or African American81 42.7% American Indian / Alaska Native424 8.4% Asian56 5.7% Other race709 13.2% Two or more races2,595 8.5% White alone, not Hispanic / Latino715 12.6% Hispanic or LatinoMoved within same state 743 2.3% White / Caucasian216 2.1% Black or African American65 1.3% Asian27 2.8% Other race98 1.8% Two or more races697 2.3% White alone, not Hispanic / Latino77 1.4% Hispanic or LatinoMoved from different state 642 2.0% White / Caucasian473 4.6% Black or African American32 0.6% Asian5 0.5% Other race61 1.1% Two or more races598 2.0% White alone, not Hispanic / Latino114 2.0% Hispanic or LatinoMoved from abroad 58 0.2% White46 0.4% Black or African American72 1.4% Asian58 0.2% White alone, not Hispanic / Latino
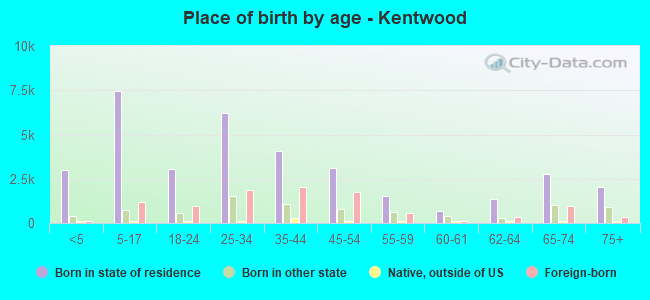
Children Nativity (place of birth) in Kentwood
Children under 6 years - Living with two parents Both parents native 1,508 100.0% NativeBoth parents foreign-born 652 92.0% Native57 8.0% Foreign-bornOne native, one foreign-born parent 374 84.0% Native71 16.0% Foreign-bornChildren under 6 years - Living with one parent Native parent 1,317 98.7% Native18 1.3% Foreign-bornForeign-born parent 225 100.0% NativeChildren 6 to 17 years - Living with two parents Both parents native 2,993 97.1% Native91 2.9% Foreign-bornBoth parents foreign-born 797 64.2% Native445 35.8% Foreign-bornOne native, one foreign-born parent 806 100.0% NativeChildren 6 to 17 years - Living with one parent Native parent 1,969 100.0% NativeForeign-born parent 636 63.5% Native366 36.5% Foreign-born
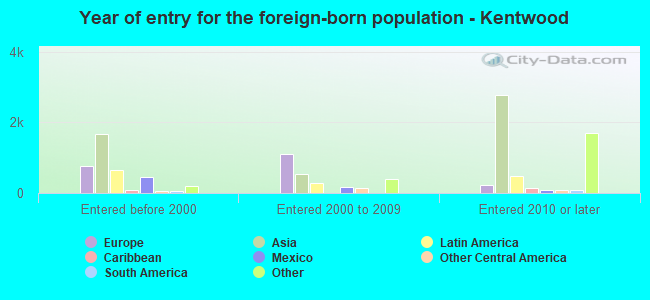
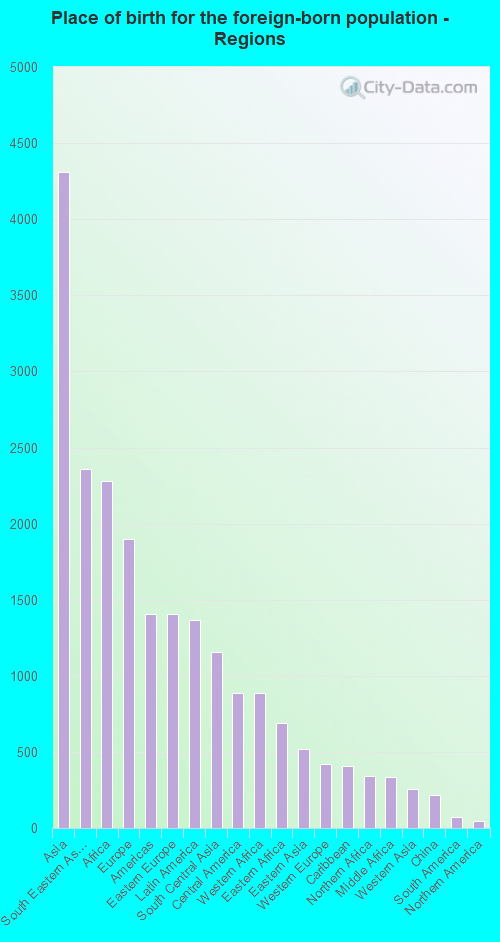
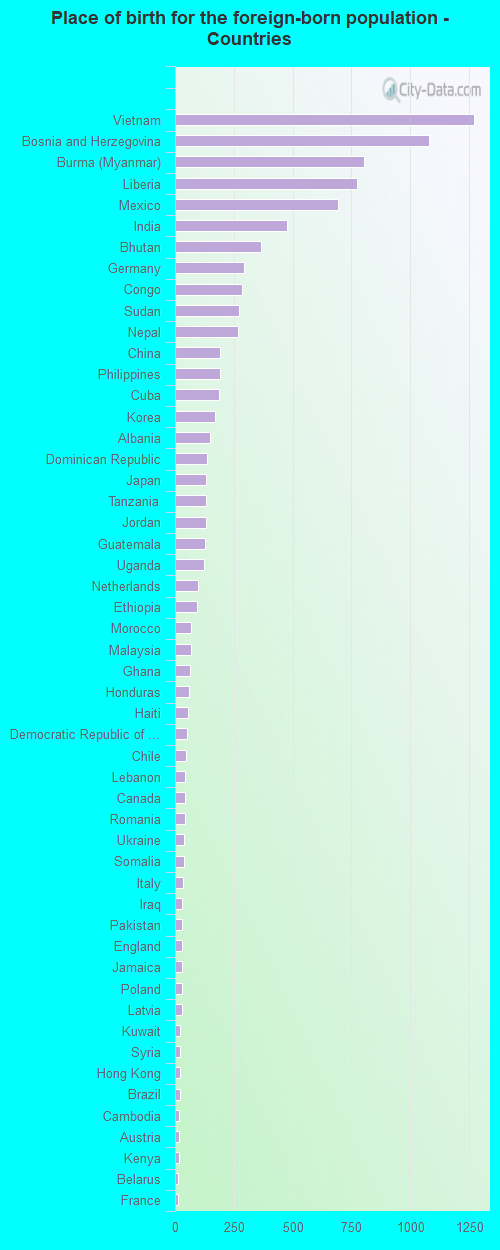
Place of birth for residents in Kentwood 4,309 Asia2,358 South Eastern Asia2,279 Africa1,899 Europe1,408 Americas1,407 Eastern Europe1,364 Latin America1,154 South Central Asia890 Central America886 Western Africa691 Eastern Africa516 Eastern Asia421 Western Europe405 Caribbean342 Northern Africa336 Middle Africa257 Western Asia214 China69 South America44 Northern America39 Northern Europe32 Southern Europe7 Southern Africa1,271 Vietnam1,078 Bosnia and Herzegovina803 Burma (Myanmar)774 Liberia693 Mexico477 India365 Bhutan293 Germany285 Congo274 Sudan269 Nepal193 China190 Philippines185 Cuba171 Korea149 Albania136 Dominican Republic131 Japan130 Tanzania130 Jordan129 Guatemala122 Uganda98 Netherlands93 Ethiopia68 Morocco67 Malaysia65 Ghana58 Honduras55 Haiti51 Democratic Republic of Congo (Zaire)48 Chile44 Lebanon44 Canada41 Romania38 Ukraine37 Somalia32 Italy29 Iraq29 Pakistan29 England29 Jamaica28 Poland28 Latvia23 Kuwait23 Syria21 Hong Kong21 Brazil19 Cambodia18 Austria16 Kenya13 Belarus12 France10 El Salvador10 Scotland8 Israel7 Indonesia7 Sri Lanka7 Kazakhstan7 South Africa5 Russia
Grandparents responsible for own grandchildren in Kentwood
Grandparents (30 to 59 years) White / Caucasian 128 44.6% Responsible for grandchildren159 55.4% Not responsible for grandchildrenBlack or African American 15 11.6% Responsible for grandchildren114 88.4% Not responsible for grandchildrenOther race 71 100.0% Not responsible for grandchildrenWhite alone, not Hispanic / Latino 101 42.1% Responsible for grandchildren139 57.9% Not responsible for grandchildrenHispanic or Latino 14 12.3% Responsible for grandchildren96 87.7% Not responsible for grandchildrenGrandparents (60 years and over) White / Caucasian 48 55.3% Responsible for grandchildren39 44.7% Not responsible for grandchildrenBlack or African American 7 28.7% Responsible for grandchildren18 71.3% Not responsible for grandchildrenOther race 70 100.0% Not responsible for grandchildrenWhite alone, not Hispanic / Latino 48 52.9% Responsible for grandchildren43 47.1% Not responsible for grandchildrenHispanic or Latino 45 100.0% Not responsible for grandchildren