Races in Keokuk, Iowa (IA) Detailed Stats
Data:
Races - White alone (%)
Races - White alone (% change since 2000)
Races - Black alone (%)
Races - Black alone (% change since 2000)
Races - American Indian alone (%)
Races - American Indian alone (% change since 2000)
Races - Asian alone (%)
Races - Asian alone (% change since 2000)
Races - Hispanic (%)
Races - Hispanic (% change since 2000)
Races - Native Hawaiian and Other Pacific Islander alone (%)
Races - Native Hawaiian and Other Pacific Islander alone (% change since 2000)
Races - Two or more races(%)
Races - Two or more races(% change since 2000)
Races - Other race alone (%)
Races - Other race alone (% change since 2000)
Racial diversity
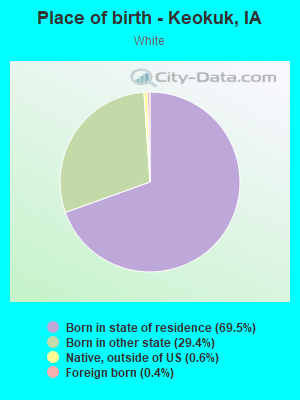
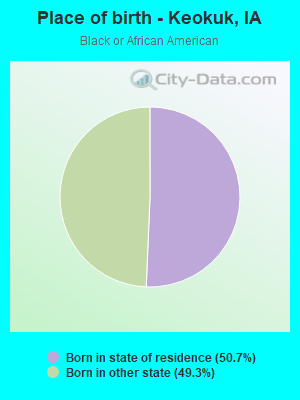
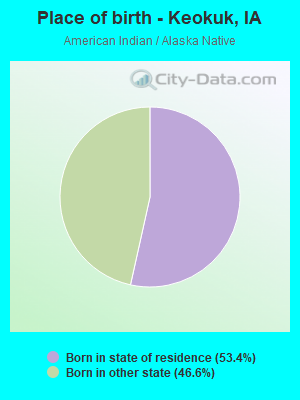
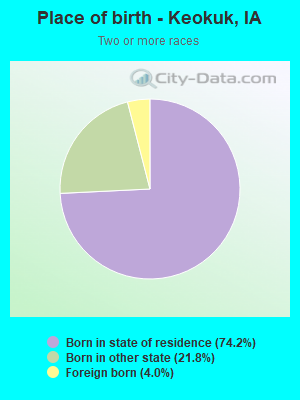
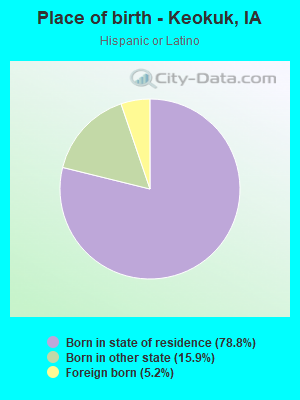
Place of birth - Born in state of residence (%)
Place of birth - Born in state of residence (%) - White
Place of birth - Born in state of residence (%) - Black or African American
Place of birth - Born in state of residence (%) - Asian
Place of birth - Born in state of residence (%) - Hispanic or Latino
Place of birth - Born in state of residence (%) - American Indian and Alaska Native
Place of birth - Born in state of residence (%) - Multirace
Place of birth - Born in state of residence (%) - Other Race
Place of birth - Born in other state (%)
Place of birth - Born in other state (%) - White
Place of birth - Born in other state (%) - Black or African American
Place of birth - Born in other state (%) - Asian
Place of birth - Born in other state (%) - Hispanic or Latino
Place of birth - Born in other state (%) - American Indian and Alaska Native
Place of birth - Born in other state (%) - Multirace
Place of birth - Born in other state (%) - Other Race
Place of birth - Native, outside of US (%)
Place of birth - Native, outside of US (%) - White
Place of birth - Native, outside of US (%) - Black or African American
Place of birth - Native, outside of US (%) - Asian
Place of birth - Native, outside of US (%) - Hispanic or Latino
Place of birth - Native, outside of US (%) - American Indian and Alaska Native
Place of birth - Native, outside of US (%) - Multirace
Place of birth - Native, outside of US (%) - Other Race
Place of birth - Foreign born (%)
Place of birth - Foreign born (%) - White
Place of birth - Foreign born (%) - Black or African American
Place of birth - Foreign born (%) - Asian
Place of birth - Foreign born (%) - Hispanic or Latino
Place of birth - Foreign born (%) - American Indian and Alaska Native
Place of birth - Foreign born (%) - Multirace
Place of birth - Foreign born (%) - Other Race
Residents speaking English at home (%)
Residents speaking English at home - Born in the United States (%)
Residents speaking English at home - Native, born elsewhere (%)
Residents speaking English at home - Foreign born (%)
Residents speaking Spanish at home (%)
Residents speaking Spanish at home - Born in the United States (%)
Residents speaking Spanish at home - Native, born elsewhere (%)
Residents speaking Spanish at home - Foreign born (%)
Residents speaking other language at home (%)
Residents speaking other language at home - Born in the United States (%)
Residents speaking other language at home - Native, born elsewhere (%)
Residents speaking other language at home - Foreign born (%)
Marital status - Never married (%)
Marital status - Now married (%)
Marital status - Separated (%)
Marital status - Widowed (%)
Marital status - Divorced (%)
Ancestries Reported - Arab (%)
Ancestries Reported - Czech (%)
Ancestries Reported - Danish (%)
Ancestries Reported - Dutch (%)
Ancestries Reported - English (%)
Ancestries Reported - French (%)
Ancestries Reported - French Canadian (%)
Ancestries Reported - German (%)
Ancestries Reported - Greek (%)
Ancestries Reported - Hungarian (%)
Ancestries Reported - Irish (%)
Ancestries Reported - Italian (%)
Ancestries Reported - Lithuanian (%)
Ancestries Reported - Norwegian (%)
Ancestries Reported - Polish (%)
Ancestries Reported - Portuguese (%)
Ancestries Reported - Russian (%)
Ancestries Reported - Scotch-Irish (%)
Ancestries Reported - Scottish (%)
Ancestries Reported - Slovak (%)
Ancestries Reported - Subsaharan African (%)
Ancestries Reported - Swedish (%)
Ancestries Reported - Swiss (%)
Ancestries Reported - Ukrainian (%)
Ancestries Reported - United States (%)
Ancestries Reported - Welsh (%)
Ancestries Reported - West Indian (%)
Ancestries Reported - Other (%)
Geographical mobility - Same house 1 year ago (%)
Geographical mobility - Same house 1 year ago (%) - White
Geographical mobility - Same house 1 year ago (%) - Black or African American
Geographical mobility - Same house 1 year ago (%) - Asian
Geographical mobility - Same house 1 year ago (%) - Hispanic or Latino
Geographical mobility - Same house 1 year ago (%) - American Indian and Alaska Native
Geographical mobility - Same house 1 year ago (%) - Multirace
Geographical mobility - Same house 1 year ago (%) - Other Race
Geographical mobility - Moved within same county (%)
Geographical mobility - Moved within same county (%) - White
Geographical mobility - Moved within same county (%) - Black or African American
Geographical mobility - Moved within same county (%) - Asian
Geographical mobility - Moved within same county (%) - Hispanic or Latino
Geographical mobility - Moved within same county (%) - American Indian and Alaska Native
Geographical mobility - Moved within same county (%) - Multirace
Geographical mobility - Moved within same county (%) - Other Race
Geographical mobility - Moved from different county within same state (%)
Geographical mobility - Moved from different county within same state (%) - White
Geographical mobility - Moved from different county within same state (%) - Black or African American
Geographical mobility - Moved from different county within same state (%) - Asian
Geographical mobility - Moved from different county within same state (%) - Hispanic or Latino
Geographical mobility - Moved from different county within same state (%) - American Indian and Alaska Native
Geographical mobility - Moved from different county within same state (%) - Multirace
Geographical mobility - Moved from different county within same state (%) - Other Race
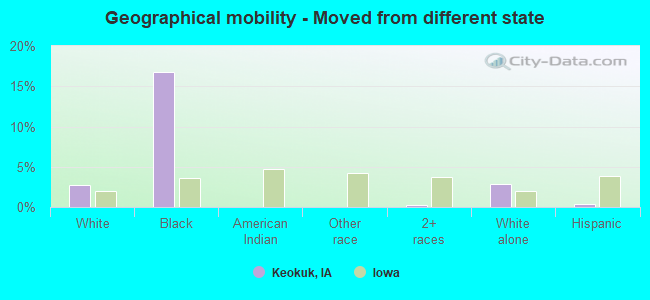
Geographical mobility - Moved from different state (%)
Geographical mobility - Moved from different state (%) - White
Geographical mobility - Moved from different state (%) - Black or African American
Geographical mobility - Moved from different state (%) - Asian
Geographical mobility - Moved from different state (%) - Hispanic or Latino
Geographical mobility - Moved from different state (%) - American Indian and Alaska Native
Geographical mobility - Moved from different state (%) - Multirace
Geographical mobility - Moved from different state (%) - Other Race
Geographical mobility - Moved from abroad (%)
Geographical mobility - Moved from abroad (%) - White
Geographical mobility - Moved from abroad (%) - Black or African American
Geographical mobility - Moved from abroad (%) - Asian
Geographical mobility - Moved from abroad (%) - Hispanic or Latino
Geographical mobility - Moved from abroad (%) - American Indian and Alaska Native
Geographical mobility - Moved from abroad (%) - Multirace
Geographical mobility - Moved from abroad (%) - Other Race
Place of birth for the foreign-born population - Ireland (%)
Place of birth for the foreign-born population - Denmark (%)
Place of birth for the foreign-born population - Norway (%)
Place of birth for the foreign-born population - Sweden (%)
Place of birth for the foreign-born population - United Kingdom (%)
Place of birth for the foreign-born population - England (%)
Place of birth for the foreign-born population - Scotland (%)
Place of birth for the foreign-born population - Other Northern Europe (%)
Place of birth for the foreign-born population - Austria (%)
Place of birth for the foreign-born population - Belgium (%)
Place of birth for the foreign-born population - France (%)
Place of birth for the foreign-born population - Germany (%)
Place of birth for the foreign-born population - Netherlands (%)
Place of birth for the foreign-born population - Switzerland (%)
Place of birth for the foreign-born population - Other Western Europe (%)
Place of birth for the foreign-born population - Greece (%)
Place of birth for the foreign-born population - Italy (%)
Place of birth for the foreign-born population - Portugal (%)
Place of birth for the foreign-born population - Spain (%)
Place of birth for the foreign-born population - Other Southern Europe (%)
Place of birth for the foreign-born population - Albania (%)
Place of birth for the foreign-born population - Belarus (%)
Place of birth for the foreign-born population - Bosnia and Herzegovina (%)
Place of birth for the foreign-born population - Bulgaria (%)
Place of birth for the foreign-born population - Croatia (%)
Place of birth for the foreign-born population - Czechoslovakia (%)
Place of birth for the foreign-born population - Hungary (%)
Place of birth for the foreign-born population - Latvia (%)
Place of birth for the foreign-born population - Lithuania (%)
Place of birth for the foreign-born population - North Macedonia (Macedonia) (%)
Place of birth for the foreign-born population - Moldova (%)
Place of birth for the foreign-born population - Poland (%)
Place of birth for the foreign-born population - Romania (%)
Place of birth for the foreign-born population - Russia (%)
Place of birth for the foreign-born population - Serbia (%)
Place of birth for the foreign-born population - Ukraine (%)
Place of birth for the foreign-born population - Other Eastern Europe (%)
Place of birth for the foreign-born population - China (%)
Place of birth for the foreign-born population - Hong Kong (%)
Place of birth for the foreign-born population - Taiwan (%)
Place of birth for the foreign-born population - Japan (%)
Place of birth for the foreign-born population - Korea (%)
Place of birth for the foreign-born population - Other Eastern Asia (%)
Place of birth for the foreign-born population - Afghanistan (%)
Place of birth for the foreign-born population - Bangladesh (%)
Place of birth for the foreign-born population - India (%)
Place of birth for the foreign-born population - Iran (%)
Place of birth for the foreign-born population - Kazakhstan (%)
Place of birth for the foreign-born population - Nepal (%)
Place of birth for the foreign-born population - Pakistan (%)
Place of birth for the foreign-born population - Sri Lanka (%)
Place of birth for the foreign-born population - Uzbekistan (%)
Place of birth for the foreign-born population - Other South Central Asia (%)
Place of birth for the foreign-born population - Burma (%)
Place of birth for the foreign-born population - Cambodia (%)
Place of birth for the foreign-born population - Indonesia (%)
Place of birth for the foreign-born population - Laos (%)
Place of birth for the foreign-born population - Malaysia (%)
Place of birth for the foreign-born population - Philippines (%)
Place of birth for the foreign-born population - Singapore (%)
Place of birth for the foreign-born population - Thailand (%)
Place of birth for the foreign-born population - Vietnam (%)
Place of birth for the foreign-born population - Other South Eastern Asia (%)
Place of birth for the foreign-born population - Armenia (%)
Place of birth for the foreign-born population - Iraq (%)
Place of birth for the foreign-born population - Israel (%)
Place of birth for the foreign-born population - Jordan (%)
Place of birth for the foreign-born population - Kuwait (%)
Place of birth for the foreign-born population - Lebanon (%)
Place of birth for the foreign-born population - Saudi Arabia (%)
Place of birth for the foreign-born population - Syria (%)
Place of birth for the foreign-born population - Turkey (%)
Place of birth for the foreign-born population - Yemen (%)
Place of birth for the foreign-born population - Other Western Asia (%)
Place of birth for the foreign-born population - Eritrea (%)
Place of birth for the foreign-born population - Ethiopia (%)
Place of birth for the foreign-born population - Kenya (%)
Place of birth for the foreign-born population - Somalia (%)
Place of birth for the foreign-born population - Uganda (%)
Place of birth for the foreign-born population - Zimbabwe (%)
Place of birth for the foreign-born population - Other Eastern Africa (%)
Place of birth for the foreign-born population - Cameroon (%)
Place of birth for the foreign-born population - Congo (%)
Place of birth for the foreign-born population - Democratic Republic of Congo (Zaire) (%)
Place of birth for the foreign-born population - Other Middle Africa (%)
Place of birth for the foreign-born population - Egypt (%)
Place of birth for the foreign-born population - Morocco (%)
Place of birth for the foreign-born population - Sudan (%)
Place of birth for the foreign-born population - Other Northern Africa (%)
Place of birth for the foreign-born population - South Africa (%)
Place of birth for the foreign-born population - Other Southern Africa (%)
Place of birth for the foreign-born population - Cabo Verde (%)
Place of birth for the foreign-born population - Ghana (%)
Place of birth for the foreign-born population - Liberia (%)
Place of birth for the foreign-born population - Nigeria (%)
Place of birth for the foreign-born population - Senegal (%)
Place of birth for the foreign-born population - Sierra Leone (%)
Place of birth for the foreign-born population - Other Western Africa (%)
Place of birth for the foreign-born population - Australia (%)
Place of birth for the foreign-born population - New Zealand (%)
Place of birth for the foreign-born population - Fiji (%)
Place of birth for the foreign-born population - Micronesia (%)
Place of birth for the foreign-born population - Bahamas (%)
Place of birth for the foreign-born population - Barbados (%)
Place of birth for the foreign-born population - Cuba (%)
Place of birth for the foreign-born population - Dominica (%)
Place of birth for the foreign-born population - Dominican Republic (%)
Place of birth for the foreign-born population - Grenada (%)
Place of birth for the foreign-born population - Haiti (%)
Place of birth for the foreign-born population - Jamaica (%)
Place of birth for the foreign-born population - St. Vincent and the Grenadines (%)
Place of birth for the foreign-born population - Trinidad and Tobago (%)
Place of birth for the foreign-born population - West Indies (%)
Place of birth for the foreign-born population - Other Caribbean (%)
Place of birth for the foreign-born population - Belize (%)
Place of birth for the foreign-born population - Costa Rica (%)
Place of birth for the foreign-born population - El Salvador (%)
Place of birth for the foreign-born population - Guatemala (%)
Place of birth for the foreign-born population - Honduras (%)
Place of birth for the foreign-born population - Mexico (%)
Place of birth for the foreign-born population - Nicaragua (%)
Place of birth for the foreign-born population - Panama (%)
Place of birth for the foreign-born population - Other Central America (%)
Place of birth for the foreign-born population - Argentina (%)
Place of birth for the foreign-born population - Bolivia (%)
Place of birth for the foreign-born population - Brazil (%)
Place of birth for the foreign-born population - Chile (%)
Place of birth for the foreign-born population - Colombia (%)
Place of birth for the foreign-born population - Ecuador (%)
Place of birth for the foreign-born population - Guyana (%)
Place of birth for the foreign-born population - Peru (%)
Place of birth for the foreign-born population - Uruguay (%)
Place of birth for the foreign-born population - Venezuela (%)
Place of birth for the foreign-born population - Other South America (%)
Place of birth for the foreign-born population - Canada (%)
Place of birth for the foreign-born population - Other Northern America (%)
Place of birth for the foreign-born population - Other (%)
Latest news about races in Keokuk, IA collected exclusively by city-data.com from local newspapers, TV, and radio stations
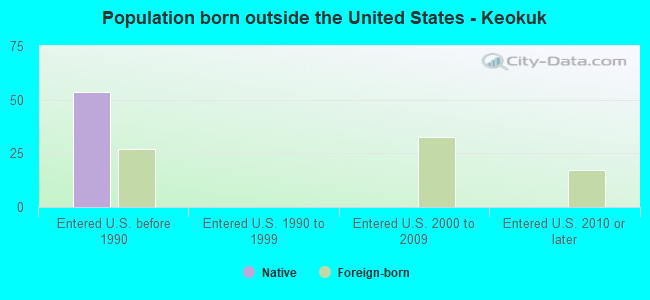
According to 2022 data, the most numerous races in Keokuk, IA are White alone (8,493 residents), Hispanic (485 residents), and Black alone (439 residents). 98.3% of Keokuk residents speak English at home. 0.8% of Keokuk, IA residents are foreign-born , which is 534.9% less than the foreign-born rate of 5.0% across the entire state of Iowa.
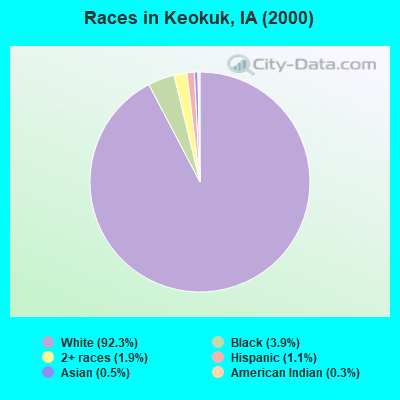
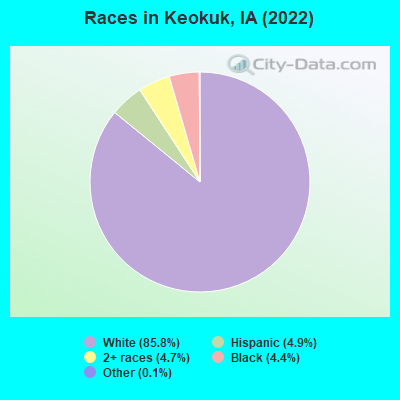
Race distribution in Keokuk
2000 2022
2,710,344 92.6% White alone 82,473 2.8% Hispanic 60,744 2.1% Black alone 36,345 1.2% Asian alone 25,472 0.9% Two or more races 7,955 0.3% American Indian alone 2,103 0.07% Other race alone 888 0.03% Native Hawaiian and Other
2,650,110 82.8% White alone 218,024 6.8% Hispanic 119,004 3.7% Black alone 115,286 3.6% Two or more races 74,892 2.3% Asian alone 9,260 0.3% Other race alone 8,595 0.3% Native Hawaiian and Other 5,346 0.2% American Indian alone
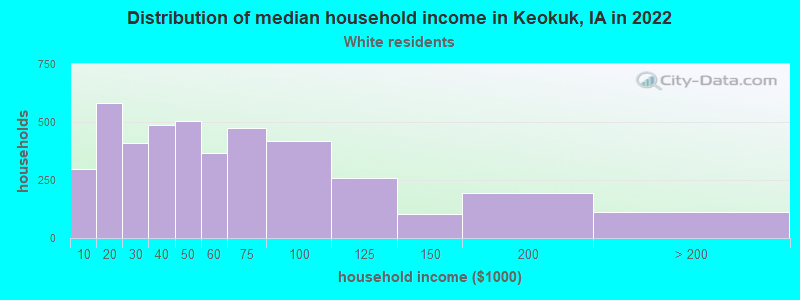
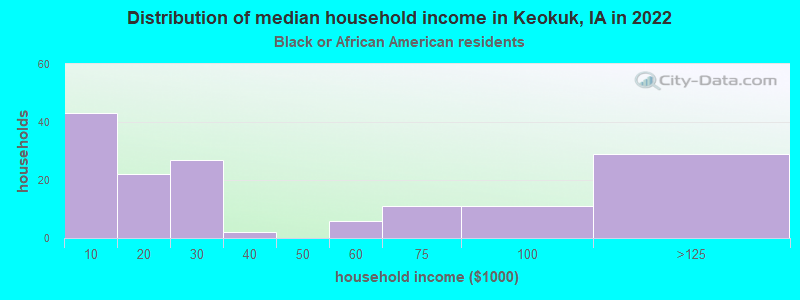
Income and house value in Keokuk Median household income in 2022 $47,214 White non-Hispanic householders$47,615 Two or more races householdersMedian 2022 house value $96,614 White Non-Hispanic householders$50,391 Black or African American householders$142,080 American Indian or Alaska Native householders $151,552 Asian householders$23,680 Two or more races householders$161,024 Hispanic or Latino householders
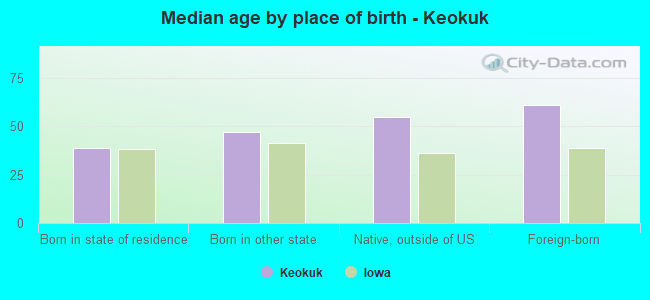
Median age by race in Keokuk
44.8 Median age for White residents45.2 44.1 27.6 Median age for Black or African American residents26.4 31.0 -660,397,073.5 Median age for American Indian / Alaska Native residents-654,282,765.1 -670,912,950.5 -719,077,567.4 Median age for Asian residents-729,641,693.1 -711,656,441.0 -580,729,166.1 Median age for Native Hawaiian / Pacific Islander residents-776,978,416.5 -504,347,825.6 28.2 Median age for Other race residents-678,486,997.0 -664,399,092.3 23.5 Median age for Two or more races residents18.8 25.8 44.8 Median age for White alone residents45.0 44.8 21.0 Median age for Hispanic or Latino residents26.2 21.6
Owner/renter occupied households by race in Keokuk
House owners and renters - White residents 2,639 63.0% Owner occupied1,547 37.0% Renter occupiedHouse owners and renters - Black or African American residents 71 44.0% Owner occupied91 56.0% Renter occupiedHouse owners and renters - American Indian / Alaska Native residents 7 100.0% Owner occupiedHouse owners and renters - Two or more races residents 80 64.4% Owner occupied44 35.6% Renter occupiedHouse owners and renters - White alone residents 2,639 62.5% Owner occupied1,581 37.5% Renter occupiedHouse owners and renters - Hispanic or Latino residents 30 91.1% Owner occupied3 8.9% Renter occupied
Language usage in Keokuk
English speakers - Total 98.3% of residents of Keokuk speak English at home.
1.4% of residents speak Spanish at home 109 84.5% Speak English very well20 15.5% Speak English less than very well0.1% of residents speak other language at home 10 100.0% Speak English very well
English speakers - Born in the United States 98.2% of residents of Keokuk speak English at home.
2.1% of residents speak Spanish at home 38 62.3% Speak English very well23 37.7% Speak English less than very well
All residents speak only English at home
English speakers - Foreign-born 67.1% of residents of Keokuk speak English at home.
32.9% of residents speak Spanish at home 27 100.0% Speak English very well
White (Caucasian) - Speak only English Native:
99.8% (8,075)Foreign-born:
100.0% (38)
Two or more races - Speak another language Native:
1.2% (8)Foreign-born:
97.8% (37)
White alone - Speak only English Native:
99.3% (8,015)Foreign-born:
99.1% (54)
Hispanic or Latino - Speak another language Native:
14.5% (41)Foreign-born:
100.0% (25)
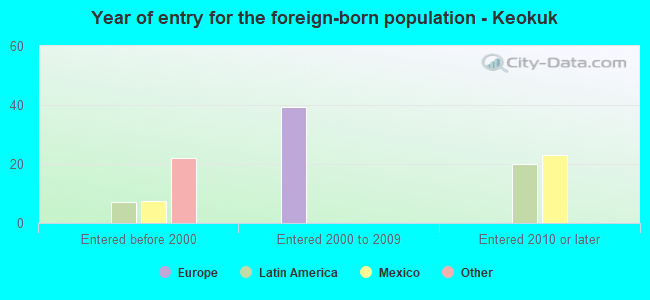
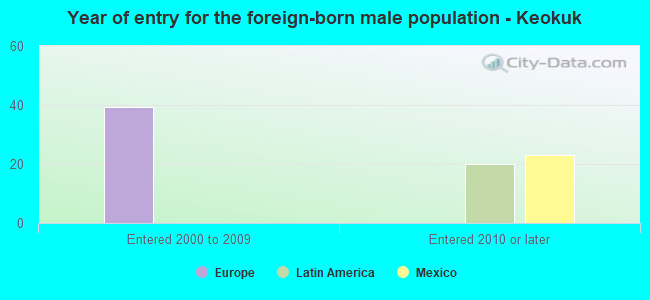
Foreign-born residents in Keokuk 78 residents are foreign born
Marital status for residents in Keokuk Marital status - White (Caucasian) population 15 years and over
Males 31.8% Never married43.4% Now married1.3% Separated3.5% Widowed20.0% DivorcedFemales 31.6% Never married36.2% Now married1.4% Separated10.9% Widowed19.9% DivorcedWomen who gave birth in the past 12 months Now married:
30.6% (66)Unmarried:
69.4% (150)
Women who did not give birth in the past 12 months Now married:
32.0% (539)Unmarried:
68.0% (1,145)
Marital status - Black or African American population 15 years and over
Males 48.6% Never married28.0% Now married11.2% Separated3.7% Widowed8.4% DivorcedFemales 64.5% Never married27.8% Now married4.1% Separated0.0% Widowed3.6% DivorcedWomen who gave birth in the past 12 months Now married:
0.0% (0)Unmarried:
100.0% (18)
Women who did not give birth in the past 12 months Now married:
10.8% (9)Unmarried:
89.2% (72)
Marital status - American Indian / Alaska Native population 15 years and over
Males 100.0% Never married0.0% Now married0.0% Separated0.0% Widowed0.0% DivorcedFemales 0.0% Never married100.0% Now married0.0% Separated0.0% Widowed0.0% DivorcedMarital status - Two or more races population 15 years and over
Males 75.9% Never married19.6% Now married0.0% Separated0.0% Widowed4.5% DivorcedFemales 72.5% Never married17.1% Now married0.0% Separated2.3% Widowed8.1% DivorcedWomen who gave birth in the past 12 months Now married:
0.0% (0)Unmarried:
100.0% (181)
Women who did not give birth in the past 12 months Now married:
20.0% (27)Unmarried:
80.0% (107)
Marital status - White alone, not Hispanic / Latino population 15 years and over
Males 31.2% Never married43.8% Now married1.4% Separated3.5% Widowed20.1% DivorcedFemales 30.7% Never married36.7% Now married1.4% Separated11.1% Widowed20.2% DivorcedWomen who gave birth in the past 12 months Now married:
40.5% (67)Unmarried:
59.5% (99)
Women who did not give birth in the past 12 months Now married:
32.0% (547)Unmarried:
68.0% (1,164)
Marital status - Hispanic or Latino population 15 years and over
Males 59.7% Never married36.1% Now married0.0% Separated0.0% Widowed4.2% DivorcedFemales 93.5% Never married6.0% Now married0.0% Separated0.0% Widowed0.5% DivorcedWomen who gave birth in the past 12 months Now married:
0.0% (0)Unmarried:
100.0% (188)
Women who did not give birth in the past 12 months Now married:
23.1% (10)Unmarried:
76.9% (33)
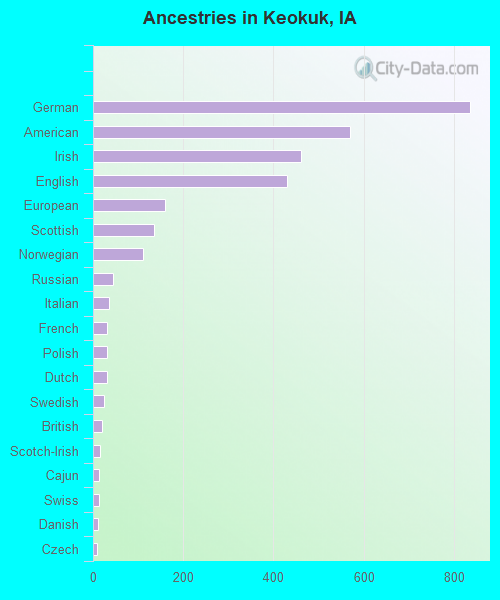
Ancestries in Keokuk
836 21.5% German569 14.6% American461 11.9% Irish431 11.1% English159 4.1% European135 3.5% Scottish111 2.9% Norwegian45 1.2% Russian35 0.9% Italian31 0.8% French31 0.8% Polish30 0.8% Dutch24 0.6% Swedish20 0.5% British15 0.4% Scotch-Irish14 0.4% Cajun14 0.4% Swiss12 0.3% Danish9 0.2% Czech7 0.2% Hungarian7 0.2% African5 0.1% Eastern European5 0.1% Welsh3 0.08% Northern European
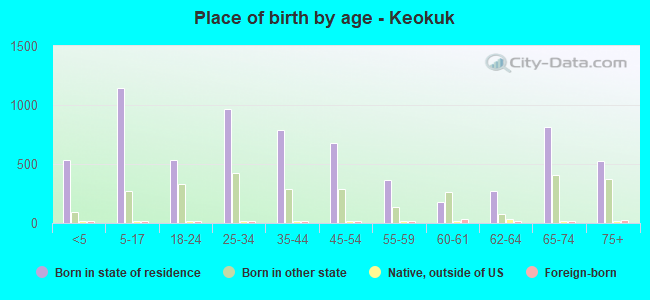
Children Nativity (place of birth) in Keokuk
Children under 6 years - Living with two parents Both parents native 224 100.0% NativeChildren under 6 years - Living with one parent Native parent 402 100.0% Native
Children 6 to 17 years - Living with two parents Both parents native 483 100.0% NativeChildren 6 to 17 years - Living with one parent Native parent 637 97.1% Native19 2.9% Foreign-bornForeign-born parent 16 100.0% Native
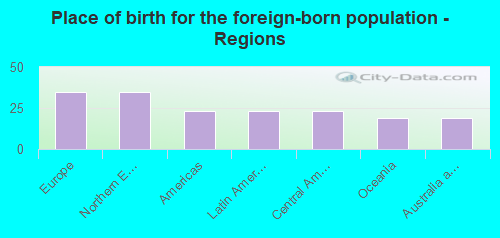
Place of birth for residents in Keokuk 35 Europe35 Northern Europe23 Americas23 Latin America23 Central America19 Oceania19 Australia and New Zealand Subregion
Grandparents responsible for own grandchildren in Keokuk
Grandparents (30 to 59 years) White / Caucasian 27 56.8% Responsible for grandchildren20 43.2% Not responsible for grandchildrenWhite alone, not Hispanic / Latino 27 53.7% Responsible for grandchildren23 46.3% Not responsible for grandchildrenGrandparents (60 years and over) White / Caucasian 26 33.2% Responsible for grandchildren53 66.8% Not responsible for grandchildrenWhite alone, not Hispanic / Latino 27 32.3% Responsible for grandchildren56 67.7% Not responsible for grandchildren