Races in Kerrville, Texas (TX) Detailed Stats
Data:
Races - White alone (%)
Races - White alone (% change since 2000)
Races - Black alone (%)
Races - Black alone (% change since 2000)
Races - American Indian alone (%)
Races - American Indian alone (% change since 2000)
Races - Asian alone (%)
Races - Asian alone (% change since 2000)
Races - Hispanic (%)
Races - Hispanic (% change since 2000)
Races - Native Hawaiian and Other Pacific Islander alone (%)
Races - Native Hawaiian and Other Pacific Islander alone (% change since 2000)
Races - Two or more races(%)
Races - Two or more races(% change since 2000)
Races - Other race alone (%)
Races - Other race alone (% change since 2000)
Racial diversity
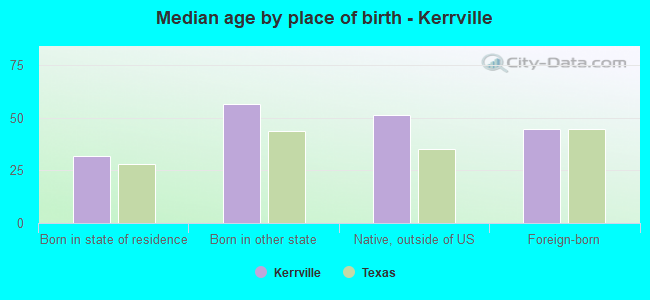
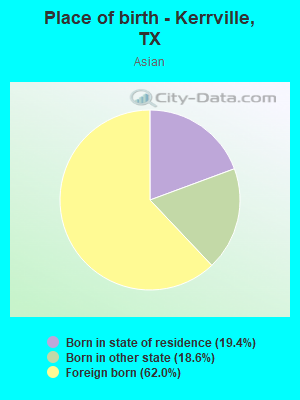
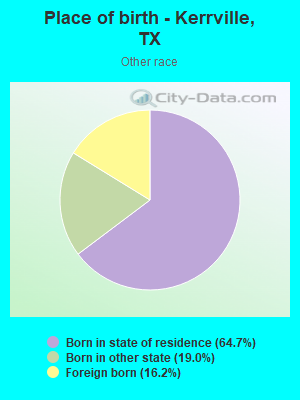
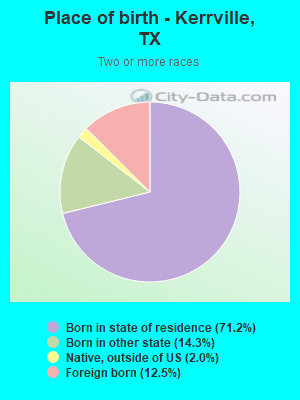
Place of birth - Born in state of residence (%)
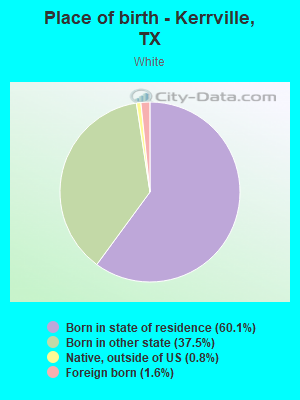
Place of birth - Born in state of residence (%) - White
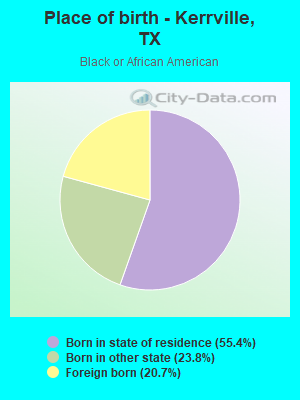
Place of birth - Born in state of residence (%) - Black or African American
Place of birth - Born in state of residence (%) - Asian
Place of birth - Born in state of residence (%) - Hispanic or Latino
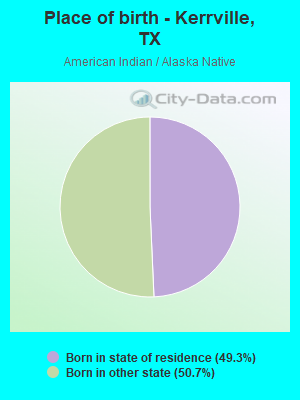
Place of birth - Born in state of residence (%) - American Indian and Alaska Native
Place of birth - Born in state of residence (%) - Multirace
Place of birth - Born in state of residence (%) - Other Race
Place of birth - Born in other state (%)
Place of birth - Born in other state (%) - White
Place of birth - Born in other state (%) - Black or African American
Place of birth - Born in other state (%) - Asian
Place of birth - Born in other state (%) - Hispanic or Latino
Place of birth - Born in other state (%) - American Indian and Alaska Native
Place of birth - Born in other state (%) - Multirace
Place of birth - Born in other state (%) - Other Race
Place of birth - Native, outside of US (%)
Place of birth - Native, outside of US (%) - White
Place of birth - Native, outside of US (%) - Black or African American
Place of birth - Native, outside of US (%) - Asian
Place of birth - Native, outside of US (%) - Hispanic or Latino
Place of birth - Native, outside of US (%) - American Indian and Alaska Native
Place of birth - Native, outside of US (%) - Multirace
Place of birth - Native, outside of US (%) - Other Race
Place of birth - Foreign born (%)
Place of birth - Foreign born (%) - White
Place of birth - Foreign born (%) - Black or African American
Place of birth - Foreign born (%) - Asian
Place of birth - Foreign born (%) - Hispanic or Latino
Place of birth - Foreign born (%) - American Indian and Alaska Native
Place of birth - Foreign born (%) - Multirace
Place of birth - Foreign born (%) - Other Race
Residents speaking English at home (%)
Residents speaking English at home - Born in the United States (%)
Residents speaking English at home - Native, born elsewhere (%)
Residents speaking English at home - Foreign born (%)
Residents speaking Spanish at home (%)
Residents speaking Spanish at home - Born in the United States (%)
Residents speaking Spanish at home - Native, born elsewhere (%)
Residents speaking Spanish at home - Foreign born (%)
Residents speaking other language at home (%)
Residents speaking other language at home - Born in the United States (%)
Residents speaking other language at home - Native, born elsewhere (%)
Residents speaking other language at home - Foreign born (%)
Marital status - Never married (%)
Marital status - Now married (%)
Marital status - Separated (%)
Marital status - Widowed (%)
Marital status - Divorced (%)
Ancestries Reported - Arab (%)
Ancestries Reported - Czech (%)
Ancestries Reported - Danish (%)
Ancestries Reported - Dutch (%)
Ancestries Reported - English (%)
Ancestries Reported - French (%)
Ancestries Reported - French Canadian (%)
Ancestries Reported - German (%)
Ancestries Reported - Greek (%)
Ancestries Reported - Hungarian (%)
Ancestries Reported - Irish (%)
Ancestries Reported - Italian (%)
Ancestries Reported - Lithuanian (%)
Ancestries Reported - Norwegian (%)
Ancestries Reported - Polish (%)
Ancestries Reported - Portuguese (%)
Ancestries Reported - Russian (%)
Ancestries Reported - Scotch-Irish (%)
Ancestries Reported - Scottish (%)
Ancestries Reported - Slovak (%)
Ancestries Reported - Subsaharan African (%)
Ancestries Reported - Swedish (%)
Ancestries Reported - Swiss (%)
Ancestries Reported - Ukrainian (%)
Ancestries Reported - United States (%)
Ancestries Reported - Welsh (%)
Ancestries Reported - West Indian (%)
Ancestries Reported - Other (%)
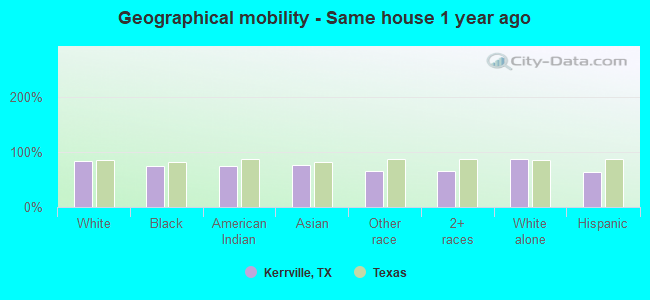
Geographical mobility - Same house 1 year ago (%)
Geographical mobility - Same house 1 year ago (%) - White
Geographical mobility - Same house 1 year ago (%) - Black or African American
Geographical mobility - Same house 1 year ago (%) - Asian
Geographical mobility - Same house 1 year ago (%) - Hispanic or Latino
Geographical mobility - Same house 1 year ago (%) - American Indian and Alaska Native
Geographical mobility - Same house 1 year ago (%) - Multirace
Geographical mobility - Same house 1 year ago (%) - Other Race
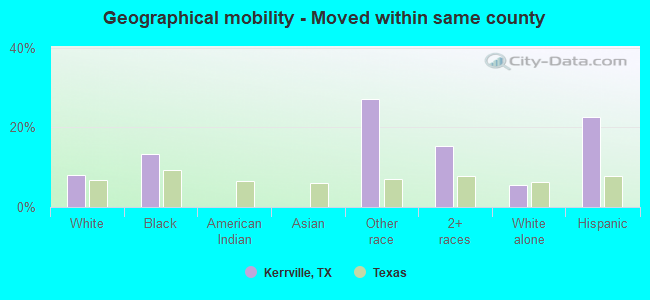
Geographical mobility - Moved within same county (%)
Geographical mobility - Moved within same county (%) - White
Geographical mobility - Moved within same county (%) - Black or African American
Geographical mobility - Moved within same county (%) - Asian
Geographical mobility - Moved within same county (%) - Hispanic or Latino
Geographical mobility - Moved within same county (%) - American Indian and Alaska Native
Geographical mobility - Moved within same county (%) - Multirace
Geographical mobility - Moved within same county (%) - Other Race
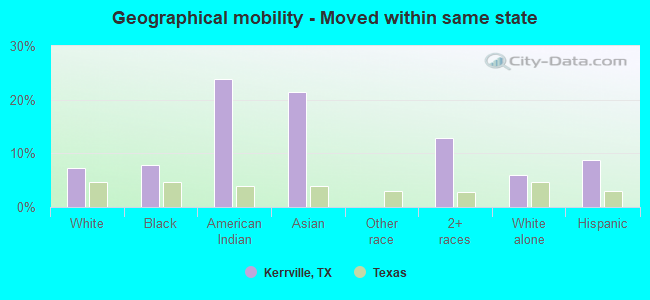
Geographical mobility - Moved from different county within same state (%)
Geographical mobility - Moved from different county within same state (%) - White
Geographical mobility - Moved from different county within same state (%) - Black or African American
Geographical mobility - Moved from different county within same state (%) - Asian
Geographical mobility - Moved from different county within same state (%) - Hispanic or Latino
Geographical mobility - Moved from different county within same state (%) - American Indian and Alaska Native
Geographical mobility - Moved from different county within same state (%) - Multirace
Geographical mobility - Moved from different county within same state (%) - Other Race
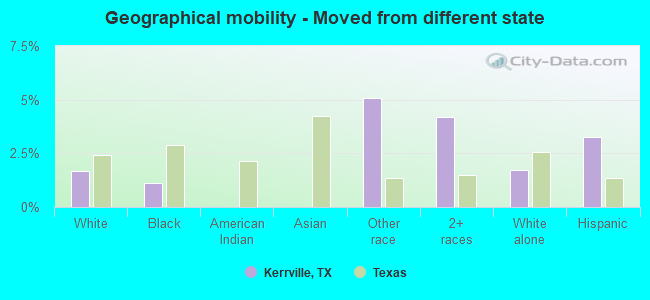
Geographical mobility - Moved from different state (%)
Geographical mobility - Moved from different state (%) - White
Geographical mobility - Moved from different state (%) - Black or African American
Geographical mobility - Moved from different state (%) - Asian
Geographical mobility - Moved from different state (%) - Hispanic or Latino
Geographical mobility - Moved from different state (%) - American Indian and Alaska Native
Geographical mobility - Moved from different state (%) - Multirace
Geographical mobility - Moved from different state (%) - Other Race
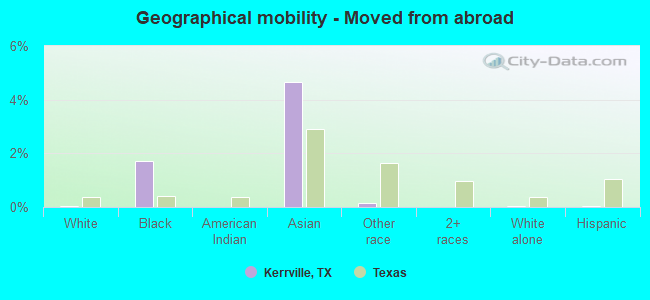
Geographical mobility - Moved from abroad (%)
Geographical mobility - Moved from abroad (%) - White
Geographical mobility - Moved from abroad (%) - Black or African American
Geographical mobility - Moved from abroad (%) - Asian
Geographical mobility - Moved from abroad (%) - Hispanic or Latino
Geographical mobility - Moved from abroad (%) - American Indian and Alaska Native
Geographical mobility - Moved from abroad (%) - Multirace
Geographical mobility - Moved from abroad (%) - Other Race
Place of birth for the foreign-born population - Ireland (%)
Place of birth for the foreign-born population - Denmark (%)
Place of birth for the foreign-born population - Norway (%)
Place of birth for the foreign-born population - Sweden (%)
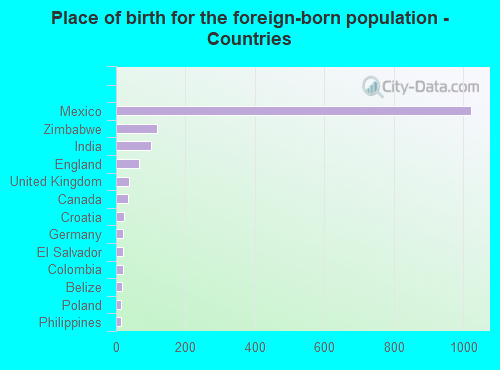
Place of birth for the foreign-born population - United Kingdom (%)
Place of birth for the foreign-born population - England (%)
Place of birth for the foreign-born population - Scotland (%)
Place of birth for the foreign-born population - Other Northern Europe (%)
Place of birth for the foreign-born population - Austria (%)
Place of birth for the foreign-born population - Belgium (%)
Place of birth for the foreign-born population - France (%)
Place of birth for the foreign-born population - Germany (%)
Place of birth for the foreign-born population - Netherlands (%)
Place of birth for the foreign-born population - Switzerland (%)
Place of birth for the foreign-born population - Other Western Europe (%)
Place of birth for the foreign-born population - Greece (%)
Place of birth for the foreign-born population - Italy (%)
Place of birth for the foreign-born population - Portugal (%)
Place of birth for the foreign-born population - Spain (%)
Place of birth for the foreign-born population - Other Southern Europe (%)
Place of birth for the foreign-born population - Albania (%)
Place of birth for the foreign-born population - Belarus (%)
Place of birth for the foreign-born population - Bosnia and Herzegovina (%)
Place of birth for the foreign-born population - Bulgaria (%)
Place of birth for the foreign-born population - Croatia (%)
Place of birth for the foreign-born population - Czechoslovakia (%)
Place of birth for the foreign-born population - Hungary (%)
Place of birth for the foreign-born population - Latvia (%)
Place of birth for the foreign-born population - Lithuania (%)
Place of birth for the foreign-born population - North Macedonia (Macedonia) (%)
Place of birth for the foreign-born population - Moldova (%)
Place of birth for the foreign-born population - Poland (%)
Place of birth for the foreign-born population - Romania (%)
Place of birth for the foreign-born population - Russia (%)
Place of birth for the foreign-born population - Serbia (%)
Place of birth for the foreign-born population - Ukraine (%)
Place of birth for the foreign-born population - Other Eastern Europe (%)
Place of birth for the foreign-born population - China (%)
Place of birth for the foreign-born population - Hong Kong (%)
Place of birth for the foreign-born population - Taiwan (%)
Place of birth for the foreign-born population - Japan (%)
Place of birth for the foreign-born population - Korea (%)
Place of birth for the foreign-born population - Other Eastern Asia (%)
Place of birth for the foreign-born population - Afghanistan (%)
Place of birth for the foreign-born population - Bangladesh (%)
Place of birth for the foreign-born population - India (%)
Place of birth for the foreign-born population - Iran (%)
Place of birth for the foreign-born population - Kazakhstan (%)
Place of birth for the foreign-born population - Nepal (%)
Place of birth for the foreign-born population - Pakistan (%)
Place of birth for the foreign-born population - Sri Lanka (%)
Place of birth for the foreign-born population - Uzbekistan (%)
Place of birth for the foreign-born population - Other South Central Asia (%)
Place of birth for the foreign-born population - Burma (%)
Place of birth for the foreign-born population - Cambodia (%)
Place of birth for the foreign-born population - Indonesia (%)
Place of birth for the foreign-born population - Laos (%)
Place of birth for the foreign-born population - Malaysia (%)
Place of birth for the foreign-born population - Philippines (%)
Place of birth for the foreign-born population - Singapore (%)
Place of birth for the foreign-born population - Thailand (%)
Place of birth for the foreign-born population - Vietnam (%)
Place of birth for the foreign-born population - Other South Eastern Asia (%)
Place of birth for the foreign-born population - Armenia (%)
Place of birth for the foreign-born population - Iraq (%)
Place of birth for the foreign-born population - Israel (%)
Place of birth for the foreign-born population - Jordan (%)
Place of birth for the foreign-born population - Kuwait (%)
Place of birth for the foreign-born population - Lebanon (%)
Place of birth for the foreign-born population - Saudi Arabia (%)
Place of birth for the foreign-born population - Syria (%)
Place of birth for the foreign-born population - Turkey (%)
Place of birth for the foreign-born population - Yemen (%)
Place of birth for the foreign-born population - Other Western Asia (%)
Place of birth for the foreign-born population - Eritrea (%)
Place of birth for the foreign-born population - Ethiopia (%)
Place of birth for the foreign-born population - Kenya (%)
Place of birth for the foreign-born population - Somalia (%)
Place of birth for the foreign-born population - Uganda (%)
Place of birth for the foreign-born population - Zimbabwe (%)
Place of birth for the foreign-born population - Other Eastern Africa (%)
Place of birth for the foreign-born population - Cameroon (%)
Place of birth for the foreign-born population - Congo (%)
Place of birth for the foreign-born population - Democratic Republic of Congo (Zaire) (%)
Place of birth for the foreign-born population - Other Middle Africa (%)
Place of birth for the foreign-born population - Egypt (%)
Place of birth for the foreign-born population - Morocco (%)
Place of birth for the foreign-born population - Sudan (%)
Place of birth for the foreign-born population - Other Northern Africa (%)
Place of birth for the foreign-born population - South Africa (%)
Place of birth for the foreign-born population - Other Southern Africa (%)
Place of birth for the foreign-born population - Cabo Verde (%)
Place of birth for the foreign-born population - Ghana (%)
Place of birth for the foreign-born population - Liberia (%)
Place of birth for the foreign-born population - Nigeria (%)
Place of birth for the foreign-born population - Senegal (%)
Place of birth for the foreign-born population - Sierra Leone (%)
Place of birth for the foreign-born population - Other Western Africa (%)
Place of birth for the foreign-born population - Australia (%)
Place of birth for the foreign-born population - New Zealand (%)
Place of birth for the foreign-born population - Fiji (%)
Place of birth for the foreign-born population - Micronesia (%)
Place of birth for the foreign-born population - Bahamas (%)
Place of birth for the foreign-born population - Barbados (%)
Place of birth for the foreign-born population - Cuba (%)
Place of birth for the foreign-born population - Dominica (%)
Place of birth for the foreign-born population - Dominican Republic (%)
Place of birth for the foreign-born population - Grenada (%)
Place of birth for the foreign-born population - Haiti (%)
Place of birth for the foreign-born population - Jamaica (%)
Place of birth for the foreign-born population - St. Vincent and the Grenadines (%)
Place of birth for the foreign-born population - Trinidad and Tobago (%)
Place of birth for the foreign-born population - West Indies (%)
Place of birth for the foreign-born population - Other Caribbean (%)
Place of birth for the foreign-born population - Belize (%)
Place of birth for the foreign-born population - Costa Rica (%)
Place of birth for the foreign-born population - El Salvador (%)
Place of birth for the foreign-born population - Guatemala (%)
Place of birth for the foreign-born population - Honduras (%)
Place of birth for the foreign-born population - Mexico (%)
Place of birth for the foreign-born population - Nicaragua (%)
Place of birth for the foreign-born population - Panama (%)
Place of birth for the foreign-born population - Other Central America (%)
Place of birth for the foreign-born population - Argentina (%)
Place of birth for the foreign-born population - Bolivia (%)
Place of birth for the foreign-born population - Brazil (%)
Place of birth for the foreign-born population - Chile (%)
Place of birth for the foreign-born population - Colombia (%)
Place of birth for the foreign-born population - Ecuador (%)
Place of birth for the foreign-born population - Guyana (%)
Place of birth for the foreign-born population - Peru (%)
Place of birth for the foreign-born population - Uruguay (%)
Place of birth for the foreign-born population - Venezuela (%)
Place of birth for the foreign-born population - Other South America (%)
Place of birth for the foreign-born population - Canada (%)
Place of birth for the foreign-born population - Other Northern America (%)
Place of birth for the foreign-born population - Other (%)
Latest news about races in Kerrville, TX collected exclusively by city-data.com from local newspapers, TV, and radio stations
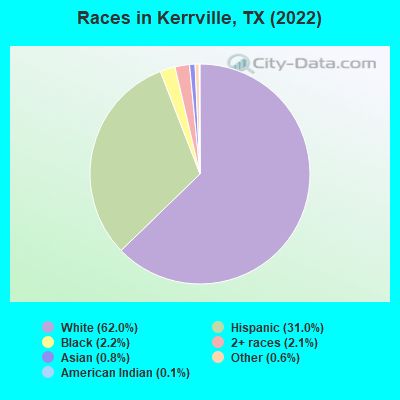
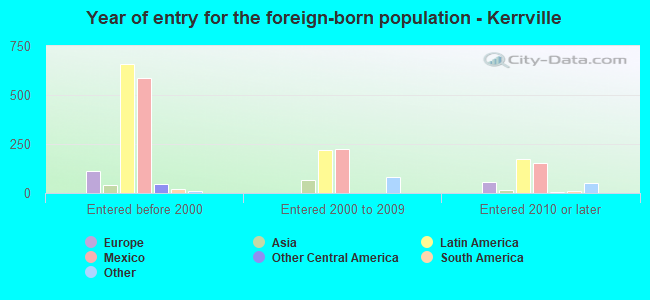
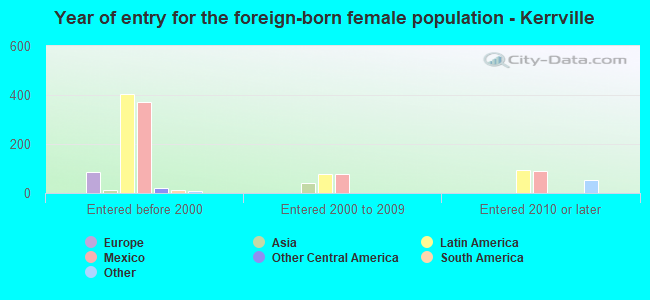
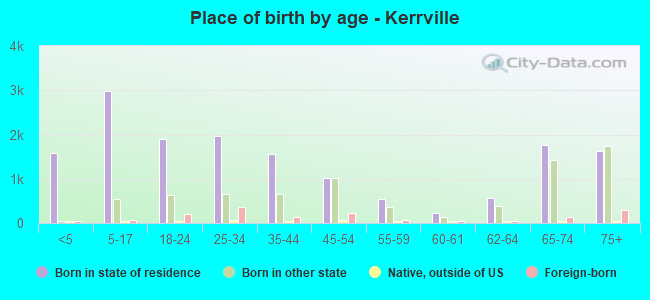
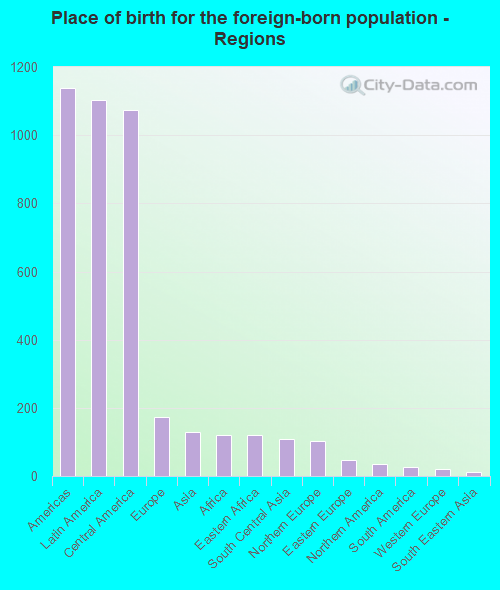
According to 2022 data, the most numerous races in Kerrville, TX are Hispanic (7,748 residents), White alone (15,484 residents), and Black alone (560 residents). 86.6% of Kerrville residents speak English at home. 6.2% of Kerrville, TX residents are foreign-born (4.4% born in Latin America, 0.7% born in Europe), which is 172.3% less than the foreign-born rate of 17.0% across the entire state of Texas.
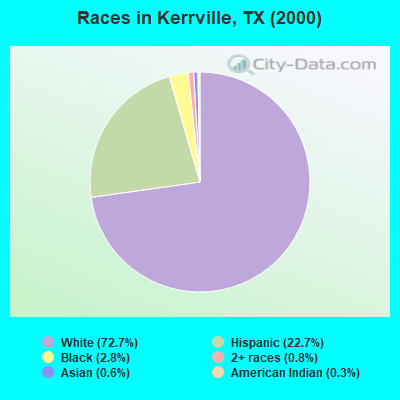
Race distribution in Kerrville
2000 2022
10,933,313 52.4% White alone 6,669,666 32.0% Hispanic 2,364,255 11.3% Black alone 554,445 2.7% Asian alone 230,567 1.1% Two or more races 68,859 0.3% American Indian alone 19,958 0.10% Other race alone 10,757 0.05% Native Hawaiian and Other
12,070,642 40.2% Hispanic 11,683,430 38.9% White alone 3,508,706 11.7% Black alone 1,608,173 5.4% Asian alone 956,560 3.2% Two or more races 125,763 0.4% Other race alone 47,023 0.2% American Indian alone 29,275 0.10% Native Hawaiian and Other
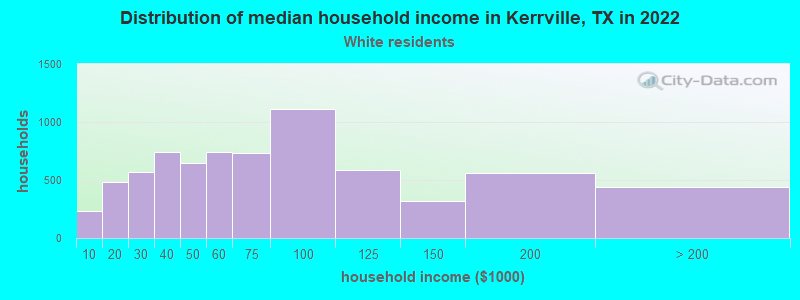
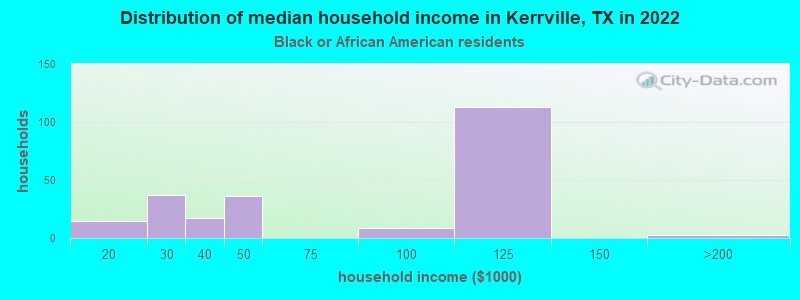
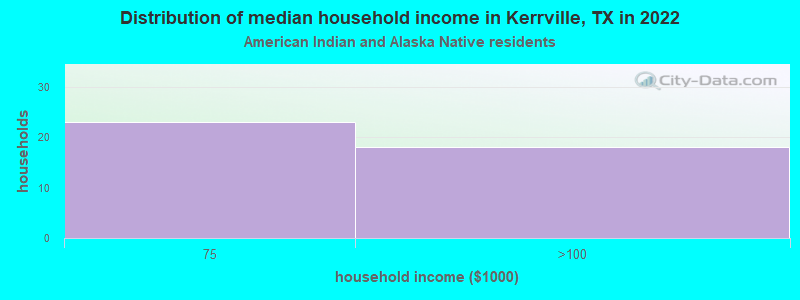
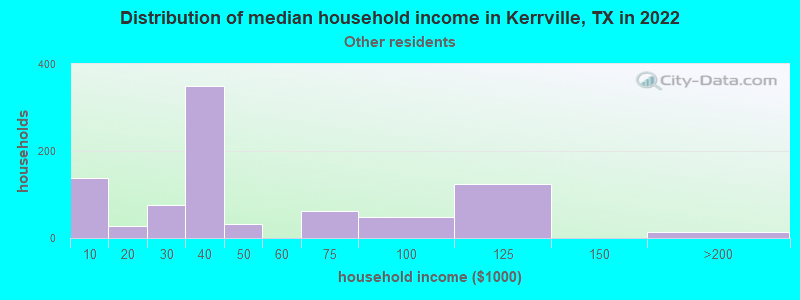
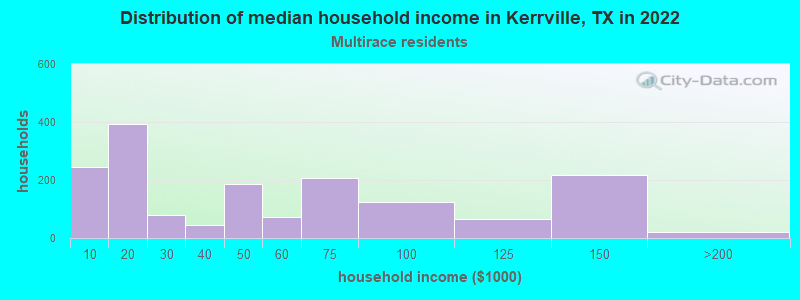
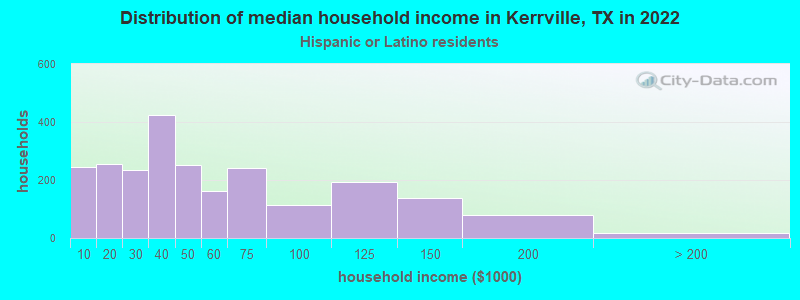
Income and house value in Kerrville Median household income in 2022 $62,105 White non-Hispanic householders$37,367 Some other race householders$44,398 Two or more races householders$41,230 Hispanic or Latino race householdersMedian 2022 house value $363,367 White Non-Hispanic householders$140,511 Black or African American householders$173,098 American Indian or Alaska Native householders$137,007 Some other race householders$186,764 Two or more races householders$161,185 Hispanic or Latino householders
Median age by race in Kerrville
48.8 Median age for White residents47.2 49.9 35.1 Median age for Black or African American residents34.7 55.6 59.1 Median age for American Indian / Alaska Native residents59.4 -684,418,145.3 22.9 Median age for Asian residents22.7 22.9 -581,560,283.1 Median age for Native Hawaiian / Pacific Islander residents-612,729,233.5 -577,777,777.2 25.3 Median age for Other race residents24.8 28.6 36.8 Median age for Two or more races residents36.6 36.7 52.2 Median age for White alone residents48.7 53.4 26.1 Median age for Hispanic or Latino residents26.5 25.0
Owner/renter occupied households by race in Kerrville
House owners and renters - White residents 4,696 64.8% Owner occupied2,549 35.2% Renter occupiedHouse owners and renters - Black or African American residents 104 43.5% Owner occupied135 56.5% Renter occupiedHouse owners and renters - American Indian / Alaska Native residents 40 100.0% Renter occupiedHouse owners and renters - Asian residents 57 100.0% Owner occupiedHouse owners and renters - Other race residents 199 23.4% Owner occupied652 76.6% Renter occupiedHouse owners and renters - Two or more races residents 755 45.2% Owner occupied916 54.8% Renter occupiedHouse owners and renters - White alone residents 4,955 66.7% Owner occupied2,473 33.3% Renter occupiedHouse owners and renters - Hispanic or Latino residents 851 36.0% Owner occupied1,514 64.0% Renter occupied
Language usage in Kerrville
English speakers - Total 86.6% of residents of Kerrville speak English at home.
11.8% of residents speak Spanish at home 2,115 76.8% Speak English very well640 23.2% Speak English less than very well1.6% of residents speak other language at home 319 87.6% Speak English very well45 12.4% Speak English less than very well
English speakers - Born in the United States 95.8% of residents of Kerrville speak English at home.
3.7% of residents speak Spanish at home 258 92.8% Speak English very well20 7.2% Speak English less than very well0.2% of residents speak other language at home 14 100.0% Speak English very well
English speakers - Native, born elsewhere 69.8% of residents of Kerrville speak English at home.
28.5% of residents speak Spanish at home 47 70.1% Speak English very well20 29.9% Speak English less than very well
English speakers - Foreign-born 29.7% of residents of Kerrville speak English at home.
54.3% of residents speak Spanish at home 409 48.3% Speak English very well438 51.7% Speak English less than very well16.3% of residents speak other language at home 241 94.5% Speak English very well14 5.5% Speak English less than very well
White (Caucasian) - Speak only English Native:
100.0% (14,796)Foreign-born:
75.9% (194)
White (Caucasian) - Speak another language Native:
2.6% (391)Foreign-born:
50.6% (129)
Black or African American - Speak another language Native:
1.8% (8)Foreign-born:
100.0% (116)
Asian - Speak only English Native:
95.6% (80)Foreign-born:
44.6% (60)
Asian - Speak another language Native:
5.4% (5)Foreign-born:
56.5% (76)
Other race - Speak only English Native:
54.1% (1,184)Foreign-born:
30.7% (159)
Other race - Speak another language Native:
47.1% (1,031)Foreign-born:
71.4% (370)
Two or more races - Speak only English Native:
75.3% (2,537)Foreign-born:
12.6% (67)
Two or more races - Speak another language Native:
20.7% (696)Foreign-born:
87.0% (461)
White alone - Speak only English Native:
99.0% (14,370)Foreign-born:
81.3% (170)
White alone - Speak another language Native:
1.1% (157)Foreign-born:
18.9% (39)
Hispanic or Latino - Speak only English Native:
70.2% (4,114)Foreign-born:
22.5% (241)
Hispanic or Latino - Speak another language Native:
30.6% (1,796)Foreign-born:
78.8% (844)
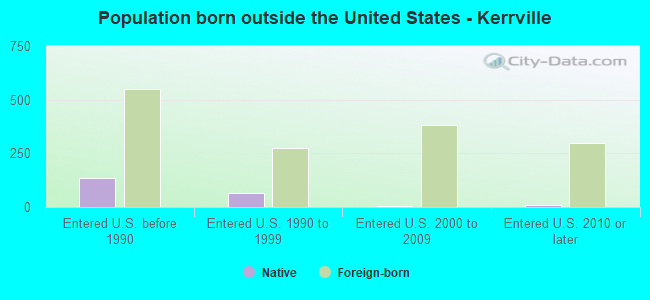
Foreign-born residents in Kerrville 1,560 residents are foreign born (4.4% Latin America , 0.7% Europe ).
This city:
6.2%Texas:
17.1%
Marital status for residents in Kerrville Marital status - White (Caucasian) population 15 years and over
Males 27.2% Never married54.5% Now married0.1% Separated5.3% Widowed13.0% DivorcedFemales 21.2% Never married48.1% Now married1.4% Separated15.5% Widowed13.8% DivorcedWomen who gave birth in the past 12 months Now married:
44.2% (141)Unmarried:
55.8% (179)
Women who did not give birth in the past 12 months Now married:
44.7% (1,118)Unmarried:
55.3% (1,381)
Marital status - Black or African American population 15 years and over
Males 80.5% Never married6.5% Now married0.0% Separated9.5% Widowed3.6% DivorcedFemales 60.9% Never married20.3% Now married0.0% Separated6.9% Widowed11.9% DivorcedWomen who did not give birth in the past 12 months Now married:
0.0% (0)Unmarried:
100.0% (94)
Marital status - American Indian / Alaska Native population 15 years and over
Males 0.0% Never married82.2% Now married0.0% Separated17.8% Widowed0.0% DivorcedFemales 100.0% Never married0.0% Now married0.0% Separated0.0% Widowed0.0% DivorcedWomen who did not give birth in the past 12 months Now married:
0.0% (0)Unmarried:
100.0% (14)
Marital status - Asian population 15 years and over
Males 55.0% Never married45.0% Now married0.0% Separated0.0% Widowed0.0% DivorcedFemales 60.7% Never married39.3% Now married0.0% Separated0.0% Widowed0.0% DivorcedWomen who did not give birth in the past 12 months Now married:
28.9% (24)Unmarried:
71.1% (58)
Marital status - Other race population 15 years and over
Males 51.0% Never married34.3% Now married3.6% Separated1.5% Widowed9.6% DivorcedFemales 35.2% Never married42.6% Now married13.5% Separated0.0% Widowed8.7% DivorcedWomen who gave birth in the past 12 months Now married:
100.0% (130)Unmarried:
0.0% (0)
Women who did not give birth in the past 12 months Now married:
54.2% (378)Unmarried:
45.8% (319)
Marital status - Two or more races population 15 years and over
Males 47.3% Never married49.7% Now married1.9% Separated0.7% Widowed0.5% DivorcedFemales 28.7% Never married27.6% Now married0.0% Separated20.8% Widowed22.8% DivorcedWomen who gave birth in the past 12 months Now married:
100.0% (20)Unmarried:
0.0% (0)
Women who did not give birth in the past 12 months Now married:
34.3% (440)Unmarried:
65.7% (843)
Marital status - White alone, not Hispanic / Latino population 15 years and over
Males 22.2% Never married58.5% Now married0.1% Separated5.6% Widowed13.7% DivorcedFemales 16.2% Never married52.6% Now married1.2% Separated17.0% Widowed13.0% DivorcedWomen who gave birth in the past 12 months Now married:
55.9% (174)Unmarried:
44.1% (137)
Women who did not give birth in the past 12 months Now married:
53.1% (1,269)Unmarried:
46.9% (1,119)
Marital status - Hispanic or Latino population 15 years and over
Males 54.4% Never married36.4% Now married0.6% Separated2.0% Widowed6.6% DivorcedFemales 40.6% Never married26.8% Now married4.7% Separated10.2% Widowed17.7% DivorcedWomen who gave birth in the past 12 months Now married:
56.3% (111)Unmarried:
43.7% (86)
Women who did not give birth in the past 12 months Now married:
29.5% (545)Unmarried:
70.5% (1,301)
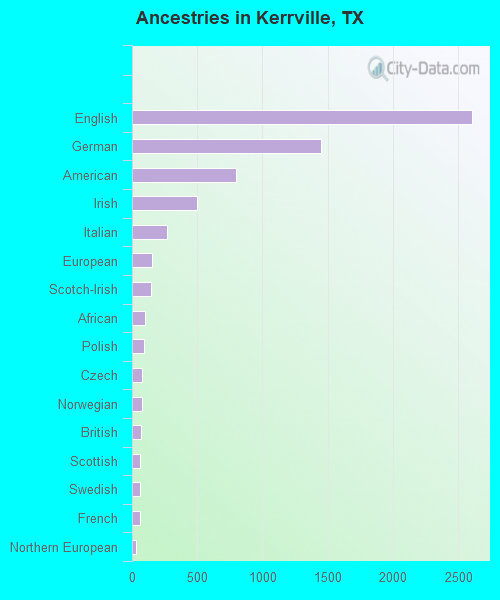
Ancestries in Kerrville
2,607 21.6% English1,447 12.0% German798 6.6% American495 4.1% Irish267 2.2% Italian150 1.2% European146 1.2% Scotch-Irish102 0.8% African91 0.8% Polish79 0.7% Czech77 0.6% Norwegian68 0.6% British62 0.5% Scottish61 0.5% Swedish60 0.5% French29 0.2% Northern European23 0.2% Belizean20 0.2% Scandinavian17 0.1% Russian14 0.1% Croatian8 0.07% Czechoslovakian8 0.07% Eastern European8 0.07% Macedonian7 0.06% Albanian3 0.02% Dutch3 0.02% Ethiopian3 0.02% Swiss
Geographical mobility in Kerrville Same house 1 year ago 12,534 83.1% White (Caucasian)422 75.1% Black or African American60 74.6% American Indian / Alaska Native163 75.7% Asian2,078 66.0% Other race2,777 66.0% Two or more races13,302 86.9% White alone, not Hispanic / Latino4,887 64.5% Hispanic or LatinoMoved within same county 1,210 8.0% White / Caucasian75 13.3% Black or African American856 27.2% Other race650 15.4% Two or more races852 5.6% White alone, not Hispanic / Latino1,718 22.7% Hispanic or LatinoMoved within same state 1,088 7.2% White / Caucasian44 7.8% Black or African American19 23.8% American Indian / Alaska Native46 21.4% Asian541 12.9% Two or more races907 5.9% White alone, not Hispanic / Latino668 8.8% Hispanic or LatinoMoved from different state 253 1.7% White / Caucasian6 1.1% Black or African American159 5.1% Other race177 4.2% Two or more races261 1.7% White alone, not Hispanic / Latino246 3.2% Hispanic or LatinoMoved from abroad 4 0.0% White10 1.7% Black or African American10 4.6% Asian5 0.2% Other race6 0.0% White alone, not Hispanic / Latino4 0.0% Hispanic or Latino
Children Nativity (place of birth) in Kerrville
Children under 6 years - Living with two parents Both parents native 1,182 100.0% NativeBoth parents foreign-born 134 100.0% NativeOne native, one foreign-born parent 75 100.0% NativeChildren under 6 years - Living with one parent Native parent 627 100.0% NativeForeign-born parent 26 100.0% NativeChildren 6 to 17 years - Living with two parents Both parents native 1,567 100.0% Native0 0.0% Foreign-bornBoth parents foreign-born 140 71.0% Native57 29.0% Foreign-bornOne native, one foreign-born parent 87 100.0% NativeChildren 6 to 17 years - Living with one parent Native parent 1,003 100.0% NativeForeign-born parent 259 50.5% Native254 49.5% Foreign-born
Grandparents responsible for own grandchildren in Kerrville
Grandparents (30 to 59 years) White / Caucasian 5 100.0% Not responsible for grandchildrenOther race 10 100.0% Not responsible for grandchildrenWhite alone, not Hispanic / Latino 8 100.0% Not responsible for grandchildrenHispanic or Latino 8 100.0% Not responsible for grandchildrenGrandparents (60 years and over) White / Caucasian 69 100.0% Not responsible for grandchildrenOther race 121 100.0% Not responsible for grandchildrenWhite alone, not Hispanic / Latino 34 100.0% Not responsible for grandchildrenHispanic or Latino 18 10.5% Responsible for grandchildren158 89.5% Not responsible for grandchildren