Races in Kettering, Ohio (OH) Detailed Stats
Data:
Races - White alone (%)
Races - White alone (% change since 2000)
Races - Black alone (%)
Races - Black alone (% change since 2000)
Races - American Indian alone (%)
Races - American Indian alone (% change since 2000)
Races - Asian alone (%)
Races - Asian alone (% change since 2000)
Races - Hispanic (%)
Races - Hispanic (% change since 2000)
Races - Native Hawaiian and Other Pacific Islander alone (%)
Races - Native Hawaiian and Other Pacific Islander alone (% change since 2000)
Races - Two or more races(%)
Races - Two or more races(% change since 2000)
Races - Other race alone (%)
Races - Other race alone (% change since 2000)
Racial diversity
Place of birth - Born in state of residence (%)
Place of birth - Born in state of residence (%) - White
Place of birth - Born in state of residence (%) - Black or African American
Place of birth - Born in state of residence (%) - Asian
Place of birth - Born in state of residence (%) - Hispanic or Latino
Place of birth - Born in state of residence (%) - American Indian and Alaska Native
Place of birth - Born in state of residence (%) - Multirace
Place of birth - Born in state of residence (%) - Other Race
Place of birth - Born in other state (%)
Place of birth - Born in other state (%) - White
Place of birth - Born in other state (%) - Black or African American
Place of birth - Born in other state (%) - Asian
Place of birth - Born in other state (%) - Hispanic or Latino
Place of birth - Born in other state (%) - American Indian and Alaska Native
Place of birth - Born in other state (%) - Multirace
Place of birth - Born in other state (%) - Other Race
Place of birth - Native, outside of US (%)
Place of birth - Native, outside of US (%) - White
Place of birth - Native, outside of US (%) - Black or African American
Place of birth - Native, outside of US (%) - Asian
Place of birth - Native, outside of US (%) - Hispanic or Latino
Place of birth - Native, outside of US (%) - American Indian and Alaska Native
Place of birth - Native, outside of US (%) - Multirace
Place of birth - Native, outside of US (%) - Other Race
Place of birth - Foreign born (%)
Place of birth - Foreign born (%) - White
Place of birth - Foreign born (%) - Black or African American
Place of birth - Foreign born (%) - Asian
Place of birth - Foreign born (%) - Hispanic or Latino
Place of birth - Foreign born (%) - American Indian and Alaska Native
Place of birth - Foreign born (%) - Multirace
Place of birth - Foreign born (%) - Other Race
Residents speaking English at home (%)
Residents speaking English at home - Born in the United States (%)
Residents speaking English at home - Native, born elsewhere (%)
Residents speaking English at home - Foreign born (%)
Residents speaking Spanish at home (%)
Residents speaking Spanish at home - Born in the United States (%)
Residents speaking Spanish at home - Native, born elsewhere (%)
Residents speaking Spanish at home - Foreign born (%)
Residents speaking other language at home (%)
Residents speaking other language at home - Born in the United States (%)
Residents speaking other language at home - Native, born elsewhere (%)
Residents speaking other language at home - Foreign born (%)
Marital status - Never married (%)
Marital status - Now married (%)
Marital status - Separated (%)
Marital status - Widowed (%)
Marital status - Divorced (%)
Ancestries Reported - Arab (%)
Ancestries Reported - Czech (%)
Ancestries Reported - Danish (%)
Ancestries Reported - Dutch (%)
Ancestries Reported - English (%)
Ancestries Reported - French (%)
Ancestries Reported - French Canadian (%)
Ancestries Reported - German (%)
Ancestries Reported - Greek (%)
Ancestries Reported - Hungarian (%)
Ancestries Reported - Irish (%)
Ancestries Reported - Italian (%)
Ancestries Reported - Lithuanian (%)
Ancestries Reported - Norwegian (%)
Ancestries Reported - Polish (%)
Ancestries Reported - Portuguese (%)
Ancestries Reported - Russian (%)
Ancestries Reported - Scotch-Irish (%)
Ancestries Reported - Scottish (%)
Ancestries Reported - Slovak (%)
Ancestries Reported - Subsaharan African (%)
Ancestries Reported - Swedish (%)
Ancestries Reported - Swiss (%)
Ancestries Reported - Ukrainian (%)
Ancestries Reported - United States (%)
Ancestries Reported - Welsh (%)
Ancestries Reported - West Indian (%)
Ancestries Reported - Other (%)
Geographical mobility - Same house 1 year ago (%)
Geographical mobility - Same house 1 year ago (%) - White
Geographical mobility - Same house 1 year ago (%) - Black or African American
Geographical mobility - Same house 1 year ago (%) - Asian
Geographical mobility - Same house 1 year ago (%) - Hispanic or Latino
Geographical mobility - Same house 1 year ago (%) - American Indian and Alaska Native
Geographical mobility - Same house 1 year ago (%) - Multirace
Geographical mobility - Same house 1 year ago (%) - Other Race
Geographical mobility - Moved within same county (%)
Geographical mobility - Moved within same county (%) - White
Geographical mobility - Moved within same county (%) - Black or African American
Geographical mobility - Moved within same county (%) - Asian
Geographical mobility - Moved within same county (%) - Hispanic or Latino
Geographical mobility - Moved within same county (%) - American Indian and Alaska Native
Geographical mobility - Moved within same county (%) - Multirace
Geographical mobility - Moved within same county (%) - Other Race
Geographical mobility - Moved from different county within same state (%)
Geographical mobility - Moved from different county within same state (%) - White
Geographical mobility - Moved from different county within same state (%) - Black or African American
Geographical mobility - Moved from different county within same state (%) - Asian
Geographical mobility - Moved from different county within same state (%) - Hispanic or Latino
Geographical mobility - Moved from different county within same state (%) - American Indian and Alaska Native
Geographical mobility - Moved from different county within same state (%) - Multirace
Geographical mobility - Moved from different county within same state (%) - Other Race
Geographical mobility - Moved from different state (%)
Geographical mobility - Moved from different state (%) - White
Geographical mobility - Moved from different state (%) - Black or African American
Geographical mobility - Moved from different state (%) - Asian
Geographical mobility - Moved from different state (%) - Hispanic or Latino
Geographical mobility - Moved from different state (%) - American Indian and Alaska Native
Geographical mobility - Moved from different state (%) - Multirace
Geographical mobility - Moved from different state (%) - Other Race
Geographical mobility - Moved from abroad (%)
Geographical mobility - Moved from abroad (%) - White
Geographical mobility - Moved from abroad (%) - Black or African American
Geographical mobility - Moved from abroad (%) - Asian
Geographical mobility - Moved from abroad (%) - Hispanic or Latino
Geographical mobility - Moved from abroad (%) - American Indian and Alaska Native
Geographical mobility - Moved from abroad (%) - Multirace
Geographical mobility - Moved from abroad (%) - Other Race
Place of birth for the foreign-born population - Ireland (%)
Place of birth for the foreign-born population - Denmark (%)
Place of birth for the foreign-born population - Norway (%)
Place of birth for the foreign-born population - Sweden (%)
Place of birth for the foreign-born population - United Kingdom (%)
Place of birth for the foreign-born population - England (%)
Place of birth for the foreign-born population - Scotland (%)
Place of birth for the foreign-born population - Other Northern Europe (%)
Place of birth for the foreign-born population - Austria (%)
Place of birth for the foreign-born population - Belgium (%)
Place of birth for the foreign-born population - France (%)
Place of birth for the foreign-born population - Germany (%)
Place of birth for the foreign-born population - Netherlands (%)
Place of birth for the foreign-born population - Switzerland (%)
Place of birth for the foreign-born population - Other Western Europe (%)
Place of birth for the foreign-born population - Greece (%)
Place of birth for the foreign-born population - Italy (%)
Place of birth for the foreign-born population - Portugal (%)
Place of birth for the foreign-born population - Spain (%)
Place of birth for the foreign-born population - Other Southern Europe (%)
Place of birth for the foreign-born population - Albania (%)
Place of birth for the foreign-born population - Belarus (%)
Place of birth for the foreign-born population - Bosnia and Herzegovina (%)
Place of birth for the foreign-born population - Bulgaria (%)
Place of birth for the foreign-born population - Croatia (%)
Place of birth for the foreign-born population - Czechoslovakia (%)
Place of birth for the foreign-born population - Hungary (%)
Place of birth for the foreign-born population - Latvia (%)
Place of birth for the foreign-born population - Lithuania (%)
Place of birth for the foreign-born population - North Macedonia (Macedonia) (%)
Place of birth for the foreign-born population - Moldova (%)
Place of birth for the foreign-born population - Poland (%)
Place of birth for the foreign-born population - Romania (%)
Place of birth for the foreign-born population - Russia (%)
Place of birth for the foreign-born population - Serbia (%)
Place of birth for the foreign-born population - Ukraine (%)
Place of birth for the foreign-born population - Other Eastern Europe (%)
Place of birth for the foreign-born population - China (%)
Place of birth for the foreign-born population - Hong Kong (%)
Place of birth for the foreign-born population - Taiwan (%)
Place of birth for the foreign-born population - Japan (%)
Place of birth for the foreign-born population - Korea (%)
Place of birth for the foreign-born population - Other Eastern Asia (%)
Place of birth for the foreign-born population - Afghanistan (%)
Place of birth for the foreign-born population - Bangladesh (%)
Place of birth for the foreign-born population - India (%)
Place of birth for the foreign-born population - Iran (%)
Place of birth for the foreign-born population - Kazakhstan (%)
Place of birth for the foreign-born population - Nepal (%)
Place of birth for the foreign-born population - Pakistan (%)
Place of birth for the foreign-born population - Sri Lanka (%)
Place of birth for the foreign-born population - Uzbekistan (%)
Place of birth for the foreign-born population - Other South Central Asia (%)
Place of birth for the foreign-born population - Burma (%)
Place of birth for the foreign-born population - Cambodia (%)
Place of birth for the foreign-born population - Indonesia (%)
Place of birth for the foreign-born population - Laos (%)
Place of birth for the foreign-born population - Malaysia (%)
Place of birth for the foreign-born population - Philippines (%)
Place of birth for the foreign-born population - Singapore (%)
Place of birth for the foreign-born population - Thailand (%)
Place of birth for the foreign-born population - Vietnam (%)
Place of birth for the foreign-born population - Other South Eastern Asia (%)
Place of birth for the foreign-born population - Armenia (%)
Place of birth for the foreign-born population - Iraq (%)
Place of birth for the foreign-born population - Israel (%)
Place of birth for the foreign-born population - Jordan (%)
Place of birth for the foreign-born population - Kuwait (%)
Place of birth for the foreign-born population - Lebanon (%)
Place of birth for the foreign-born population - Saudi Arabia (%)
Place of birth for the foreign-born population - Syria (%)
Place of birth for the foreign-born population - Turkey (%)
Place of birth for the foreign-born population - Yemen (%)
Place of birth for the foreign-born population - Other Western Asia (%)
Place of birth for the foreign-born population - Eritrea (%)
Place of birth for the foreign-born population - Ethiopia (%)
Place of birth for the foreign-born population - Kenya (%)
Place of birth for the foreign-born population - Somalia (%)
Place of birth for the foreign-born population - Uganda (%)
Place of birth for the foreign-born population - Zimbabwe (%)
Place of birth for the foreign-born population - Other Eastern Africa (%)
Place of birth for the foreign-born population - Cameroon (%)
Place of birth for the foreign-born population - Congo (%)
Place of birth for the foreign-born population - Democratic Republic of Congo (Zaire) (%)
Place of birth for the foreign-born population - Other Middle Africa (%)
Place of birth for the foreign-born population - Egypt (%)
Place of birth for the foreign-born population - Morocco (%)
Place of birth for the foreign-born population - Sudan (%)
Place of birth for the foreign-born population - Other Northern Africa (%)
Place of birth for the foreign-born population - South Africa (%)
Place of birth for the foreign-born population - Other Southern Africa (%)
Place of birth for the foreign-born population - Cabo Verde (%)
Place of birth for the foreign-born population - Ghana (%)
Place of birth for the foreign-born population - Liberia (%)
Place of birth for the foreign-born population - Nigeria (%)
Place of birth for the foreign-born population - Senegal (%)
Place of birth for the foreign-born population - Sierra Leone (%)
Place of birth for the foreign-born population - Other Western Africa (%)
Place of birth for the foreign-born population - Australia (%)
Place of birth for the foreign-born population - New Zealand (%)
Place of birth for the foreign-born population - Fiji (%)
Place of birth for the foreign-born population - Micronesia (%)
Place of birth for the foreign-born population - Bahamas (%)
Place of birth for the foreign-born population - Barbados (%)
Place of birth for the foreign-born population - Cuba (%)
Place of birth for the foreign-born population - Dominica (%)
Place of birth for the foreign-born population - Dominican Republic (%)
Place of birth for the foreign-born population - Grenada (%)
Place of birth for the foreign-born population - Haiti (%)
Place of birth for the foreign-born population - Jamaica (%)
Place of birth for the foreign-born population - St. Vincent and the Grenadines (%)
Place of birth for the foreign-born population - Trinidad and Tobago (%)
Place of birth for the foreign-born population - West Indies (%)
Place of birth for the foreign-born population - Other Caribbean (%)
Place of birth for the foreign-born population - Belize (%)
Place of birth for the foreign-born population - Costa Rica (%)
Place of birth for the foreign-born population - El Salvador (%)
Place of birth for the foreign-born population - Guatemala (%)
Place of birth for the foreign-born population - Honduras (%)
Place of birth for the foreign-born population - Mexico (%)
Place of birth for the foreign-born population - Nicaragua (%)
Place of birth for the foreign-born population - Panama (%)
Place of birth for the foreign-born population - Other Central America (%)
Place of birth for the foreign-born population - Argentina (%)
Place of birth for the foreign-born population - Bolivia (%)
Place of birth for the foreign-born population - Brazil (%)
Place of birth for the foreign-born population - Chile (%)
Place of birth for the foreign-born population - Colombia (%)
Place of birth for the foreign-born population - Ecuador (%)
Place of birth for the foreign-born population - Guyana (%)
Place of birth for the foreign-born population - Peru (%)
Place of birth for the foreign-born population - Uruguay (%)
Place of birth for the foreign-born population - Venezuela (%)
Place of birth for the foreign-born population - Other South America (%)
Place of birth for the foreign-born population - Canada (%)
Place of birth for the foreign-born population - Other Northern America (%)
Place of birth for the foreign-born population - Other (%)
Latest news about races in Kettering, OH collected exclusively by city-data.com from local newspapers, TV, and radio stations
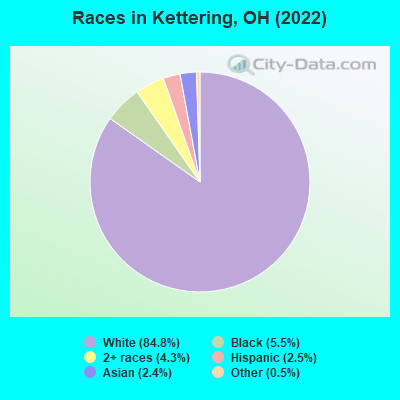
According to 2022 data, the most numerous races in Kettering, OH are White alone (48,755 residents), Black alone (3,149 residents), and Two or more races (2,444 residents). 92.9% of Kettering residents speak English at home. 5.7% of Kettering, OH residents are foreign-born (2.2% born in Asia, 1.5% born in Africa, 1.1% born in Europe), which is 30.3% greater than the foreign-born rate of 4.0% across the entire state of Ohio.
Race distribution in Kettering
2000 2022
9,538,111 84.0% White alone 1,290,662 11.4% Black alone 217,123 1.9% Hispanic 137,770 1.2% Two or more races 131,670 1.2% Asian alone 21,985 0.2% American Indian alone 13,483 0.1% Other race alone 2,336 0.02% Native Hawaiian and Other
8,948,793 76.1% White alone 1,401,403 11.9% Black alone 529,291 4.5% Two or more races 517,232 4.4% Hispanic 293,387 2.5% Asian alone 52,805 0.4% Other race alone 9,785 0.08% American Indian alone 3,362 0.03% Native Hawaiian and Other
Income and house value in Kettering Median household income in 2022 $71,110 White non-Hispanic householders$63,717 Black householders$41,928 Asian householders$63,884 Two or more races householders$66,977 Hispanic or Latino race householdersMedian 2022 house value $202,140 White Non-Hispanic householders$196,515 Black or African American householders$196,515 American Indian or Alaska Native householders $166,212 Asian householders$154,236 Some other race householders$144,619 Two or more races householders$214,116 Hispanic or Latino householders
Median age by race in Kettering
42.0 Median age for White residents39.7 43.7 30.0 Median age for Black or African American residents29.1 30.7 -1,349,593,494.6 Median age for American Indian / Alaska Native residents-685,185,184.5 -1,438,172,041.6 28.7 Median age for Asian residents28.2 30.6 -800,387,596.1 Median age for Native Hawaiian / Pacific Islander residents-750,242,953.6 -805,394,989.6 36.1 Median age for Other race residents32.3 35.1 29.3 Median age for Two or more races residents30.7 30.0 42.0 Median age for White alone residents40.0 43.7 33.4 Median age for Hispanic or Latino residents26.2 41.5
Owner/renter occupied households by race in Kettering
House owners and renters - White residents 16,406 68.7% Owner occupied7,483 31.3% Renter occupiedHouse owners and renters - Black or African American residents 228 16.5% Owner occupied1,154 83.5% Renter occupiedHouse owners and renters - American Indian / Alaska Native residents 1 10.1% Owner occupied10 89.9% Renter occupiedHouse owners and renters - Asian residents 275 46.3% Owner occupied320 53.7% Renter occupiedHouse owners and renters - Other race residents 53 19.6% Owner occupied216 80.4% Renter occupiedHouse owners and renters - Two or more races residents 572 54.0% Owner occupied488 46.0% Renter occupiedHouse owners and renters - White alone residents 16,259 68.4% Owner occupied7,514 31.6% Renter occupiedHouse owners and renters - Hispanic or Latino residents 410 61.7% Owner occupied255 38.3% Renter occupied
Language usage in Kettering
English speakers - Total 92.9% of residents of Kettering speak English at home.
1.6% of residents speak Spanish at home 684 77.0% Speak English very well204 23.0% Speak English less than very well5.3% of residents speak other language at home 1,865 64.3% Speak English very well1,037 35.7% Speak English less than very well
English speakers - Born in the United States 95.2% of residents of Kettering speak English at home.
1.9% of residents speak Spanish at home 208 87.8% Speak English very well29 12.2% Speak English less than very well2.9% of residents speak other language at home 355 97.3% Speak English very well10 2.7% Speak English less than very well
English speakers - Native, born elsewhere 73.4% of residents of Kettering speak English at home.
14.2% of residents speak Spanish at home 87 59.6% Speak English very well59 40.4% Speak English less than very well11.5% of residents speak other language at home 111 94.1% Speak English very well7 5.9% Speak English less than very well
English speakers - Foreign-born 28.8% of residents of Kettering speak English at home.
5.7% of residents speak Spanish at home 111 62.7% Speak English very well66 37.3% Speak English less than very well65.9% of residents speak other language at home 1,022 50.2% Speak English very well1,013 49.8% Speak English less than very well
White (Caucasian) - Speak only English Native:
98.3% (44,768)Foreign-born:
50.0% (511)
White (Caucasian) - Speak another language Native:
1.7% (762)Foreign-born:
49.8% (509)
Black or African American - Speak only English Native:
95.2% (2,003)Foreign-born:
24.1% (152)
Black or African American - Speak another language Native:
4.7% (98)Foreign-born:
64.4% (406)
Asian - Speak only English Native:
49.7% (91)Foreign-born:
15.8% (159)
Asian - Speak another language Native:
34.9% (64)Foreign-born:
83.0% (838)
Other race - Speak only English Native:
63.9% (287)Foreign-born:
13.9% (17)
Other race - Speak another language Native:
34.3% (154)Foreign-born:
86.1% (104)
Two or more races - Speak only English Native:
81.6% (2,183)Foreign-born:
21.3% (36)
Two or more races - Speak another language Native:
21.7% (579)Foreign-born:
78.5% (132)
White alone - Speak only English Native:
98.3% (44,533)Foreign-born:
45.6% (483)
White alone - Speak another language Native:
1.7% (754)Foreign-born:
52.3% (553)
Hispanic or Latino - Speak only English Native:
49.6% (550)Foreign-born:
29.6% (69)
Hispanic or Latino - Speak another language Native:
51.9% (576)Foreign-born:
73.9% (173)
Foreign-born residents in Kettering 3,297 residents are foreign born (2.2% Asia , 1.5% Africa , 1.1% Europe ).
Marital status for residents in Kettering Marital status - White (Caucasian) population 15 years and over
Males 32.8% Never married52.7% Now married0.9% Separated4.2% Widowed9.3% DivorcedFemales 23.5% Never married48.6% Now married1.4% Separated9.5% Widowed17.0% DivorcedWomen who gave birth in the past 12 months Now married:
80.8% (507)Unmarried:
19.2% (120)
Women who did not give birth in the past 12 months Now married:
46.3% (4,440)Unmarried:
53.7% (5,154)
Marital status - Black or African American population 15 years and over
Males 55.6% Never married37.9% Now married2.0% Separated0.0% Widowed4.6% DivorcedFemales 54.1% Never married24.4% Now married3.7% Separated1.1% Widowed16.7% DivorcedWomen who gave birth in the past 12 months Now married:
41.4% (92)Unmarried:
58.6% (130)
Women who did not give birth in the past 12 months Now married:
14.8% (110)Unmarried:
85.2% (632)
Marital status - American Indian / Alaska Native population 15 years and over
Males 0.0% Never married100.0% Now married0.0% Separated0.0% Widowed0.0% DivorcedFemales 100.0% Never married0.0% Now married0.0% Separated0.0% Widowed0.0% DivorcedMarital status - Asian population 15 years and over
Males 49.6% Never married46.4% Now married0.0% Separated1.3% Widowed2.7% DivorcedFemales 16.4% Never married68.4% Now married0.0% Separated1.9% Widowed13.2% DivorcedWomen who gave birth in the past 12 months Now married:
100.0% (19)Unmarried:
0.0% (0)
Women who did not give birth in the past 12 months Now married:
77.6% (331)Unmarried:
22.4% (96)
Marital status - Other race population 15 years and over
Males 66.9% Never married33.1% Now married0.0% Separated0.0% Widowed0.0% DivorcedFemales 47.6% Never married46.2% Now married0.0% Separated6.2% Widowed0.0% DivorcedWomen who did not give birth in the past 12 months Now married:
35.1% (53)Unmarried:
64.9% (99)
Marital status - Two or more races population 15 years and over
Males 46.5% Never married43.8% Now married0.9% Separated0.7% Widowed8.0% DivorcedFemales 37.9% Never married43.4% Now married5.6% Separated1.3% Widowed11.9% DivorcedWomen who gave birth in the past 12 months Now married:
16.2% (16)Unmarried:
83.8% (84)
Women who did not give birth in the past 12 months Now married:
41.9% (204)Unmarried:
58.1% (283)
Marital status - White alone, not Hispanic / Latino population 15 years and over
Males 32.8% Never married52.8% Now married0.9% Separated4.2% Widowed9.3% DivorcedFemales 23.3% Never married48.9% Now married1.4% Separated9.4% Widowed17.0% DivorcedWomen who gave birth in the past 12 months Now married:
80.6% (505)Unmarried:
19.4% (122)
Women who did not give birth in the past 12 months Now married:
46.7% (4,470)Unmarried:
53.3% (5,099)
Marital status - Hispanic or Latino population 15 years and over
Males 44.7% Never married46.3% Now married0.0% Separated0.0% Widowed9.0% DivorcedFemales 31.1% Never married46.1% Now married6.2% Separated5.6% Widowed10.9% DivorcedWomen who gave birth in the past 12 months Now married:
100.0% (13)Unmarried:
0.0% (0)
Women who did not give birth in the past 12 months Now married:
36.6% (129)Unmarried:
63.4% (223)
Ancestries in Kettering
5,884 24.7% German2,891 12.2% English2,528 10.6% American1,694 7.1% Irish1,172 4.9% European622 2.6% Italian381 1.6% Polish322 1.4% African274 1.2% French266 1.1% Scottish232 1.0% Eastern European214 0.9% Hungarian195 0.8% Greek173 0.7% Scotch-Irish121 0.5% Dutch87 0.4% British81 0.3% Russian67 0.3% Northern European61 0.3% Lebanese54 0.2% Arab54 0.2% Haitian48 0.2% French Canadian42 0.2% Norwegian39 0.2% Czechoslovakian39 0.2% Turkish32 0.1% Welsh31 0.1% Austrian31 0.1% Swiss31 0.1% Ukrainian30 0.1% Iranian30 0.1% Sudanese30 0.1% Jamaican29 0.1% Lithuanian27 0.1% Nigerian26 0.1% Canadian25 0.1% Croatian24 0.1% Serbian24 0.1% Ghanaian23 0.10% Swedish21 0.09% Belgian20 0.08% Scandinavian14 0.06% Romanian11 0.05% Carpatho Rusyn10 0.04% Bulgarian10 0.04% Finnish10 0.04% South African8 0.03% Pennsylvania German7 0.03% Danish7 0.03% Czech7 0.03% Barbadian6 0.03% Yugoslavian5 0.02% Luxembourger5 0.02% Guyanese5 0.02% Slovene3 0.01% Alsatian
Geographical mobility in Kettering Same house 1 year ago 43,037 88.6% White (Caucasian)2,103 67.5% Black or African American10 100.0% American Indian / Alaska Native853 64.8% Asian479 79.7% Other race2,806 90.6% Two or more races42,841 88.7% White alone, not Hispanic / Latino1,292 91.5% Hispanic or LatinoMoved within same county 2,952 6.1% White / Caucasian774 24.8% Black or African American125 9.5% Asian87 14.5% Other race258 8.3% Two or more races2,920 6.0% White alone, not Hispanic / Latino92 6.5% Hispanic or LatinoMoved within same state 1,468 3.0% White / Caucasian67 2.1% Black or African American186 14.1% Asian21 3.5% Other race12 0.4% Two or more races1,461 3.0% White alone, not Hispanic / Latino58 4.1% Hispanic or LatinoMoved from different state 808 1.7% White / Caucasian129 4.2% Black or African American12 0.4% Two or more races808 1.7% White alone, not Hispanic / Latino8 0.6% Hispanic or LatinoMoved from abroad 193 0.4% White13 0.4% Black or African American86 6.6% Asian36 1.2% Two or more races204 0.4% White alone, not Hispanic / Latino10 0.7% Hispanic or Latino
Children Nativity (place of birth) in Kettering
Children under 6 years - Living with two parents Both parents native 2,376 100.0% NativeBoth parents foreign-born 233 79.2% Native61 20.8% Foreign-bornOne native, one foreign-born parent 144 100.0% NativeChildren under 6 years - Living with one parent Native parent 841 100.0% NativeChildren 6 to 17 years - Living with two parents Both parents native 5,120 98.4% Native85 1.6% Foreign-bornBoth parents foreign-born 154 39.1% Native239 60.9% Foreign-bornOne native, one foreign-born parent 408 100.0% NativeChildren 6 to 17 years - Living with one parent Native parent 1,883 93.5% Native130 6.5% Foreign-bornForeign-born parent 222 68.3% Native103 31.7% Foreign-born
Grandparents responsible for own grandchildren in Kettering
Grandparents (30 to 59 years) White / Caucasian 189 75.2% Responsible for grandchildren63 24.8% Not responsible for grandchildrenBlack or African American 35 100.0% Responsible for grandchildrenWhite alone, not Hispanic / Latino 190 75.0% Responsible for grandchildren63 25.0% Not responsible for grandchildrenGrandparents (60 years and over) White / Caucasian 116 49.9% Responsible for grandchildren117 50.1% Not responsible for grandchildrenWhite alone, not Hispanic / Latino 116 49.4% Responsible for grandchildren119 50.6% Not responsible for grandchildren