Races in Killeen, Texas (TX) Detailed Stats
Data:
Races - White alone (%)
Races - White alone (% change since 2000)
Races - Black alone (%)
Races - Black alone (% change since 2000)
Races - American Indian alone (%)
Races - American Indian alone (% change since 2000)
Races - Asian alone (%)
Races - Asian alone (% change since 2000)
Races - Hispanic (%)
Races - Hispanic (% change since 2000)
Races - Native Hawaiian and Other Pacific Islander alone (%)
Races - Native Hawaiian and Other Pacific Islander alone (% change since 2000)
Races - Two or more races(%)
Races - Two or more races(% change since 2000)
Races - Other race alone (%)
Races - Other race alone (% change since 2000)
Racial diversity
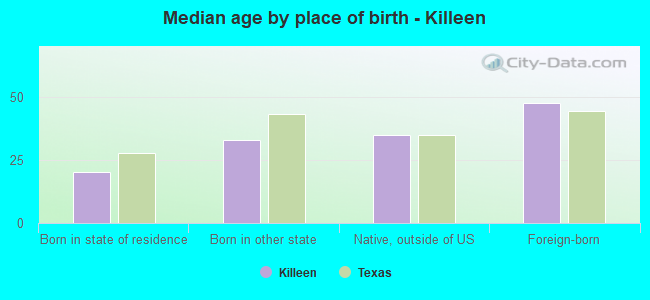
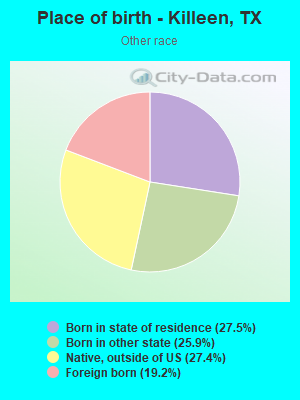
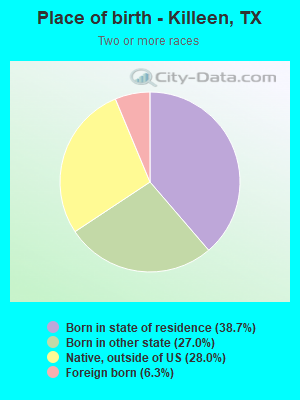
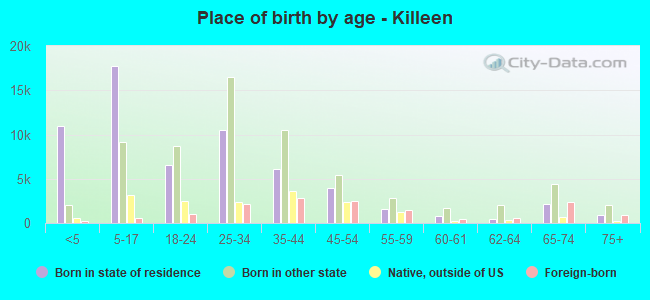
Place of birth - Born in state of residence (%)
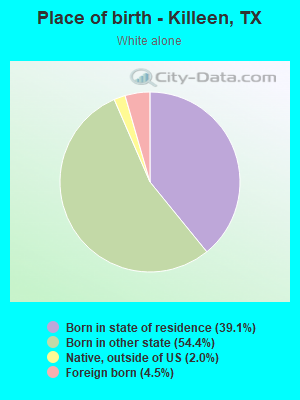
Place of birth - Born in state of residence (%) - White
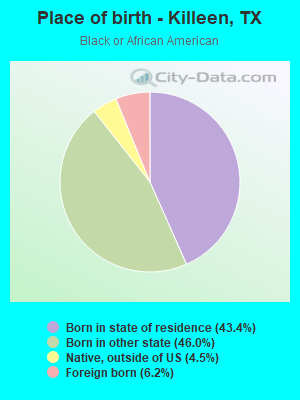
Place of birth - Born in state of residence (%) - Black or African American
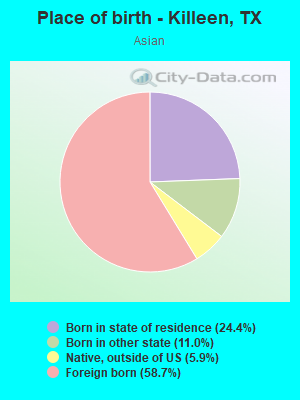
Place of birth - Born in state of residence (%) - Asian
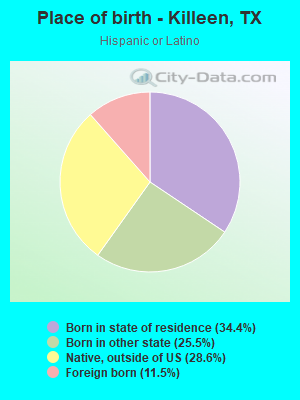
Place of birth - Born in state of residence (%) - Hispanic or Latino
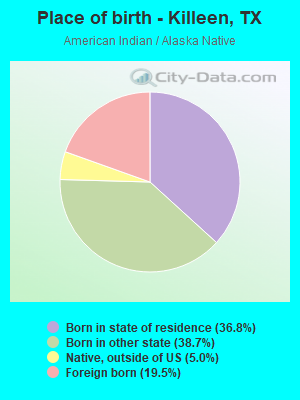
Place of birth - Born in state of residence (%) - American Indian and Alaska Native
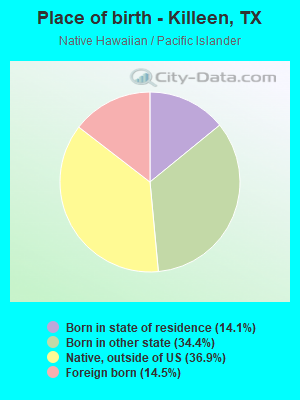
Place of birth - Born in state of residence (%) - Multirace
Place of birth - Born in state of residence (%) - Other Race
Place of birth - Born in other state (%)
Place of birth - Born in other state (%) - White
Place of birth - Born in other state (%) - Black or African American
Place of birth - Born in other state (%) - Asian
Place of birth - Born in other state (%) - Hispanic or Latino
Place of birth - Born in other state (%) - American Indian and Alaska Native
Place of birth - Born in other state (%) - Multirace
Place of birth - Born in other state (%) - Other Race
Place of birth - Native, outside of US (%)
Place of birth - Native, outside of US (%) - White
Place of birth - Native, outside of US (%) - Black or African American
Place of birth - Native, outside of US (%) - Asian
Place of birth - Native, outside of US (%) - Hispanic or Latino
Place of birth - Native, outside of US (%) - American Indian and Alaska Native
Place of birth - Native, outside of US (%) - Multirace
Place of birth - Native, outside of US (%) - Other Race
Place of birth - Foreign born (%)
Place of birth - Foreign born (%) - White
Place of birth - Foreign born (%) - Black or African American
Place of birth - Foreign born (%) - Asian
Place of birth - Foreign born (%) - Hispanic or Latino
Place of birth - Foreign born (%) - American Indian and Alaska Native
Place of birth - Foreign born (%) - Multirace
Place of birth - Foreign born (%) - Other Race
Residents speaking English at home (%)
Residents speaking English at home - Born in the United States (%)
Residents speaking English at home - Native, born elsewhere (%)
Residents speaking English at home - Foreign born (%)
Residents speaking Spanish at home (%)
Residents speaking Spanish at home - Born in the United States (%)
Residents speaking Spanish at home - Native, born elsewhere (%)
Residents speaking Spanish at home - Foreign born (%)
Residents speaking other language at home (%)
Residents speaking other language at home - Born in the United States (%)
Residents speaking other language at home - Native, born elsewhere (%)
Residents speaking other language at home - Foreign born (%)
Marital status - Never married (%)
Marital status - Now married (%)
Marital status - Separated (%)
Marital status - Widowed (%)
Marital status - Divorced (%)
Ancestries Reported - Arab (%)
Ancestries Reported - Czech (%)
Ancestries Reported - Danish (%)
Ancestries Reported - Dutch (%)
Ancestries Reported - English (%)
Ancestries Reported - French (%)
Ancestries Reported - French Canadian (%)
Ancestries Reported - German (%)
Ancestries Reported - Greek (%)
Ancestries Reported - Hungarian (%)
Ancestries Reported - Irish (%)
Ancestries Reported - Italian (%)
Ancestries Reported - Lithuanian (%)
Ancestries Reported - Norwegian (%)
Ancestries Reported - Polish (%)
Ancestries Reported - Portuguese (%)
Ancestries Reported - Russian (%)
Ancestries Reported - Scotch-Irish (%)
Ancestries Reported - Scottish (%)
Ancestries Reported - Slovak (%)
Ancestries Reported - Subsaharan African (%)
Ancestries Reported - Swedish (%)
Ancestries Reported - Swiss (%)
Ancestries Reported - Ukrainian (%)
Ancestries Reported - United States (%)
Ancestries Reported - Welsh (%)
Ancestries Reported - West Indian (%)
Ancestries Reported - Other (%)
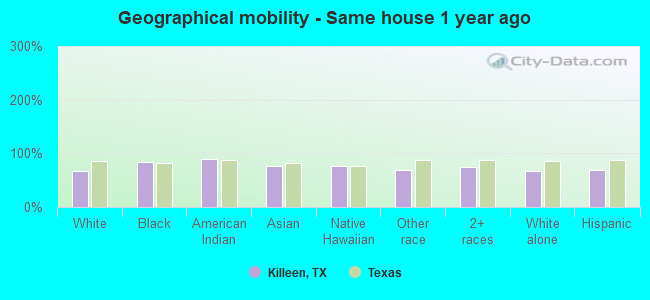
Geographical mobility - Same house 1 year ago (%)
Geographical mobility - Same house 1 year ago (%) - White
Geographical mobility - Same house 1 year ago (%) - Black or African American
Geographical mobility - Same house 1 year ago (%) - Asian
Geographical mobility - Same house 1 year ago (%) - Hispanic or Latino
Geographical mobility - Same house 1 year ago (%) - American Indian and Alaska Native
Geographical mobility - Same house 1 year ago (%) - Multirace
Geographical mobility - Same house 1 year ago (%) - Other Race
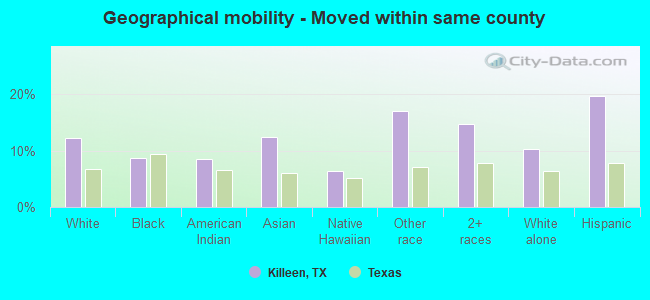
Geographical mobility - Moved within same county (%)
Geographical mobility - Moved within same county (%) - White
Geographical mobility - Moved within same county (%) - Black or African American
Geographical mobility - Moved within same county (%) - Asian
Geographical mobility - Moved within same county (%) - Hispanic or Latino
Geographical mobility - Moved within same county (%) - American Indian and Alaska Native
Geographical mobility - Moved within same county (%) - Multirace
Geographical mobility - Moved within same county (%) - Other Race
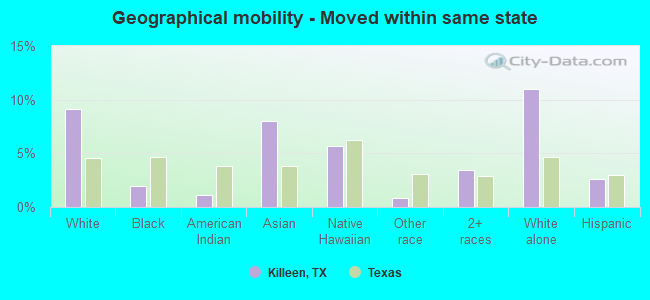
Geographical mobility - Moved from different county within same state (%)
Geographical mobility - Moved from different county within same state (%) - White
Geographical mobility - Moved from different county within same state (%) - Black or African American
Geographical mobility - Moved from different county within same state (%) - Asian
Geographical mobility - Moved from different county within same state (%) - Hispanic or Latino
Geographical mobility - Moved from different county within same state (%) - American Indian and Alaska Native
Geographical mobility - Moved from different county within same state (%) - Multirace
Geographical mobility - Moved from different county within same state (%) - Other Race
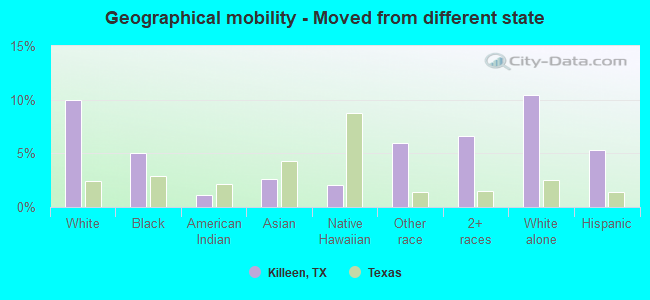
Geographical mobility - Moved from different state (%)
Geographical mobility - Moved from different state (%) - White
Geographical mobility - Moved from different state (%) - Black or African American
Geographical mobility - Moved from different state (%) - Asian
Geographical mobility - Moved from different state (%) - Hispanic or Latino
Geographical mobility - Moved from different state (%) - American Indian and Alaska Native
Geographical mobility - Moved from different state (%) - Multirace
Geographical mobility - Moved from different state (%) - Other Race
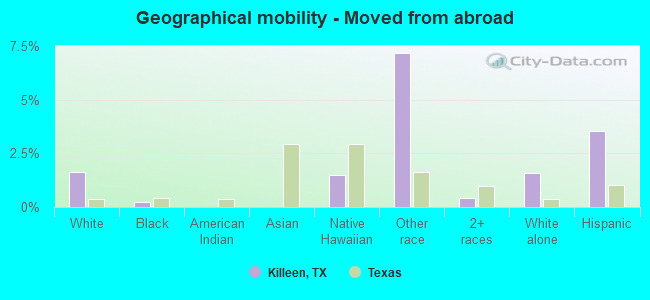
Geographical mobility - Moved from abroad (%)
Geographical mobility - Moved from abroad (%) - White
Geographical mobility - Moved from abroad (%) - Black or African American
Geographical mobility - Moved from abroad (%) - Asian
Geographical mobility - Moved from abroad (%) - Hispanic or Latino
Geographical mobility - Moved from abroad (%) - American Indian and Alaska Native
Geographical mobility - Moved from abroad (%) - Multirace
Geographical mobility - Moved from abroad (%) - Other Race
Place of birth for the foreign-born population - Ireland (%)
Place of birth for the foreign-born population - Denmark (%)
Place of birth for the foreign-born population - Norway (%)
Place of birth for the foreign-born population - Sweden (%)
Place of birth for the foreign-born population - United Kingdom (%)
Place of birth for the foreign-born population - England (%)
Place of birth for the foreign-born population - Scotland (%)
Place of birth for the foreign-born population - Other Northern Europe (%)
Place of birth for the foreign-born population - Austria (%)
Place of birth for the foreign-born population - Belgium (%)
Place of birth for the foreign-born population - France (%)
Place of birth for the foreign-born population - Germany (%)
Place of birth for the foreign-born population - Netherlands (%)
Place of birth for the foreign-born population - Switzerland (%)
Place of birth for the foreign-born population - Other Western Europe (%)
Place of birth for the foreign-born population - Greece (%)
Place of birth for the foreign-born population - Italy (%)
Place of birth for the foreign-born population - Portugal (%)
Place of birth for the foreign-born population - Spain (%)
Place of birth for the foreign-born population - Other Southern Europe (%)
Place of birth for the foreign-born population - Albania (%)
Place of birth for the foreign-born population - Belarus (%)
Place of birth for the foreign-born population - Bosnia and Herzegovina (%)
Place of birth for the foreign-born population - Bulgaria (%)
Place of birth for the foreign-born population - Croatia (%)
Place of birth for the foreign-born population - Czechoslovakia (%)
Place of birth for the foreign-born population - Hungary (%)
Place of birth for the foreign-born population - Latvia (%)
Place of birth for the foreign-born population - Lithuania (%)
Place of birth for the foreign-born population - North Macedonia (Macedonia) (%)
Place of birth for the foreign-born population - Moldova (%)
Place of birth for the foreign-born population - Poland (%)
Place of birth for the foreign-born population - Romania (%)
Place of birth for the foreign-born population - Russia (%)
Place of birth for the foreign-born population - Serbia (%)
Place of birth for the foreign-born population - Ukraine (%)
Place of birth for the foreign-born population - Other Eastern Europe (%)
Place of birth for the foreign-born population - China (%)
Place of birth for the foreign-born population - Hong Kong (%)
Place of birth for the foreign-born population - Taiwan (%)
Place of birth for the foreign-born population - Japan (%)
Place of birth for the foreign-born population - Korea (%)
Place of birth for the foreign-born population - Other Eastern Asia (%)
Place of birth for the foreign-born population - Afghanistan (%)
Place of birth for the foreign-born population - Bangladesh (%)
Place of birth for the foreign-born population - India (%)
Place of birth for the foreign-born population - Iran (%)
Place of birth for the foreign-born population - Kazakhstan (%)
Place of birth for the foreign-born population - Nepal (%)
Place of birth for the foreign-born population - Pakistan (%)
Place of birth for the foreign-born population - Sri Lanka (%)
Place of birth for the foreign-born population - Uzbekistan (%)
Place of birth for the foreign-born population - Other South Central Asia (%)
Place of birth for the foreign-born population - Burma (%)
Place of birth for the foreign-born population - Cambodia (%)
Place of birth for the foreign-born population - Indonesia (%)
Place of birth for the foreign-born population - Laos (%)
Place of birth for the foreign-born population - Malaysia (%)
Place of birth for the foreign-born population - Philippines (%)
Place of birth for the foreign-born population - Singapore (%)
Place of birth for the foreign-born population - Thailand (%)
Place of birth for the foreign-born population - Vietnam (%)
Place of birth for the foreign-born population - Other South Eastern Asia (%)
Place of birth for the foreign-born population - Armenia (%)
Place of birth for the foreign-born population - Iraq (%)
Place of birth for the foreign-born population - Israel (%)
Place of birth for the foreign-born population - Jordan (%)
Place of birth for the foreign-born population - Kuwait (%)
Place of birth for the foreign-born population - Lebanon (%)
Place of birth for the foreign-born population - Saudi Arabia (%)
Place of birth for the foreign-born population - Syria (%)
Place of birth for the foreign-born population - Turkey (%)
Place of birth for the foreign-born population - Yemen (%)
Place of birth for the foreign-born population - Other Western Asia (%)
Place of birth for the foreign-born population - Eritrea (%)
Place of birth for the foreign-born population - Ethiopia (%)
Place of birth for the foreign-born population - Kenya (%)
Place of birth for the foreign-born population - Somalia (%)
Place of birth for the foreign-born population - Uganda (%)
Place of birth for the foreign-born population - Zimbabwe (%)
Place of birth for the foreign-born population - Other Eastern Africa (%)
Place of birth for the foreign-born population - Cameroon (%)
Place of birth for the foreign-born population - Congo (%)
Place of birth for the foreign-born population - Democratic Republic of Congo (Zaire) (%)
Place of birth for the foreign-born population - Other Middle Africa (%)
Place of birth for the foreign-born population - Egypt (%)
Place of birth for the foreign-born population - Morocco (%)
Place of birth for the foreign-born population - Sudan (%)
Place of birth for the foreign-born population - Other Northern Africa (%)
Place of birth for the foreign-born population - South Africa (%)
Place of birth for the foreign-born population - Other Southern Africa (%)
Place of birth for the foreign-born population - Cabo Verde (%)
Place of birth for the foreign-born population - Ghana (%)
Place of birth for the foreign-born population - Liberia (%)
Place of birth for the foreign-born population - Nigeria (%)
Place of birth for the foreign-born population - Senegal (%)
Place of birth for the foreign-born population - Sierra Leone (%)
Place of birth for the foreign-born population - Other Western Africa (%)
Place of birth for the foreign-born population - Australia (%)
Place of birth for the foreign-born population - New Zealand (%)
Place of birth for the foreign-born population - Fiji (%)
Place of birth for the foreign-born population - Micronesia (%)
Place of birth for the foreign-born population - Bahamas (%)
Place of birth for the foreign-born population - Barbados (%)
Place of birth for the foreign-born population - Cuba (%)
Place of birth for the foreign-born population - Dominica (%)
Place of birth for the foreign-born population - Dominican Republic (%)
Place of birth for the foreign-born population - Grenada (%)
Place of birth for the foreign-born population - Haiti (%)
Place of birth for the foreign-born population - Jamaica (%)
Place of birth for the foreign-born population - St. Vincent and the Grenadines (%)
Place of birth for the foreign-born population - Trinidad and Tobago (%)
Place of birth for the foreign-born population - West Indies (%)
Place of birth for the foreign-born population - Other Caribbean (%)
Place of birth for the foreign-born population - Belize (%)
Place of birth for the foreign-born population - Costa Rica (%)
Place of birth for the foreign-born population - El Salvador (%)
Place of birth for the foreign-born population - Guatemala (%)
Place of birth for the foreign-born population - Honduras (%)
Place of birth for the foreign-born population - Mexico (%)
Place of birth for the foreign-born population - Nicaragua (%)
Place of birth for the foreign-born population - Panama (%)
Place of birth for the foreign-born population - Other Central America (%)
Place of birth for the foreign-born population - Argentina (%)
Place of birth for the foreign-born population - Bolivia (%)
Place of birth for the foreign-born population - Brazil (%)
Place of birth for the foreign-born population - Chile (%)
Place of birth for the foreign-born population - Colombia (%)
Place of birth for the foreign-born population - Ecuador (%)
Place of birth for the foreign-born population - Guyana (%)
Place of birth for the foreign-born population - Peru (%)
Place of birth for the foreign-born population - Uruguay (%)
Place of birth for the foreign-born population - Venezuela (%)
Place of birth for the foreign-born population - Other South America (%)
Place of birth for the foreign-born population - Canada (%)
Place of birth for the foreign-born population - Other Northern America (%)
Place of birth for the foreign-born population - Other (%)
Latest news about races in Killeen, TX collected exclusively by city-data.com from local newspapers, TV, and radio stations
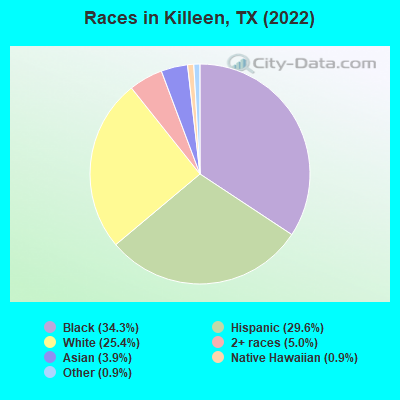
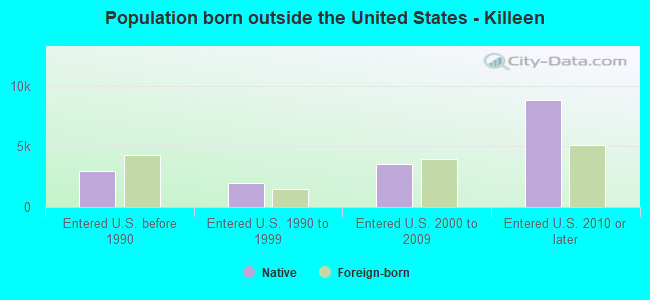
According to 2022 data, the most numerous races in Killeen, TX are Hispanic (47,143 residents), White alone (40,387 residents), and Black alone (54,605 residents). 71.5% of Killeen residents speak English at home. 9.3% of Killeen, TX residents are foreign-born (4.4% born in Latin America, 3.0% born in Asia, 1.1% born in Europe), which is 82.0% less than the foreign-born rate of 17.0% across the entire state of Texas.
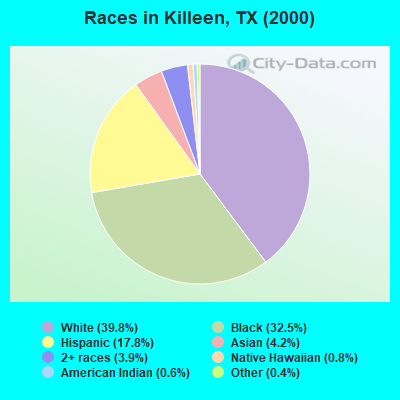
Race distribution in Killeen
2000 2022
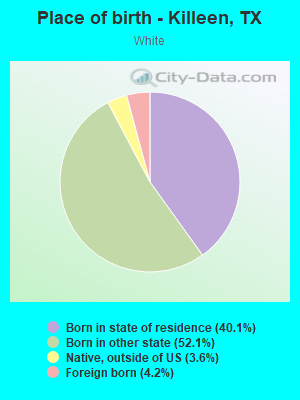
34,570 39.8% White alone 28,267 32.5% Black alone 15,469 17.8% Hispanic 3,669 4.2% Asian alone 3,380 3.9% Two or more races 708 0.8% Native Hawaiian and Other 538 0.6% American Indian alone 310 0.4% Other race alone
54,605 34.3% Black alone 47,143 29.6% Hispanic 40,387 25.4% White alone 7,939 5.0% Two or more races 6,272 3.9% Asian alone 1,380 0.9% Other race alone 1,398 0.9% Native Hawaiian and Other 46 0.03% American Indian alone
2000 2022
10,933,313 52.4% White alone 6,669,666 32.0% Hispanic 2,364,255 11.3% Black alone 554,445 2.7% Asian alone 230,567 1.1% Two or more races 68,859 0.3% American Indian alone 19,958 0.10% Other race alone 10,757 0.05% Native Hawaiian and Other
12,070,642 40.2% Hispanic 11,683,430 38.9% White alone 3,508,706 11.7% Black alone 1,608,173 5.4% Asian alone 956,560 3.2% Two or more races 125,763 0.4% Other race alone 47,023 0.2% American Indian alone 29,275 0.10% Native Hawaiian and Other
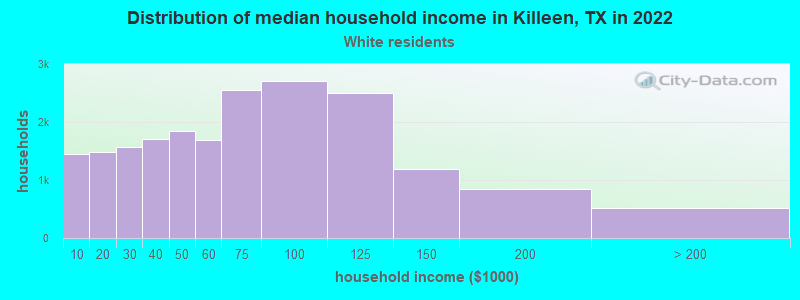
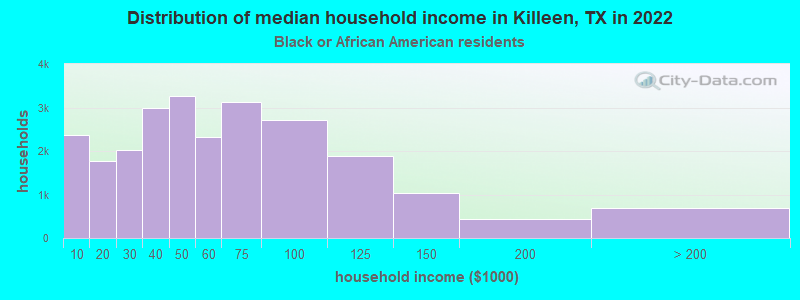
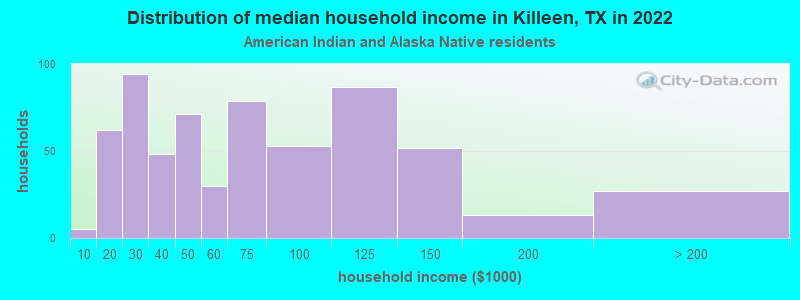
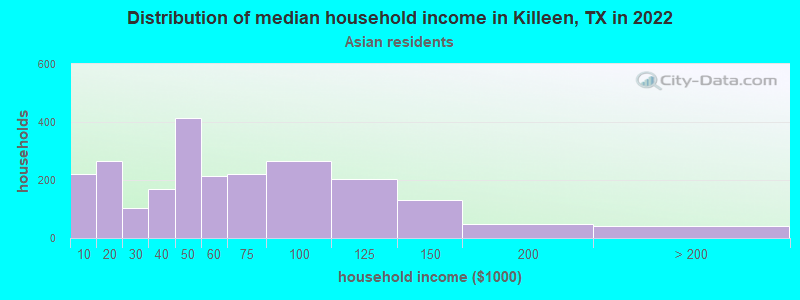
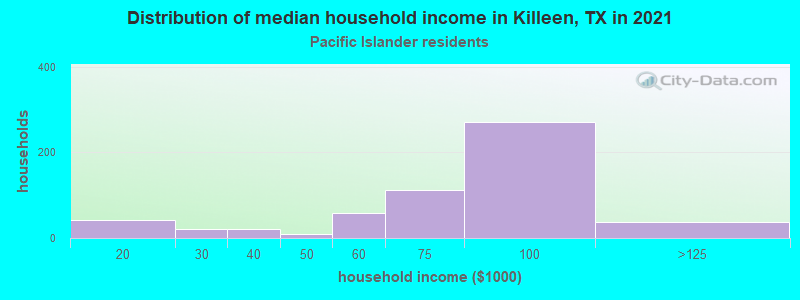
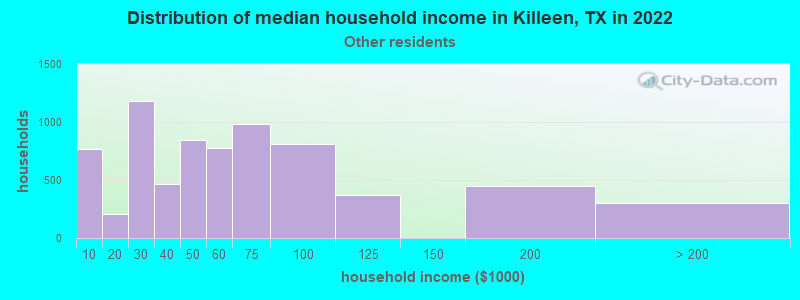
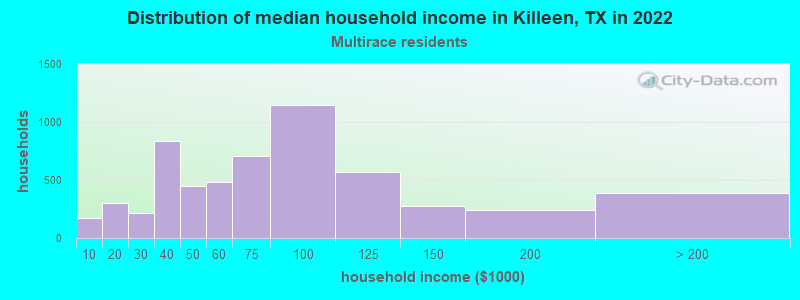
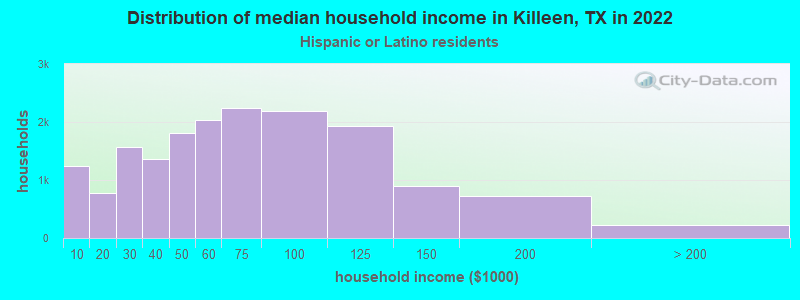
Income and house value in Killeen Median household income in 2022 $60,628 White non-Hispanic householders$49,678 Black householders$48,071 American Indian and Alaska Native householders$68,953 Asian householders$101,997 Native Hawaiian and other Pacific Islander householders$53,060 Some other race householders$72,568 Two or more races householders$56,898 Hispanic or Latino race householdersMedian 2022 house value $203,137 White Non-Hispanic householders$209,833 Black or African American householders$195,324 American Indian or Alaska Native householders $203,137 Asian householders$216,530 Native Hawaiian and other Pacific Islander householders$206,485 Some other race householders$232,714 Two or more races householders$202,579 Hispanic or Latino householders
Median age by race in Killeen
30.3 Median age for White residents30.2 30.4 29.7 Median age for Black or African American residents27.7 32.9 39.4 Median age for American Indian / Alaska Native residents35.0 50.0 44.4 Median age for Asian residents41.8 47.2 30.1 Median age for Native Hawaiian / Pacific Islander residents29.6 30.8 31.9 Median age for Other race residents31.4 32.3 24.3 Median age for Two or more races residents23.8 25.2 32.5 Median age for White alone residents31.0 32.7 29.4 Median age for Hispanic or Latino residents29.2 29.8
Owner/renter occupied households by race in Killeen
House owners and renters - White residents 11,982 59.8% Owner occupied8,062 40.2% Renter occupiedHouse owners and renters - Black or African American residents 10,352 42.1% Owner occupied14,261 57.9% Renter occupiedHouse owners and renters - American Indian / Alaska Native residents 426 57.6% Owner occupied313 42.4% Renter occupiedHouse owners and renters - Asian residents 1,303 48.6% Owner occupied1,380 51.4% Renter occupiedHouse owners and renters - Native Hawaiian / Pacific Islander residents 270 49.5% Owner occupied275 50.5% Renter occupiedHouse owners and renters - Other race residents 2,731 38.2% Owner occupied4,425 61.8% Renter occupiedHouse owners and renters - Two or more races residents 3,843 66.3% Owner occupied1,952 33.7% Renter occupiedHouse owners and renters - White alone residents 9,166 56.9% Owner occupied6,932 43.1% Renter occupiedHouse owners and renters - Hispanic or Latino residents 9,496 55.9% Owner occupied7,493 44.1% Renter occupied
Language usage in Killeen
English speakers - Total 71.5% of residents of Killeen speak English at home.
22.3% of residents speak Spanish at home 24,405 75.3% Speak English very well8,001 24.7% Speak English less than very well6.2% of residents speak other language at home 7,023 78.0% Speak English very well1,985 22.0% Speak English less than very well
English speakers - Born in the United States 86.2% of residents of Killeen speak English at home.
12.2% of residents speak Spanish at home 6,865 89.2% Speak English very well827 10.8% Speak English less than very well1.7% of residents speak other language at home 990 92.7% Speak English very well78 7.3% Speak English less than very well
English speakers - Native, born elsewhere 19.4% of residents of Killeen speak English at home.
75.3% of residents speak Spanish at home 8,344 66.3% Speak English very well4,241 33.7% Speak English less than very well5.3% of residents speak other language at home 685 77.5% Speak English very well199 22.5% Speak English less than very well
English speakers - Foreign-born 22.5% of residents of Killeen speak English at home.
34.8% of residents speak Spanish at home 2,644 51.0% Speak English very well2,540 49.0% Speak English less than very well42.7% of residents speak other language at home 4,946 77.9% Speak English very well1,407 22.1% Speak English less than very well
White (Caucasian) - Speak only English Native:
86.6% (39,326)Foreign-born:
51.8% (1,090)
White (Caucasian) - Speak another language Native:
13.4% (6,102)Foreign-born:
48.2% (1,013)
Black or African American - Speak only English Native:
94.0% (47,643)Foreign-born:
34.8% (1,286)
Black or African American - Speak another language Native:
6.0% (3,030)Foreign-born:
65.2% (2,411)
American Indian / Alaska Native - Speak another language Native:
50.4% (448)Foreign-born:
98.9% (299)
Asian - Speak only English Native:
81.1% (1,979)Foreign-born:
13.9% (533)
Asian - Speak another language Native:
18.9% (462)Foreign-born:
86.1% (3,307)
Native Hawaiian / Pacific Islander - Speak only English Native:
72.6% (1,077)Foreign-born:
15.6% (27)
Native Hawaiian / Pacific Islander - Speak another language Native:
27.6% (409)Foreign-born:
81.8% (140)
Other race - Speak only English Native:
19.3% (2,736)Foreign-born:
4.7% (177)
Other race - Speak another language Native:
80.7% (11,472)Foreign-born:
95.3% (3,595)
Two or more races - Speak only English Native:
50.4% (8,223)Foreign-born:
19.4% (256)
Two or more races - Speak another language Native:
49.6% (8,108)Foreign-born:
80.6% (1,065)
White alone - Speak only English Native:
96.0% (35,045)Foreign-born:
56.7% (1,023)
White alone - Speak another language Native:
4.0% (1,458)Foreign-born:
43.3% (781)
Hispanic or Latino - Speak only English Native:
30.5% (11,540)Foreign-born:
4.5% (244)
Hispanic or Latino - Speak another language Native:
69.5% (26,281)Foreign-born:
95.5% (5,184)
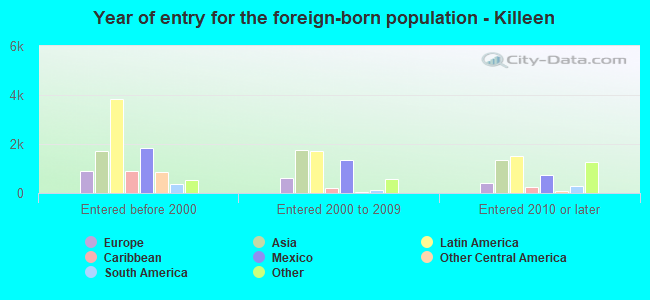
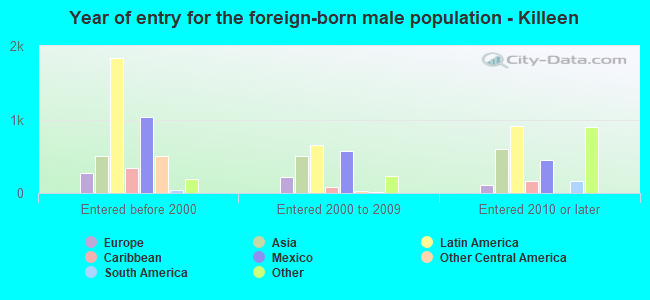
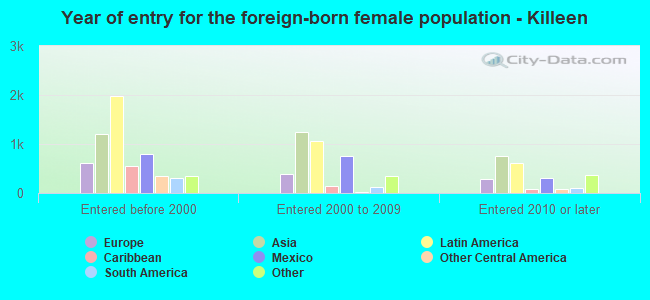
Foreign-born residents in Killeen 14,959 residents are foreign born (4.4% Latin America , 3.0% Asia , 1.1% Europe ).
This city:
9.3%Texas:
17.1%
Marital status for residents in Killeen Marital status - White (Caucasian) population 15 years and over
Males 25.1% Never married61.3% Now married1.5% Separated2.5% Widowed9.7% DivorcedFemales 22.0% Never married57.8% Now married1.8% Separated4.7% Widowed13.7% DivorcedWomen who gave birth in the past 12 months Now married:
89.9% (1,490)Unmarried:
10.1% (167)
Women who did not give birth in the past 12 months Now married:
59.5% (7,515)Unmarried:
40.5% (5,108)
Marital status - Black or African American population 15 years and over
Males 45.1% Never married43.6% Now married1.7% Separated0.4% Widowed9.3% DivorcedFemales 45.3% Never married37.0% Now married4.2% Separated5.4% Widowed8.3% DivorcedWomen who gave birth in the past 12 months Now married:
83.9% (525)Unmarried:
16.1% (101)
Women who did not give birth in the past 12 months Now married:
40.0% (6,102)Unmarried:
60.0% (9,141)
Marital status - American Indian / Alaska Native population 15 years and over
Males 42.8% Never married50.2% Now married3.0% Separated0.0% Widowed4.0% DivorcedFemales 16.3% Never married55.5% Now married3.1% Separated3.8% Widowed21.2% DivorcedWomen who gave birth in the past 12 months Now married:
61.9% (37)Unmarried:
38.1% (23)
Women who did not give birth in the past 12 months Now married:
55.0% (228)Unmarried:
45.0% (186)
Marital status - Asian population 15 years and over
Males 26.5% Never married44.3% Now married8.2% Separated21.1% Widowed0.0% DivorcedFemales 19.8% Never married49.8% Now married0.0% Separated12.4% Widowed18.1% DivorcedWomen who gave birth in the past 12 months Now married:
28.8% (113)Unmarried:
71.2% (279)
Women who did not give birth in the past 12 months Now married:
59.6% (686)Unmarried:
40.4% (465)
Marital status - Native Hawaiian / Pacific Islander population 15 years and over
Males 29.9% Never married50.8% Now married6.5% Separated0.0% Widowed12.8% DivorcedFemales 31.7% Never married55.6% Now married7.1% Separated3.0% Widowed2.5% DivorcedWomen who gave birth in the past 12 months Now married:
100.0% (98)Unmarried:
0.0% (0)
Women who did not give birth in the past 12 months Now married:
32.6% (86)Unmarried:
67.4% (178)
Marital status - Other race population 15 years and over
Males 30.7% Never married57.7% Now married4.6% Separated0.0% Widowed7.0% DivorcedFemales 36.7% Never married41.1% Now married3.4% Separated6.6% Widowed12.2% DivorcedWomen who gave birth in the past 12 months Now married:
83.6% (362)Unmarried:
16.4% (71)
Women who did not give birth in the past 12 months Now married:
40.0% (2,111)Unmarried:
60.0% (3,160)
Marital status - Two or more races population 15 years and over
Males 31.9% Never married58.8% Now married0.0% Separated1.0% Widowed8.3% DivorcedFemales 29.8% Never married48.6% Now married5.5% Separated1.4% Widowed14.7% DivorcedWomen who gave birth in the past 12 months Now married:
75.8% (600)Unmarried:
24.2% (192)
Women who did not give birth in the past 12 months Now married:
49.5% (2,601)Unmarried:
50.5% (2,654)
Marital status - White alone, not Hispanic / Latino population 15 years and over
Males 28.5% Never married58.0% Now married1.2% Separated3.1% Widowed9.3% DivorcedFemales 20.4% Never married57.1% Now married2.3% Separated5.5% Widowed14.6% DivorcedWomen who gave birth in the past 12 months Now married:
87.8% (812)Unmarried:
12.2% (113)
Women who did not give birth in the past 12 months Now married:
59.8% (5,802)Unmarried:
40.2% (3,901)
Marital status - Hispanic or Latino population 15 years and over
Males 27.9% Never married60.5% Now married2.9% Separated0.3% Widowed8.5% DivorcedFemales 29.9% Never married50.8% Now married2.9% Separated4.6% Widowed11.9% DivorcedWomen who gave birth in the past 12 months Now married:
82.1% (1,400)Unmarried:
17.9% (306)
Women who did not give birth in the past 12 months Now married:
51.3% (6,419)Unmarried:
48.7% (6,093)
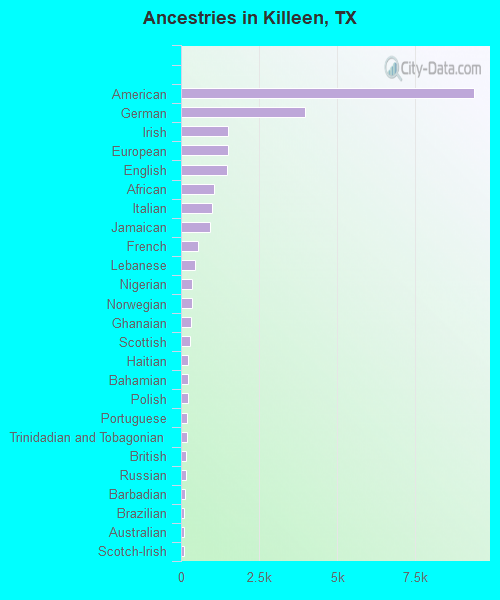
Ancestries in Killeen
9,382 9.6% American3,974 4.1% German1,498 1.5% Irish1,489 1.5% European1,479 1.5% English1,069 1.1% African999 1.0% Italian936 1.0% Jamaican542 0.6% French434 0.4% Lebanese363 0.4% Nigerian336 0.3% Norwegian332 0.3% Ghanaian283 0.3% Scottish236 0.2% Haitian228 0.2% Bahamian217 0.2% Polish198 0.2% Portuguese190 0.2% Trinidadian and Tobagonian165 0.2% British152 0.2% Russian122 0.1% Barbadian106 0.1% Brazilian102 0.1% Australian91 0.09% Scotch-Irish90 0.09% Arab88 0.09% British West Indian83 0.09% French Canadian69 0.07% Dutch59 0.06% Belizean57 0.06% Czech56 0.06% Scandinavian53 0.05% Swedish52 0.05% Turkish50 0.05% Welsh38 0.04% Austrian38 0.04% West Indian37 0.04% Danish37 0.04% Jordanian33 0.03% Slovak33 0.03% Swiss30 0.03% Canadian28 0.03% U.S. Virgin Islander27 0.03% Armenian24 0.02% Yugoslavian19 0.02% Sierra Leonean15 0.02% Czechoslovakian15 0.02% Croatian14 0.01% Romanian14 0.01% Iraqi13 0.01% Finnish10 0.01% Eastern European10 0.01% Liberian10 0.01% Lithuanian8 0.01% Kenyan8 0.01% Northern European7 0.01% Cajun
Geographical mobility in Killeen Same house 1 year ago 33,144 66.9% White (Caucasian)49,839 84.0% Black or African American1,109 89.5% American Indian / Alaska Native5,035 77.0% Asian1,305 76.8% Native Hawaiian / Pacific Islander12,890 68.9% Other race14,936 74.8% Two or more races26,681 66.8% White alone, not Hispanic / Latino31,472 69.0% Hispanic or LatinoMoved within same county 6,089 12.3% White / Caucasian5,183 8.7% Black or African American105 8.5% American Indian / Alaska Native810 12.4% Asian108 6.4% Native Hawaiian / Pacific Islander3,193 17.1% Other race2,938 14.7% Two or more races4,081 10.2% White alone, not Hispanic / Latino8,926 19.6% Hispanic or LatinoMoved within same state 4,534 9.2% White / Caucasian1,152 1.9% Black or African American14 1.1% American Indian / Alaska Native526 8.0% Asian96 5.6% Native Hawaiian / Pacific Islander159 0.9% Other race691 3.5% Two or more races4,376 11.0% White alone, not Hispanic / Latino1,176 2.6% Hispanic or LatinoMoved from different state 4,958 10.0% White / Caucasian2,996 5.1% Black or African American14 1.2% American Indian / Alaska Native169 2.6% Asian35 2.1% Native Hawaiian / Pacific Islander1,122 6.0% Other race1,330 6.7% Two or more races4,157 10.4% White alone, not Hispanic / Latino2,418 5.3% Hispanic or LatinoMoved from abroad 815 1.6% White127 0.2% Black or African American26 1.5% Native Hawaiian / Pacific Islander1,341 7.2% Other race81 0.4% Two or more races628 1.6% White alone, not Hispanic / Latino1,609 3.5% Hispanic or Latino
Children Nativity (place of birth) in Killeen
Children under 6 years - Living with two parents Both parents native 6,915 100.0% NativeBoth parents foreign-born 770 100.0% NativeOne native, one foreign-born parent 932 100.0% NativeChildren under 6 years - Living with one parent Native parent 5,270 100.0% NativeForeign-born parent 463 100.0% NativeChildren 6 to 17 years - Living with two parents Both parents native 13,433 100.0% NativeBoth parents foreign-born 1,084 74.4% Native373 25.6% Foreign-bornOne native, one foreign-born parent 997 100.0% NativeChildren 6 to 17 years - Living with one parent Native parent 9,581 100.0% NativeForeign-born parent 980 55.0% Native803 45.0% Foreign-born
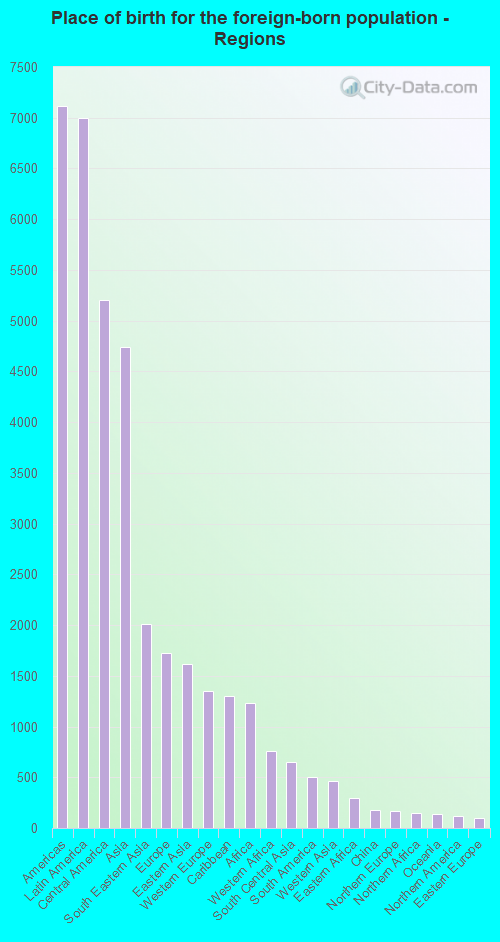
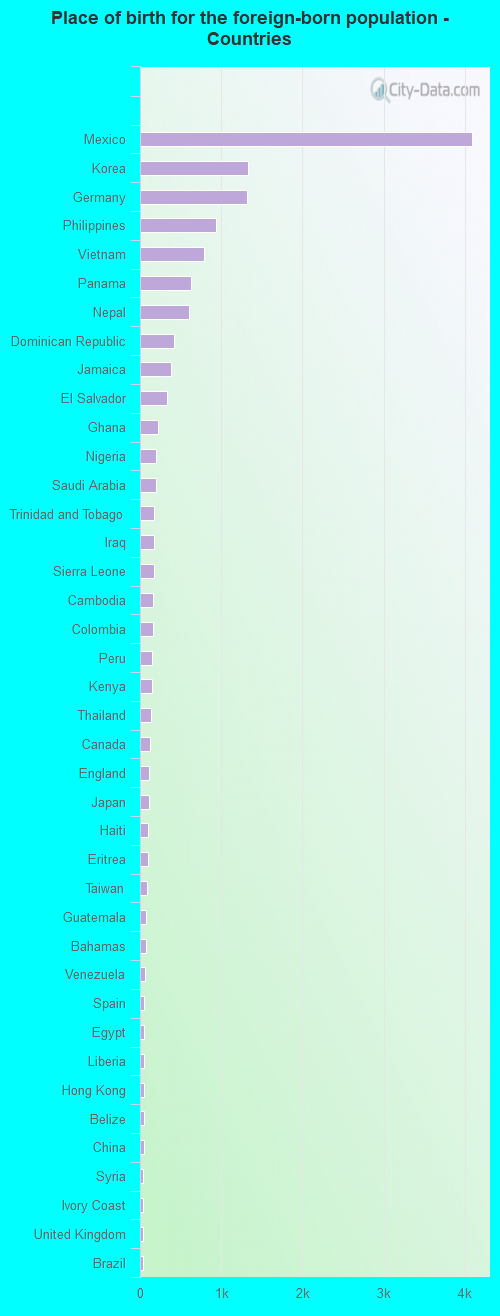
Place of birth for residents in Killeen 7,120 Americas7,002 Latin America5,205 Central America4,742 Asia2,015 South Eastern Asia1,721 Europe1,618 Eastern Asia1,350 Western Europe1,298 Caribbean1,235 Africa762 Western Africa646 South Central Asia498 South America461 Western Asia296 Eastern Africa182 China167 Northern Europe147 Northern Africa139 Oceania118 Northern America100 Eastern Europe55 Southern Europe7 Southern Africa4,091 Mexico1,329 Korea1,317 Germany930 Philippines784 Vietnam630 Panama609 Nepal419 Dominican Republic380 Jamaica328 El Salvador225 Ghana203 Nigeria202 Saudi Arabia176 Trinidad and Tobago172 Iraq167 Sierra Leone166 Cambodia160 Colombia150 Peru145 Kenya133 Thailand118 Canada112 England106 Japan102 Haiti101 Eritrea89 Taiwan77 Guatemala76 Bahamas64 Venezuela55 Spain50 Egypt48 Liberia46 Hong Kong46 Belize46 China43 Syria42 Ivory Coast41 United Kingdom40 Brazil37 Russia32 Bolivia30 Ethiopia27 Ecuador25 Bosnia and Herzegovina23 Netherlands22 Argentina21 India20 Jordan18 Nicaragua18 Kuwait17 Micronesia16 Romania15 Pakistan15 Czechoslovakia13 Scotland12 Honduras10 Barbados9 France7 South Africa6 St. Lucia5 Ukraine4 Lebanon
Grandparents responsible for own grandchildren in Killeen
Grandparents (30 to 59 years) White / Caucasian 296 67.8% Responsible for grandchildren140 32.2% Not responsible for grandchildrenBlack or African American 866 68.8% Responsible for grandchildren392 31.2% Not responsible for grandchildrenAmerican Indian / Alaska Native 9 100.0% Responsible for grandchildrenAsian 16 5.6% Responsible for grandchildren265 94.4% Not responsible for grandchildrenNative Hawaiian / Pacific Islander 25 53.5% Responsible for grandchildren21 46.5% Not responsible for grandchildrenOther race 57 100.0% Not responsible for grandchildrenTwo or more races 16 5.2% Responsible for grandchildren290 94.8% Not responsible for grandchildrenWhite alone, not Hispanic / Latino 179 65.5% Responsible for grandchildren94 34.5% Not responsible for grandchildrenHispanic or Latino 187 32.0% Responsible for grandchildren398 68.0% Not responsible for grandchildrenGrandparents (60 years and over) White / Caucasian 243 41.7% Responsible for grandchildren340 58.3% Not responsible for grandchildrenBlack or African American 424 41.3% Responsible for grandchildren602 58.7% Not responsible for grandchildrenAsian 63 100.0% Not responsible for grandchildrenNative Hawaiian / Pacific Islander 18 53.6% Responsible for grandchildren15 46.4% Not responsible for grandchildrenOther race 23 10.1% Responsible for grandchildren207 89.9% Not responsible for grandchildrenTwo or more races 244 55.5% Responsible for grandchildren196 44.5% Not responsible for grandchildrenWhite alone, not Hispanic / Latino 281 42.0% Responsible for grandchildren388 58.0% Not responsible for grandchildrenHispanic or Latino 268 65.8% Responsible for grandchildren139 34.2% Not responsible for grandchildren