Races in Kingston Estates, New Jersey (NJ) Detailed Stats
Data:
Races - White alone (%)
Races - White alone (% change since 2000)
Races - Black alone (%)
Races - Black alone (% change since 2000)
Races - American Indian alone (%)
Races - American Indian alone (% change since 2000)
Races - Asian alone (%)
Races - Asian alone (% change since 2000)
Races - Hispanic (%)
Races - Hispanic (% change since 2000)
Races - Native Hawaiian and Other Pacific Islander alone (%)
Races - Native Hawaiian and Other Pacific Islander alone (% change since 2000)
Races - Two or more races(%)
Races - Two or more races(% change since 2000)
Races - Other race alone (%)
Races - Other race alone (% change since 2000)
Racial diversity
Place of birth - Born in state of residence (%)
Place of birth - Born in state of residence (%) - White
Place of birth - Born in state of residence (%) - Black or African American
Place of birth - Born in state of residence (%) - Asian
Place of birth - Born in state of residence (%) - Hispanic or Latino
Place of birth - Born in state of residence (%) - American Indian and Alaska Native
Place of birth - Born in state of residence (%) - Multirace
Place of birth - Born in state of residence (%) - Other Race
Place of birth - Born in other state (%)
Place of birth - Born in other state (%) - White
Place of birth - Born in other state (%) - Black or African American
Place of birth - Born in other state (%) - Asian
Place of birth - Born in other state (%) - Hispanic or Latino
Place of birth - Born in other state (%) - American Indian and Alaska Native
Place of birth - Born in other state (%) - Multirace
Place of birth - Born in other state (%) - Other Race
Place of birth - Native, outside of US (%)
Place of birth - Native, outside of US (%) - White
Place of birth - Native, outside of US (%) - Black or African American
Place of birth - Native, outside of US (%) - Asian
Place of birth - Native, outside of US (%) - Hispanic or Latino
Place of birth - Native, outside of US (%) - American Indian and Alaska Native
Place of birth - Native, outside of US (%) - Multirace
Place of birth - Native, outside of US (%) - Other Race
Place of birth - Foreign born (%)
Place of birth - Foreign born (%) - White
Place of birth - Foreign born (%) - Black or African American
Place of birth - Foreign born (%) - Asian
Place of birth - Foreign born (%) - Hispanic or Latino
Place of birth - Foreign born (%) - American Indian and Alaska Native
Place of birth - Foreign born (%) - Multirace
Place of birth - Foreign born (%) - Other Race
Residents speaking English at home (%)
Residents speaking English at home - Born in the United States (%)
Residents speaking English at home - Native, born elsewhere (%)
Residents speaking English at home - Foreign born (%)
Residents speaking Spanish at home (%)
Residents speaking Spanish at home - Born in the United States (%)
Residents speaking Spanish at home - Native, born elsewhere (%)
Residents speaking Spanish at home - Foreign born (%)
Residents speaking other language at home (%)
Residents speaking other language at home - Born in the United States (%)
Residents speaking other language at home - Native, born elsewhere (%)
Residents speaking other language at home - Foreign born (%)
Marital status - Never married (%)
Marital status - Now married (%)
Marital status - Separated (%)
Marital status - Widowed (%)
Marital status - Divorced (%)
Ancestries Reported - Arab (%)
Ancestries Reported - Czech (%)
Ancestries Reported - Danish (%)
Ancestries Reported - Dutch (%)
Ancestries Reported - English (%)
Ancestries Reported - French (%)
Ancestries Reported - French Canadian (%)
Ancestries Reported - German (%)
Ancestries Reported - Greek (%)
Ancestries Reported - Hungarian (%)
Ancestries Reported - Irish (%)
Ancestries Reported - Italian (%)
Ancestries Reported - Lithuanian (%)
Ancestries Reported - Norwegian (%)
Ancestries Reported - Polish (%)
Ancestries Reported - Portuguese (%)
Ancestries Reported - Russian (%)
Ancestries Reported - Scotch-Irish (%)
Ancestries Reported - Scottish (%)
Ancestries Reported - Slovak (%)
Ancestries Reported - Subsaharan African (%)
Ancestries Reported - Swedish (%)
Ancestries Reported - Swiss (%)
Ancestries Reported - Ukrainian (%)
Ancestries Reported - United States (%)
Ancestries Reported - Welsh (%)
Ancestries Reported - West Indian (%)
Ancestries Reported - Other (%)
Geographical mobility - Same house 1 year ago (%)
Geographical mobility - Same house 1 year ago (%) - White
Geographical mobility - Same house 1 year ago (%) - Black or African American
Geographical mobility - Same house 1 year ago (%) - Asian
Geographical mobility - Same house 1 year ago (%) - Hispanic or Latino
Geographical mobility - Same house 1 year ago (%) - American Indian and Alaska Native
Geographical mobility - Same house 1 year ago (%) - Multirace
Geographical mobility - Same house 1 year ago (%) - Other Race
Geographical mobility - Moved within same county (%)
Geographical mobility - Moved within same county (%) - White
Geographical mobility - Moved within same county (%) - Black or African American
Geographical mobility - Moved within same county (%) - Asian
Geographical mobility - Moved within same county (%) - Hispanic or Latino
Geographical mobility - Moved within same county (%) - American Indian and Alaska Native
Geographical mobility - Moved within same county (%) - Multirace
Geographical mobility - Moved within same county (%) - Other Race
Geographical mobility - Moved from different county within same state (%)
Geographical mobility - Moved from different county within same state (%) - White
Geographical mobility - Moved from different county within same state (%) - Black or African American
Geographical mobility - Moved from different county within same state (%) - Asian
Geographical mobility - Moved from different county within same state (%) - Hispanic or Latino
Geographical mobility - Moved from different county within same state (%) - American Indian and Alaska Native
Geographical mobility - Moved from different county within same state (%) - Multirace
Geographical mobility - Moved from different county within same state (%) - Other Race
Geographical mobility - Moved from different state (%)
Geographical mobility - Moved from different state (%) - White
Geographical mobility - Moved from different state (%) - Black or African American
Geographical mobility - Moved from different state (%) - Asian
Geographical mobility - Moved from different state (%) - Hispanic or Latino
Geographical mobility - Moved from different state (%) - American Indian and Alaska Native
Geographical mobility - Moved from different state (%) - Multirace
Geographical mobility - Moved from different state (%) - Other Race
Geographical mobility - Moved from abroad (%)
Geographical mobility - Moved from abroad (%) - White
Geographical mobility - Moved from abroad (%) - Black or African American
Geographical mobility - Moved from abroad (%) - Asian
Geographical mobility - Moved from abroad (%) - Hispanic or Latino
Geographical mobility - Moved from abroad (%) - American Indian and Alaska Native
Geographical mobility - Moved from abroad (%) - Multirace
Geographical mobility - Moved from abroad (%) - Other Race
Place of birth for the foreign-born population - Ireland (%)
Place of birth for the foreign-born population - Denmark (%)
Place of birth for the foreign-born population - Norway (%)
Place of birth for the foreign-born population - Sweden (%)
Place of birth for the foreign-born population - United Kingdom (%)
Place of birth for the foreign-born population - England (%)
Place of birth for the foreign-born population - Scotland (%)
Place of birth for the foreign-born population - Other Northern Europe (%)
Place of birth for the foreign-born population - Austria (%)
Place of birth for the foreign-born population - Belgium (%)
Place of birth for the foreign-born population - France (%)
Place of birth for the foreign-born population - Germany (%)
Place of birth for the foreign-born population - Netherlands (%)
Place of birth for the foreign-born population - Switzerland (%)
Place of birth for the foreign-born population - Other Western Europe (%)
Place of birth for the foreign-born population - Greece (%)
Place of birth for the foreign-born population - Italy (%)
Place of birth for the foreign-born population - Portugal (%)
Place of birth for the foreign-born population - Spain (%)
Place of birth for the foreign-born population - Other Southern Europe (%)
Place of birth for the foreign-born population - Albania (%)
Place of birth for the foreign-born population - Belarus (%)
Place of birth for the foreign-born population - Bosnia and Herzegovina (%)
Place of birth for the foreign-born population - Bulgaria (%)
Place of birth for the foreign-born population - Croatia (%)
Place of birth for the foreign-born population - Czechoslovakia (%)
Place of birth for the foreign-born population - Hungary (%)
Place of birth for the foreign-born population - Latvia (%)
Place of birth for the foreign-born population - Lithuania (%)
Place of birth for the foreign-born population - North Macedonia (Macedonia) (%)
Place of birth for the foreign-born population - Moldova (%)
Place of birth for the foreign-born population - Poland (%)
Place of birth for the foreign-born population - Romania (%)
Place of birth for the foreign-born population - Russia (%)
Place of birth for the foreign-born population - Serbia (%)
Place of birth for the foreign-born population - Ukraine (%)
Place of birth for the foreign-born population - Other Eastern Europe (%)
Place of birth for the foreign-born population - China (%)
Place of birth for the foreign-born population - Hong Kong (%)
Place of birth for the foreign-born population - Taiwan (%)
Place of birth for the foreign-born population - Japan (%)
Place of birth for the foreign-born population - Korea (%)
Place of birth for the foreign-born population - Other Eastern Asia (%)
Place of birth for the foreign-born population - Afghanistan (%)
Place of birth for the foreign-born population - Bangladesh (%)
Place of birth for the foreign-born population - India (%)
Place of birth for the foreign-born population - Iran (%)
Place of birth for the foreign-born population - Kazakhstan (%)
Place of birth for the foreign-born population - Nepal (%)
Place of birth for the foreign-born population - Pakistan (%)
Place of birth for the foreign-born population - Sri Lanka (%)
Place of birth for the foreign-born population - Uzbekistan (%)
Place of birth for the foreign-born population - Other South Central Asia (%)
Place of birth for the foreign-born population - Burma (%)
Place of birth for the foreign-born population - Cambodia (%)
Place of birth for the foreign-born population - Indonesia (%)
Place of birth for the foreign-born population - Laos (%)
Place of birth for the foreign-born population - Malaysia (%)
Place of birth for the foreign-born population - Philippines (%)
Place of birth for the foreign-born population - Singapore (%)
Place of birth for the foreign-born population - Thailand (%)
Place of birth for the foreign-born population - Vietnam (%)
Place of birth for the foreign-born population - Other South Eastern Asia (%)
Place of birth for the foreign-born population - Armenia (%)
Place of birth for the foreign-born population - Iraq (%)
Place of birth for the foreign-born population - Israel (%)
Place of birth for the foreign-born population - Jordan (%)
Place of birth for the foreign-born population - Kuwait (%)
Place of birth for the foreign-born population - Lebanon (%)
Place of birth for the foreign-born population - Saudi Arabia (%)
Place of birth for the foreign-born population - Syria (%)
Place of birth for the foreign-born population - Turkey (%)
Place of birth for the foreign-born population - Yemen (%)
Place of birth for the foreign-born population - Other Western Asia (%)
Place of birth for the foreign-born population - Eritrea (%)
Place of birth for the foreign-born population - Ethiopia (%)
Place of birth for the foreign-born population - Kenya (%)
Place of birth for the foreign-born population - Somalia (%)
Place of birth for the foreign-born population - Uganda (%)
Place of birth for the foreign-born population - Zimbabwe (%)
Place of birth for the foreign-born population - Other Eastern Africa (%)
Place of birth for the foreign-born population - Cameroon (%)
Place of birth for the foreign-born population - Congo (%)
Place of birth for the foreign-born population - Democratic Republic of Congo (Zaire) (%)
Place of birth for the foreign-born population - Other Middle Africa (%)
Place of birth for the foreign-born population - Egypt (%)
Place of birth for the foreign-born population - Morocco (%)
Place of birth for the foreign-born population - Sudan (%)
Place of birth for the foreign-born population - Other Northern Africa (%)
Place of birth for the foreign-born population - South Africa (%)
Place of birth for the foreign-born population - Other Southern Africa (%)
Place of birth for the foreign-born population - Cabo Verde (%)
Place of birth for the foreign-born population - Ghana (%)
Place of birth for the foreign-born population - Liberia (%)
Place of birth for the foreign-born population - Nigeria (%)
Place of birth for the foreign-born population - Senegal (%)
Place of birth for the foreign-born population - Sierra Leone (%)
Place of birth for the foreign-born population - Other Western Africa (%)
Place of birth for the foreign-born population - Australia (%)
Place of birth for the foreign-born population - New Zealand (%)
Place of birth for the foreign-born population - Fiji (%)
Place of birth for the foreign-born population - Micronesia (%)
Place of birth for the foreign-born population - Bahamas (%)
Place of birth for the foreign-born population - Barbados (%)
Place of birth for the foreign-born population - Cuba (%)
Place of birth for the foreign-born population - Dominica (%)
Place of birth for the foreign-born population - Dominican Republic (%)
Place of birth for the foreign-born population - Grenada (%)
Place of birth for the foreign-born population - Haiti (%)
Place of birth for the foreign-born population - Jamaica (%)
Place of birth for the foreign-born population - St. Vincent and the Grenadines (%)
Place of birth for the foreign-born population - Trinidad and Tobago (%)
Place of birth for the foreign-born population - West Indies (%)
Place of birth for the foreign-born population - Other Caribbean (%)
Place of birth for the foreign-born population - Belize (%)
Place of birth for the foreign-born population - Costa Rica (%)
Place of birth for the foreign-born population - El Salvador (%)
Place of birth for the foreign-born population - Guatemala (%)
Place of birth for the foreign-born population - Honduras (%)
Place of birth for the foreign-born population - Mexico (%)
Place of birth for the foreign-born population - Nicaragua (%)
Place of birth for the foreign-born population - Panama (%)
Place of birth for the foreign-born population - Other Central America (%)
Place of birth for the foreign-born population - Argentina (%)
Place of birth for the foreign-born population - Bolivia (%)
Place of birth for the foreign-born population - Brazil (%)
Place of birth for the foreign-born population - Chile (%)
Place of birth for the foreign-born population - Colombia (%)
Place of birth for the foreign-born population - Ecuador (%)
Place of birth for the foreign-born population - Guyana (%)
Place of birth for the foreign-born population - Peru (%)
Place of birth for the foreign-born population - Uruguay (%)
Place of birth for the foreign-born population - Venezuela (%)
Place of birth for the foreign-born population - Other South America (%)
Place of birth for the foreign-born population - Canada (%)
Place of birth for the foreign-born population - Other Northern America (%)
Place of birth for the foreign-born population - Other (%)
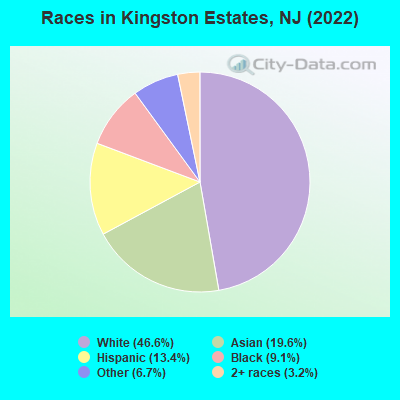
According to 2022 data, the most numerous races in Kingston Estates, NJ are White alone (3,278 residents), Hispanic (942 residents), and Black alone (638 residents). 65.2% of Kingston Estates residents speak English at home.
Race distribution in Kingston Estates 3,278 46.6% White alone 1,377 19.6% Asian alone 942 13.4% Hispanic 638 9.1% Black alone 469 6.7% Other race alone 223 3.2% Two or more races
2000 2022
5,557,209 66.0% White alone 1,117,191 13.3% Hispanic 1,096,171 13.0% Black alone 477,012 5.7% Asian alone 133,689 1.6% Two or more races 19,565 0.2% Other race alone 11,338 0.1% American Indian alone 2,175 0.03% Native Hawaiian and Other
4,766,476 51.5% White alone 2,028,470 21.9% Hispanic 1,111,632 12.0% Black alone 923,546 10.0% Asian alone 332,237 3.6% Two or more races 89,847 1.0% Other race alone 8,557 0.09% American Indian alone 934 0.01% Native Hawaiian and Other
Income and house value in Kingston Estates Median household income in 2022 $102,377 White non-Hispanic householders$107,278 Black householders$80,018 Asian householders$117,650 Two or more races householders$108,221 Hispanic or Latino race householders
Median age by race in Kingston Estates
51.8 Median age for White residents48.9 55.7 26.7 Median age for Black or African American residents30.1 25.2 -676,272,813.9 Median age for American Indian / Alaska Native residents-670,465,336.5 -688,298,917.7 37.4 Median age for Asian residents37.4 37.9 -701,509,871.5 Median age for Native Hawaiian / Pacific Islander residents-860,335,194.7 -668,881,505.4 35.1 Median age for Other race residents28.0 47.7 41.9 Median age for Two or more races residents39.2 52.7 49.4 Median age for White alone residents45.6 55.5 37.7 Median age for Hispanic or Latino residents37.5 53.0
Owner/renter occupied households by race in Kingston Estates
House owners and renters - White residents 1,222 85.3% Owner occupied211 14.7% Renter occupiedHouse owners and renters - Black or African American residents 105 53.2% Owner occupied93 46.8% Renter occupiedHouse owners and renters - Asian residents 380 65.6% Owner occupied199 34.4% Renter occupiedHouse owners and renters - Other race residents 321 100.0% Renter occupiedHouse owners and renters - Two or more races residents 191 70.2% Owner occupied81 29.8% Renter occupiedHouse owners and renters - White alone residents 1,150 83.6% Owner occupied226 16.4% Renter occupiedHouse owners and renters - Hispanic or Latino residents 180 65.2% Owner occupied96 34.8% Renter occupied
Language usage in Kingston Estates
English speakers - Total 65.2% of residents of Kingston Estates speak English at home.
7.8% of residents speak Spanish at home 253 48.1% Speak English very well273 51.9% Speak English less than very well24.7% of residents speak other language at home 757 45.5% Speak English very well908 54.5% Speak English less than very well
English speakers - Born in the United States 83.3% of residents of Kingston Estates speak English at home.
2.8% of residents speak Spanish at home 61 100.0% Speak English very well14.5% of residents speak other language at home 169 54.0% Speak English very well144 46.0% Speak English less than very well
English speakers - Native, born elsewhere 22.0% of residents of Kingston Estates speak English at home.
31.2% of residents speak Spanish at home 19 43.2% Speak English very well25 56.8% Speak English less than very well52.5% of residents speak other language at home 74 100.0% Speak English less than very well
English speakers - Foreign-born 17.8% of residents of Kingston Estates speak English at home.
14.7% of residents speak Spanish at home 6 2.3% Speak English very well260 97.7% Speak English less than very well60.3% of residents speak other language at home 381 34.9% Speak English very well712 65.1% Speak English less than very well
White (Caucasian) - Speak only English Native:
95.1% (2,842)Foreign-born:
13.0% (24)
White (Caucasian) - Speak another language Native:
4.9% (147)Foreign-born:
87.6% (161)
Black or African American - Speak only English Native:
75.1% (382)Foreign-born:
100.0% (87)
Asian - Speak only English Native:
40.9% (162)Foreign-born:
15.8% (151)
Asian - Speak another language Native:
54.1% (215)Foreign-born:
85.1% (816)
Other race - Speak another language Native:
50.1% (278)Foreign-born:
99.7% (168)
Two or more races - Speak only English Native:
83.9% (532)Foreign-born:
14.9% (66)
Two or more races - Speak another language Native:
17.4% (110)Foreign-born:
75.6% (334)
White alone - Speak only English Native:
95.0% (2,765)Foreign-born:
12.5% (27)
White alone - Speak another language Native:
5.5% (160)Foreign-born:
89.7% (198)
Hispanic or Latino - Speak only English Native:
58.3% (344)Foreign-born:
18.5% (68)
Hispanic or Latino - Speak another language Native:
41.0% (242)Foreign-born:
76.4% (280)
Foreign-born residents in Kingston Estates
Marital status for residents in Kingston Estates Marital status - White (Caucasian) population 15 years and over
Males 33.6% Never married63.3% Now married0.0% Separated3.2% Widowed0.0% DivorcedFemales 30.7% Never married47.6% Now married0.0% Separated13.5% Widowed8.2% DivorcedWomen who gave birth in the past 12 months Now married:
100.0% (28)Unmarried:
0.0% (0)
Women who did not give birth in the past 12 months Now married:
35.0% (231)Unmarried:
65.0% (428)
Marital status - Black or African American population 15 years and over
Males 41.0% Never married59.0% Now married0.0% Separated0.0% Widowed0.0% DivorcedFemales 60.8% Never married34.5% Now married0.0% Separated4.7% Widowed0.0% DivorcedWomen who did not give birth in the past 12 months Now married:
46.5% (57)Unmarried:
53.5% (66)
Marital status - Asian population 15 years and over
Males 33.3% Never married59.2% Now married0.0% Separated0.0% Widowed7.5% DivorcedFemales 10.4% Never married50.8% Now married0.0% Separated15.4% Widowed23.4% DivorcedWomen who did not give birth in the past 12 months Now married:
76.1% (192)Unmarried:
23.9% (60)
Marital status - Other race population 15 years and over
Males 94.4% Never married0.0% Now married0.0% Separated0.0% Widowed5.6% DivorcedFemales 12.7% Never married0.0% Now married0.0% Separated0.0% Widowed87.3% DivorcedWomen who did not give birth in the past 12 months Now married:
0.0% (0)Unmarried:
100.0% (77)
Marital status - Two or more races population 15 years and over
Males 7.6% Never married92.4% Now married0.0% Separated0.0% Widowed0.0% DivorcedFemales 40.2% Never married43.3% Now married0.0% Separated16.5% Widowed0.0% DivorcedWomen who did not give birth in the past 12 months Now married:
40.3% (82)Unmarried:
59.7% (122)
Marital status - White alone, not Hispanic / Latino population 15 years and over
Males 32.2% Never married64.5% Now married0.0% Separated3.3% Widowed0.0% DivorcedFemales 29.2% Never married48.0% Now married0.0% Separated14.2% Widowed8.6% DivorcedWomen who gave birth in the past 12 months Now married:
100.0% (29)Unmarried:
0.0% (0)
Women who did not give birth in the past 12 months Now married:
33.5% (224)Unmarried:
66.5% (444)
Marital status - Hispanic or Latino population 15 years and over
Males 15.4% Never married73.6% Now married0.0% Separated0.0% Widowed11.0% DivorcedFemales 51.7% Never married34.9% Now married0.0% Separated13.4% Widowed0.0% DivorcedWomen who did not give birth in the past 12 months Now married:
36.7% (67)Unmarried:
63.3% (115)
Ancestries in Kingston Estates
348 9.7% Brazilian271 7.6% Italian245 6.8% Irish204 5.7% American86 2.4% Russian71 2.0% German66 1.8% Polish55 1.5% South African39 1.1% European37 1.0% Armenian33 0.9% Lithuanian32 0.9% Jordanian31 0.9% Swedish26 0.7% Greek19 0.5% Eastern European19 0.5% English19 0.5% French Canadian17 0.5% Egyptian17 0.5% Lebanese15 0.4% Hungarian10 0.3% Welsh
Children Nativity (place of birth) in Kingston Estates
Children under 6 years - Living with two parents Both parents native 152 100.0% NativeBoth parents foreign-born 30 53.0% Native26 47.0% Foreign-bornOne native, one foreign-born parent 14 100.0% NativeChildren under 6 years - Living with one parent Native parent 51 100.0% NativeForeign-born parent 85 100.0% NativeChildren 6 to 17 years - Living with two parents Both parents native 397 100.0% NativeBoth parents foreign-born 255 94.4% Native15 5.6% Foreign-bornChildren 6 to 17 years - Living with one parent Native parent 149 100.0% NativeForeign-born parent 129 51.5% Native121 48.5% Foreign-born
Grandparents responsible for own grandchildren in Kingston Estates
Grandparents (30 to 59 years) Black or African American 53 100.0% Responsible for grandchildren
Grandparents (60 years and over)