Races in Kokomo, Indiana (IN) Detailed Stats
Data:
Races - White alone (%)
Races - White alone (% change since 2000)
Races - Black alone (%)
Races - Black alone (% change since 2000)
Races - American Indian alone (%)
Races - American Indian alone (% change since 2000)
Races - Asian alone (%)
Races - Asian alone (% change since 2000)
Races - Hispanic (%)
Races - Hispanic (% change since 2000)
Races - Native Hawaiian and Other Pacific Islander alone (%)
Races - Native Hawaiian and Other Pacific Islander alone (% change since 2000)
Races - Two or more races(%)
Races - Two or more races(% change since 2000)
Races - Other race alone (%)
Races - Other race alone (% change since 2000)
Racial diversity
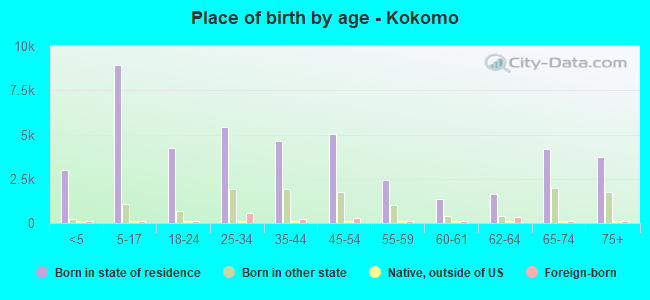
Place of birth - Born in state of residence (%)
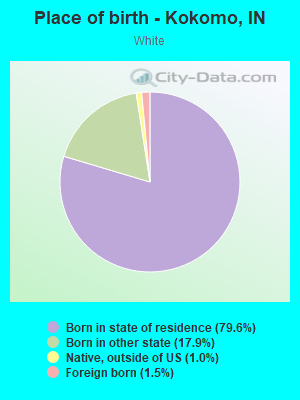
Place of birth - Born in state of residence (%) - White
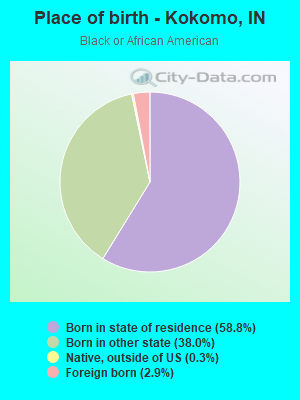
Place of birth - Born in state of residence (%) - Black or African American
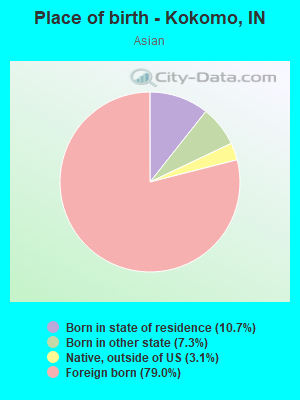
Place of birth - Born in state of residence (%) - Asian
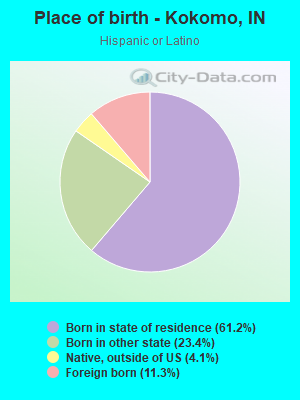
Place of birth - Born in state of residence (%) - Hispanic or Latino
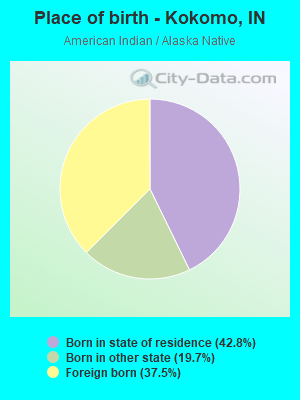
Place of birth - Born in state of residence (%) - American Indian and Alaska Native
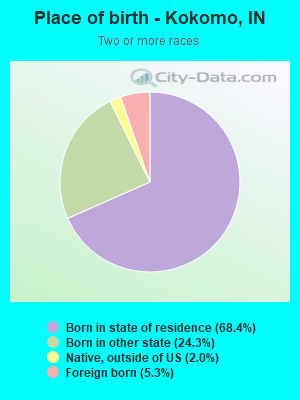
Place of birth - Born in state of residence (%) - Multirace
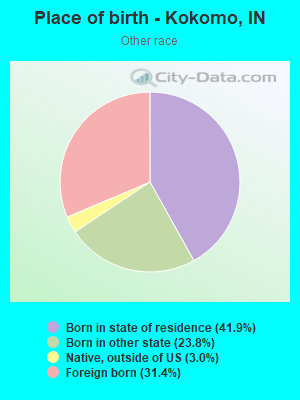
Place of birth - Born in state of residence (%) - Other Race
Place of birth - Born in other state (%)
Place of birth - Born in other state (%) - White
Place of birth - Born in other state (%) - Black or African American
Place of birth - Born in other state (%) - Asian
Place of birth - Born in other state (%) - Hispanic or Latino
Place of birth - Born in other state (%) - American Indian and Alaska Native
Place of birth - Born in other state (%) - Multirace
Place of birth - Born in other state (%) - Other Race
Place of birth - Native, outside of US (%)
Place of birth - Native, outside of US (%) - White
Place of birth - Native, outside of US (%) - Black or African American
Place of birth - Native, outside of US (%) - Asian
Place of birth - Native, outside of US (%) - Hispanic or Latino
Place of birth - Native, outside of US (%) - American Indian and Alaska Native
Place of birth - Native, outside of US (%) - Multirace
Place of birth - Native, outside of US (%) - Other Race
Place of birth - Foreign born (%)
Place of birth - Foreign born (%) - White
Place of birth - Foreign born (%) - Black or African American
Place of birth - Foreign born (%) - Asian
Place of birth - Foreign born (%) - Hispanic or Latino
Place of birth - Foreign born (%) - American Indian and Alaska Native
Place of birth - Foreign born (%) - Multirace
Place of birth - Foreign born (%) - Other Race
Residents speaking English at home (%)
Residents speaking English at home - Born in the United States (%)
Residents speaking English at home - Native, born elsewhere (%)
Residents speaking English at home - Foreign born (%)
Residents speaking Spanish at home (%)
Residents speaking Spanish at home - Born in the United States (%)
Residents speaking Spanish at home - Native, born elsewhere (%)
Residents speaking Spanish at home - Foreign born (%)
Residents speaking other language at home (%)
Residents speaking other language at home - Born in the United States (%)
Residents speaking other language at home - Native, born elsewhere (%)
Residents speaking other language at home - Foreign born (%)
Marital status - Never married (%)
Marital status - Now married (%)
Marital status - Separated (%)
Marital status - Widowed (%)
Marital status - Divorced (%)
Ancestries Reported - Arab (%)
Ancestries Reported - Czech (%)
Ancestries Reported - Danish (%)
Ancestries Reported - Dutch (%)
Ancestries Reported - English (%)
Ancestries Reported - French (%)
Ancestries Reported - French Canadian (%)
Ancestries Reported - German (%)
Ancestries Reported - Greek (%)
Ancestries Reported - Hungarian (%)
Ancestries Reported - Irish (%)
Ancestries Reported - Italian (%)
Ancestries Reported - Lithuanian (%)
Ancestries Reported - Norwegian (%)
Ancestries Reported - Polish (%)
Ancestries Reported - Portuguese (%)
Ancestries Reported - Russian (%)
Ancestries Reported - Scotch-Irish (%)
Ancestries Reported - Scottish (%)
Ancestries Reported - Slovak (%)
Ancestries Reported - Subsaharan African (%)
Ancestries Reported - Swedish (%)
Ancestries Reported - Swiss (%)
Ancestries Reported - Ukrainian (%)
Ancestries Reported - United States (%)
Ancestries Reported - Welsh (%)
Ancestries Reported - West Indian (%)
Ancestries Reported - Other (%)
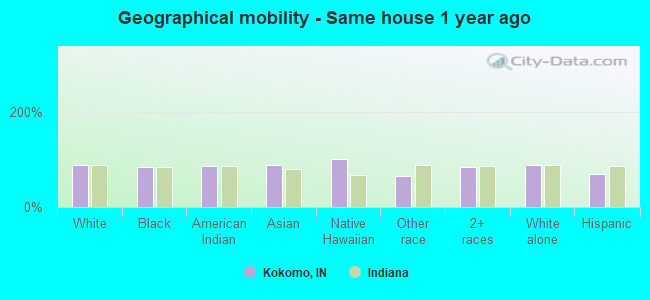
Geographical mobility - Same house 1 year ago (%)
Geographical mobility - Same house 1 year ago (%) - White
Geographical mobility - Same house 1 year ago (%) - Black or African American
Geographical mobility - Same house 1 year ago (%) - Asian
Geographical mobility - Same house 1 year ago (%) - Hispanic or Latino
Geographical mobility - Same house 1 year ago (%) - American Indian and Alaska Native
Geographical mobility - Same house 1 year ago (%) - Multirace
Geographical mobility - Same house 1 year ago (%) - Other Race
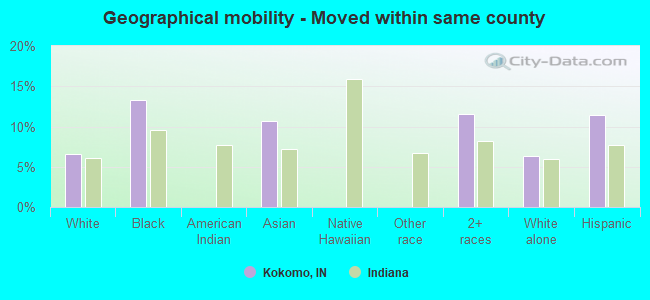
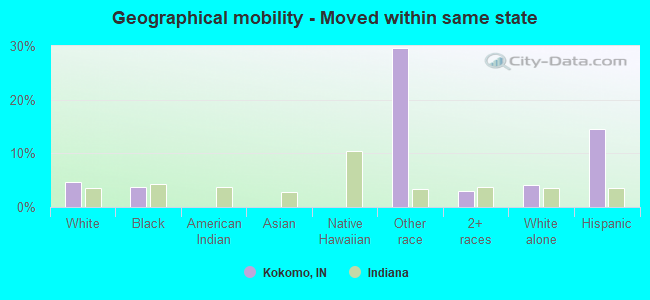
Geographical mobility - Moved within same county (%)
Geographical mobility - Moved within same county (%) - White
Geographical mobility - Moved within same county (%) - Black or African American
Geographical mobility - Moved within same county (%) - Asian
Geographical mobility - Moved within same county (%) - Hispanic or Latino
Geographical mobility - Moved within same county (%) - American Indian and Alaska Native
Geographical mobility - Moved within same county (%) - Multirace
Geographical mobility - Moved within same county (%) - Other Race
Geographical mobility - Moved from different county within same state (%)
Geographical mobility - Moved from different county within same state (%) - White
Geographical mobility - Moved from different county within same state (%) - Black or African American
Geographical mobility - Moved from different county within same state (%) - Asian
Geographical mobility - Moved from different county within same state (%) - Hispanic or Latino
Geographical mobility - Moved from different county within same state (%) - American Indian and Alaska Native
Geographical mobility - Moved from different county within same state (%) - Multirace
Geographical mobility - Moved from different county within same state (%) - Other Race
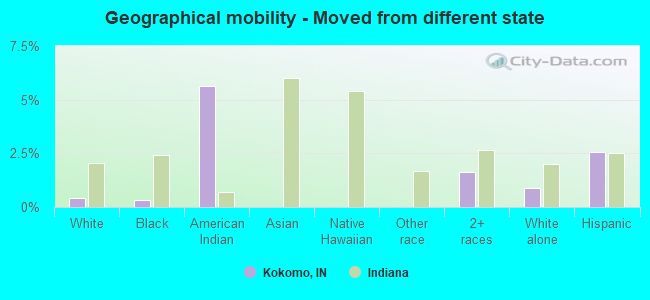
Geographical mobility - Moved from different state (%)
Geographical mobility - Moved from different state (%) - White
Geographical mobility - Moved from different state (%) - Black or African American
Geographical mobility - Moved from different state (%) - Asian
Geographical mobility - Moved from different state (%) - Hispanic or Latino
Geographical mobility - Moved from different state (%) - American Indian and Alaska Native
Geographical mobility - Moved from different state (%) - Multirace
Geographical mobility - Moved from different state (%) - Other Race
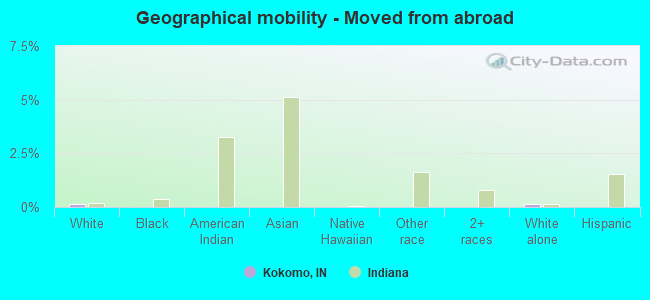
Geographical mobility - Moved from abroad (%)
Geographical mobility - Moved from abroad (%) - White
Geographical mobility - Moved from abroad (%) - Black or African American
Geographical mobility - Moved from abroad (%) - Asian
Geographical mobility - Moved from abroad (%) - Hispanic or Latino
Geographical mobility - Moved from abroad (%) - American Indian and Alaska Native
Geographical mobility - Moved from abroad (%) - Multirace
Geographical mobility - Moved from abroad (%) - Other Race
Place of birth for the foreign-born population - Ireland (%)
Place of birth for the foreign-born population - Denmark (%)
Place of birth for the foreign-born population - Norway (%)
Place of birth for the foreign-born population - Sweden (%)
Place of birth for the foreign-born population - United Kingdom (%)
Place of birth for the foreign-born population - England (%)
Place of birth for the foreign-born population - Scotland (%)
Place of birth for the foreign-born population - Other Northern Europe (%)
Place of birth for the foreign-born population - Austria (%)
Place of birth for the foreign-born population - Belgium (%)
Place of birth for the foreign-born population - France (%)
Place of birth for the foreign-born population - Germany (%)
Place of birth for the foreign-born population - Netherlands (%)
Place of birth for the foreign-born population - Switzerland (%)
Place of birth for the foreign-born population - Other Western Europe (%)
Place of birth for the foreign-born population - Greece (%)
Place of birth for the foreign-born population - Italy (%)
Place of birth for the foreign-born population - Portugal (%)
Place of birth for the foreign-born population - Spain (%)
Place of birth for the foreign-born population - Other Southern Europe (%)
Place of birth for the foreign-born population - Albania (%)
Place of birth for the foreign-born population - Belarus (%)
Place of birth for the foreign-born population - Bosnia and Herzegovina (%)
Place of birth for the foreign-born population - Bulgaria (%)
Place of birth for the foreign-born population - Croatia (%)
Place of birth for the foreign-born population - Czechoslovakia (%)
Place of birth for the foreign-born population - Hungary (%)
Place of birth for the foreign-born population - Latvia (%)
Place of birth for the foreign-born population - Lithuania (%)
Place of birth for the foreign-born population - North Macedonia (Macedonia) (%)
Place of birth for the foreign-born population - Moldova (%)
Place of birth for the foreign-born population - Poland (%)
Place of birth for the foreign-born population - Romania (%)
Place of birth for the foreign-born population - Russia (%)
Place of birth for the foreign-born population - Serbia (%)
Place of birth for the foreign-born population - Ukraine (%)
Place of birth for the foreign-born population - Other Eastern Europe (%)
Place of birth for the foreign-born population - China (%)
Place of birth for the foreign-born population - Hong Kong (%)
Place of birth for the foreign-born population - Taiwan (%)
Place of birth for the foreign-born population - Japan (%)
Place of birth for the foreign-born population - Korea (%)
Place of birth for the foreign-born population - Other Eastern Asia (%)
Place of birth for the foreign-born population - Afghanistan (%)
Place of birth for the foreign-born population - Bangladesh (%)
Place of birth for the foreign-born population - India (%)
Place of birth for the foreign-born population - Iran (%)
Place of birth for the foreign-born population - Kazakhstan (%)
Place of birth for the foreign-born population - Nepal (%)
Place of birth for the foreign-born population - Pakistan (%)
Place of birth for the foreign-born population - Sri Lanka (%)
Place of birth for the foreign-born population - Uzbekistan (%)
Place of birth for the foreign-born population - Other South Central Asia (%)
Place of birth for the foreign-born population - Burma (%)
Place of birth for the foreign-born population - Cambodia (%)
Place of birth for the foreign-born population - Indonesia (%)
Place of birth for the foreign-born population - Laos (%)
Place of birth for the foreign-born population - Malaysia (%)
Place of birth for the foreign-born population - Philippines (%)
Place of birth for the foreign-born population - Singapore (%)
Place of birth for the foreign-born population - Thailand (%)
Place of birth for the foreign-born population - Vietnam (%)
Place of birth for the foreign-born population - Other South Eastern Asia (%)
Place of birth for the foreign-born population - Armenia (%)
Place of birth for the foreign-born population - Iraq (%)
Place of birth for the foreign-born population - Israel (%)
Place of birth for the foreign-born population - Jordan (%)
Place of birth for the foreign-born population - Kuwait (%)
Place of birth for the foreign-born population - Lebanon (%)
Place of birth for the foreign-born population - Saudi Arabia (%)
Place of birth for the foreign-born population - Syria (%)
Place of birth for the foreign-born population - Turkey (%)
Place of birth for the foreign-born population - Yemen (%)
Place of birth for the foreign-born population - Other Western Asia (%)
Place of birth for the foreign-born population - Eritrea (%)
Place of birth for the foreign-born population - Ethiopia (%)
Place of birth for the foreign-born population - Kenya (%)
Place of birth for the foreign-born population - Somalia (%)
Place of birth for the foreign-born population - Uganda (%)
Place of birth for the foreign-born population - Zimbabwe (%)
Place of birth for the foreign-born population - Other Eastern Africa (%)
Place of birth for the foreign-born population - Cameroon (%)
Place of birth for the foreign-born population - Congo (%)
Place of birth for the foreign-born population - Democratic Republic of Congo (Zaire) (%)
Place of birth for the foreign-born population - Other Middle Africa (%)
Place of birth for the foreign-born population - Egypt (%)
Place of birth for the foreign-born population - Morocco (%)
Place of birth for the foreign-born population - Sudan (%)
Place of birth for the foreign-born population - Other Northern Africa (%)
Place of birth for the foreign-born population - South Africa (%)
Place of birth for the foreign-born population - Other Southern Africa (%)
Place of birth for the foreign-born population - Cabo Verde (%)
Place of birth for the foreign-born population - Ghana (%)
Place of birth for the foreign-born population - Liberia (%)
Place of birth for the foreign-born population - Nigeria (%)
Place of birth for the foreign-born population - Senegal (%)
Place of birth for the foreign-born population - Sierra Leone (%)
Place of birth for the foreign-born population - Other Western Africa (%)
Place of birth for the foreign-born population - Australia (%)
Place of birth for the foreign-born population - New Zealand (%)
Place of birth for the foreign-born population - Fiji (%)
Place of birth for the foreign-born population - Micronesia (%)
Place of birth for the foreign-born population - Bahamas (%)
Place of birth for the foreign-born population - Barbados (%)
Place of birth for the foreign-born population - Cuba (%)
Place of birth for the foreign-born population - Dominica (%)
Place of birth for the foreign-born population - Dominican Republic (%)
Place of birth for the foreign-born population - Grenada (%)
Place of birth for the foreign-born population - Haiti (%)
Place of birth for the foreign-born population - Jamaica (%)
Place of birth for the foreign-born population - St. Vincent and the Grenadines (%)
Place of birth for the foreign-born population - Trinidad and Tobago (%)
Place of birth for the foreign-born population - West Indies (%)
Place of birth for the foreign-born population - Other Caribbean (%)
Place of birth for the foreign-born population - Belize (%)
Place of birth for the foreign-born population - Costa Rica (%)
Place of birth for the foreign-born population - El Salvador (%)
Place of birth for the foreign-born population - Guatemala (%)
Place of birth for the foreign-born population - Honduras (%)
Place of birth for the foreign-born population - Mexico (%)
Place of birth for the foreign-born population - Nicaragua (%)
Place of birth for the foreign-born population - Panama (%)
Place of birth for the foreign-born population - Other Central America (%)
Place of birth for the foreign-born population - Argentina (%)
Place of birth for the foreign-born population - Bolivia (%)
Place of birth for the foreign-born population - Brazil (%)
Place of birth for the foreign-born population - Chile (%)
Place of birth for the foreign-born population - Colombia (%)
Place of birth for the foreign-born population - Ecuador (%)
Place of birth for the foreign-born population - Guyana (%)
Place of birth for the foreign-born population - Peru (%)
Place of birth for the foreign-born population - Uruguay (%)
Place of birth for the foreign-born population - Venezuela (%)
Place of birth for the foreign-born population - Other South America (%)
Place of birth for the foreign-born population - Canada (%)
Place of birth for the foreign-born population - Other Northern America (%)
Place of birth for the foreign-born population - Other (%)
Latest news about races in Kokomo, IN collected exclusively by city-data.com from local newspapers, TV, and radio stations
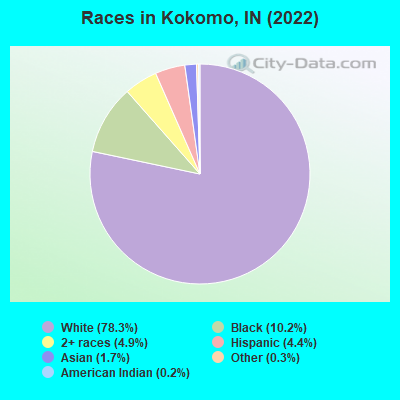
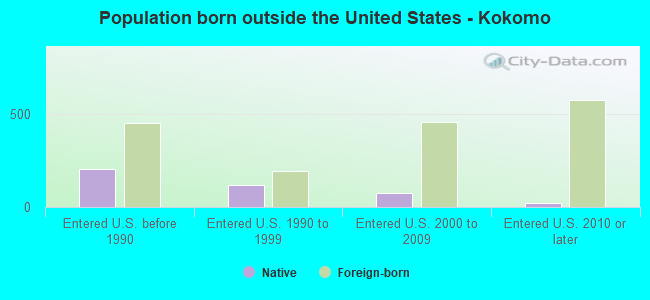
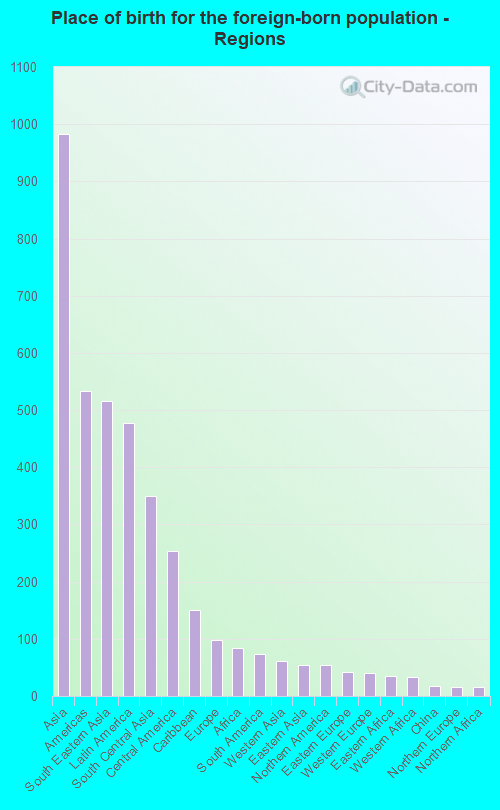
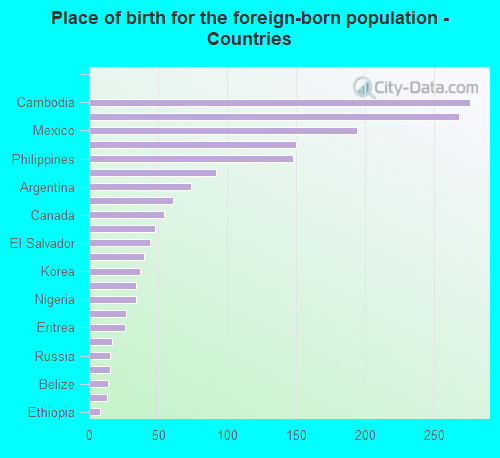
According to 2022 data, the most numerous races in Kokomo, IN are White alone (46,959 residents), Black alone (6,093 residents), and Hispanic (2,660 residents). 95.2% of Kokomo residents speak English at home. 2.9% of Kokomo, IN residents are foreign-born (1.5% born in Asia, 0.7% born in Latin America), which is 110.4% less than the foreign-born rate of 6.0% across the entire state of Indiana.
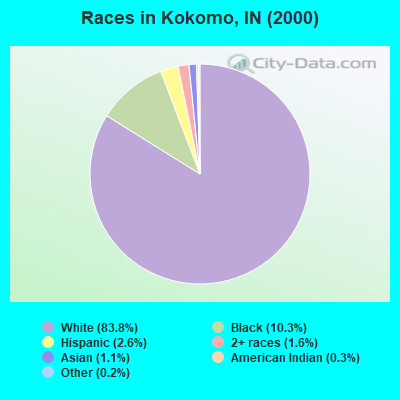
Race distribution in Kokomo
2000 2022
5,219,373 85.8% White alone 505,462 8.3% Black alone 214,536 3.5% Hispanic 61,115 1.0% Two or more races 58,424 1.0% Asian alone 13,654 0.2% American Indian alone 6,348 0.1% Other race alone 1,573 0.03% Native Hawaiian and Other
5,192,455 76.0% White alone 628,054 9.2% Black alone 534,528 7.8% Hispanic 263,242 3.9% Two or more races 172,880 2.5% Asian alone 33,467 0.5% Other race alone 5,866 0.09% American Indian alone 2,545 0.04% Native Hawaiian and Other
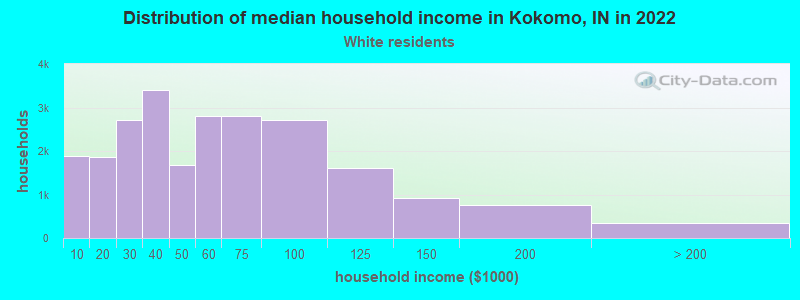
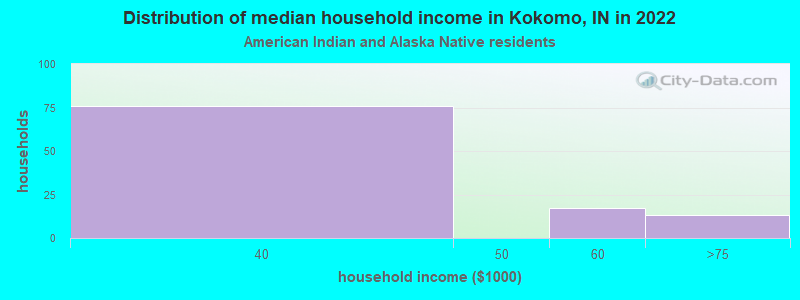
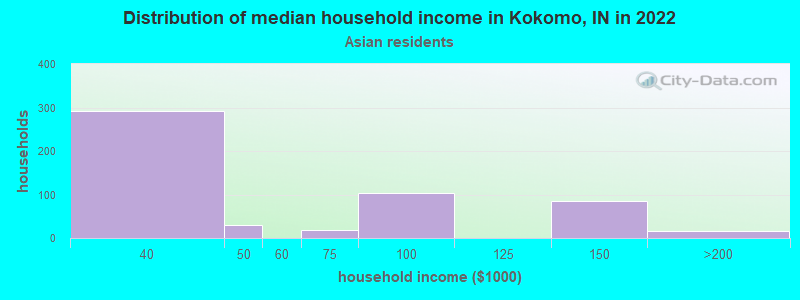
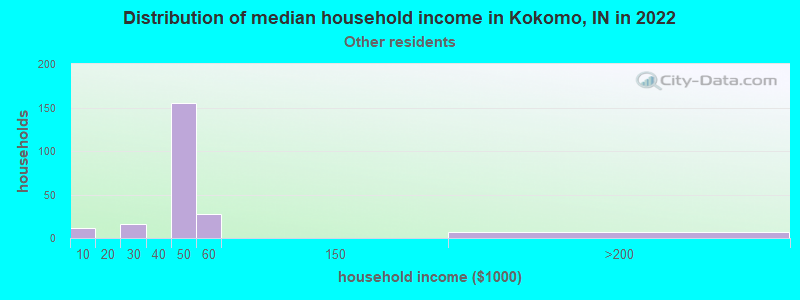
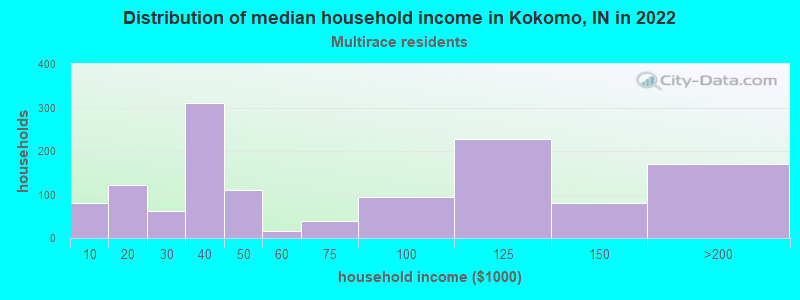
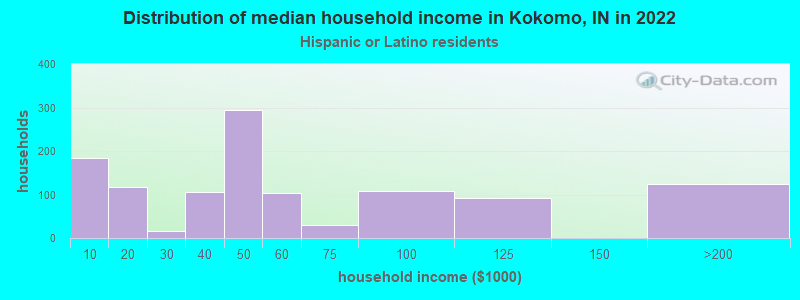
Income and house value in Kokomo Median household income in 2022 $47,825 White non-Hispanic householders$43,364 Black householders$35,369 American Indian and Alaska Native householders$47,993 Some other race householders$33,467 Hispanic or Latino race householdersMedian 2022 house value $134,934 White Non-Hispanic householders$112,985 Black or African American householders$123,959 American Indian or Alaska Native householders $331,758 Asian householders$109,206 Some other race householders$113,165 Two or more races householders$110,286 Hispanic or Latino householders
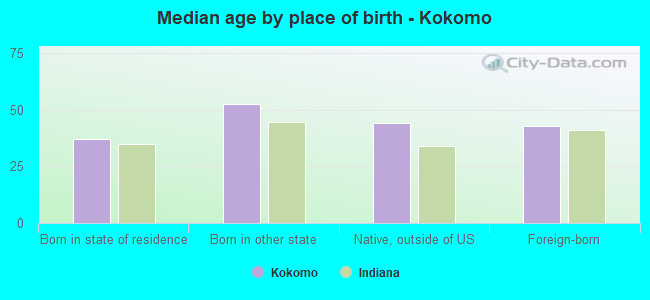
Median age by race in Kokomo
41.8 Median age for White residents39.5 44.0 41.5 Median age for Black or African American residents36.8 55.1 35.2 Median age for American Indian / Alaska Native residents31.5 33.6 44.0 Median age for Asian residents31.6 49.1 -666,666,666.0 Median age for Native Hawaiian / Pacific Islander residents-666,666,666.0 -666,666,666.0 33.0 Median age for Other race residents32.8 25.8 21.8 Median age for Two or more races residents26.0 17.5 42.5 Median age for White alone residents41.0 44.1 30.1 Median age for Hispanic or Latino residents30.0 25.4
Owner/renter occupied households by race in Kokomo
House owners and renters - White residents 15,762 69.5% Owner occupied6,909 30.5% Renter occupiedHouse owners and renters - Black or African American residents 1,359 53.8% Owner occupied1,169 46.2% Renter occupiedHouse owners and renters - American Indian / Alaska Native residents 37 27.6% Owner occupied97 72.4% Renter occupiedHouse owners and renters - Asian residents 378 67.2% Owner occupied185 32.8% Renter occupiedHouse owners and renters - Other race residents 7 3.4% Owner occupied204 96.6% Renter occupiedHouse owners and renters - Two or more races residents 476 56.3% Owner occupied369 43.7% Renter occupiedHouse owners and renters - White alone residents 15,356 70.8% Owner occupied6,320 29.2% Renter occupiedHouse owners and renters - Hispanic or Latino residents 662 46.7% Owner occupied755 53.3% Renter occupied
Language usage in Kokomo
English speakers - Total 95.2% of residents of Kokomo speak English at home.
1.6% of residents speak Spanish at home 604 68.2% Speak English very well281 31.8% Speak English less than very well2.8% of residents speak other language at home 1,222 76.8% Speak English very well369 23.2% Speak English less than very well
English speakers - Born in the United States 96.7% of residents of Kokomo speak English at home.
2.4% of residents speak Spanish at home 154 50.3% Speak English very well152 49.7% Speak English less than very well0.5% of residents speak other language at home 67 100.0% Speak English very well
English speakers - Native, born elsewhere 65.2% of residents of Kokomo speak English at home.
10.9% of residents speak Spanish at home 50 100.0% Speak English very well30.0% of residents speak other language at home 137 100.0% Speak English very well
English speakers - Foreign-born 24.5% of residents of Kokomo speak English at home.
16.8% of residents speak Spanish at home 188 65.5% Speak English very well99 34.5% Speak English less than very well57.8% of residents speak other language at home 658 66.7% Speak English very well328 33.3% Speak English less than very well
White (Caucasian) - Speak only English Native:
98.6% (44,816)Foreign-born:
26.1% (57)
White (Caucasian) - Speak another language Native:
1.5% (685)Foreign-born:
72.1% (158)
Black or African American - Speak only English Native:
98.5% (5,343)Foreign-born:
49.9% (90)
Black or African American - Speak another language Native:
1.3% (69)Foreign-born:
30.6% (55)
American Indian / Alaska Native - Speak another language Native:
99.1% (160)Foreign-born:
100.0% (95)
Asian - Speak only English Native:
42.2% (90)Foreign-born:
7.2% (57)
Asian - Speak another language Native:
58.3% (124)Foreign-born:
92.6% (730)
Other race - Speak only English Native:
82.3% (241)Foreign-born:
100.0% (192)
Other race - Speak another language Native:
22.1% (65)Foreign-born:
6.7% (13)
Two or more races - Speak only English Native:
95.2% (2,947)Foreign-born:
35.2% (72)
Two or more races - Speak another language Native:
2.3% (72)Foreign-born:
66.5% (135)
White alone - Speak only English Native:
98.6% (44,036)Foreign-born:
38.9% (64)
White alone - Speak another language Native:
1.3% (588)Foreign-born:
61.3% (100)
Hispanic or Latino - Speak only English Native:
80.1% (1,597)Foreign-born:
36.2% (168)
Hispanic or Latino - Speak another language Native:
18.4% (366)Foreign-born:
64.9% (302)
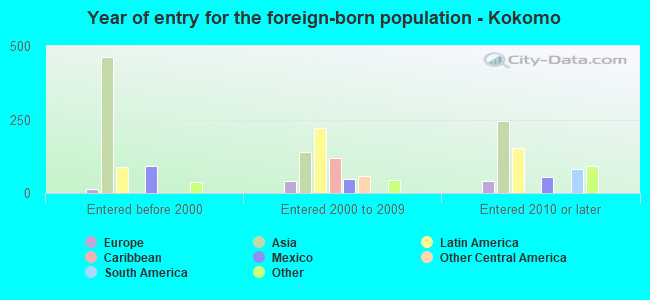
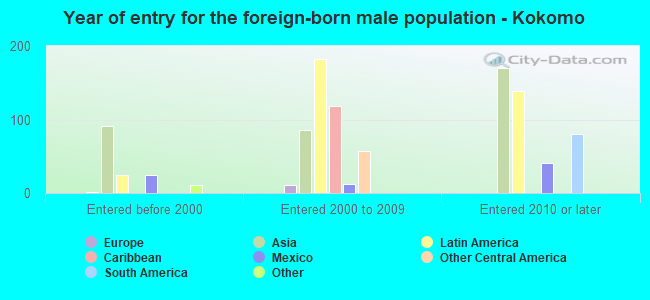
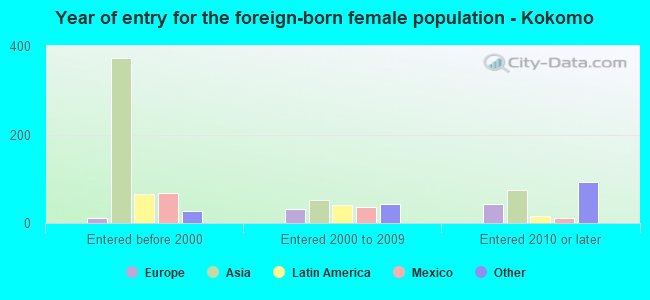
Foreign-born residents in Kokomo 1,700 residents are foreign born (1.5% Asia , 0.7% Latin America ).
This city:
2.9%Indiana:
5.6%
Marital status for residents in Kokomo Marital status - White (Caucasian) population 15 years and over
Males 34.2% Never married46.0% Now married1.4% Separated4.2% Widowed14.2% DivorcedFemales 25.4% Never married40.5% Now married1.2% Separated14.0% Widowed18.9% DivorcedWomen who gave birth in the past 12 months Now married:
43.7% (283)Unmarried:
56.3% (364)
Women who did not give birth in the past 12 months Now married:
41.3% (4,201)Unmarried:
58.7% (5,966)
Marital status - Black or African American population 15 years and over
Males 58.6% Never married25.8% Now married1.1% Separated7.6% Widowed6.9% DivorcedFemales 47.0% Never married19.8% Now married0.0% Separated6.4% Widowed26.8% DivorcedWomen who gave birth in the past 12 months Now married:
0.0% (0)Unmarried:
100.0% (137)
Women who did not give birth in the past 12 months Now married:
16.6% (211)Unmarried:
83.4% (1,060)
Marital status - American Indian / Alaska Native population 15 years and over
Males 60.0% Never married40.0% Now married0.0% Separated0.0% Widowed0.0% DivorcedFemales 0.0% Never married34.0% Now married0.0% Separated33.0% Widowed33.0% DivorcedWomen who did not give birth in the past 12 months Now married:
50.8% (75)Unmarried:
49.2% (73)
Marital status - Asian population 15 years and over
Males 61.3% Never married30.9% Now married0.0% Separated0.0% Widowed7.8% DivorcedFemales 10.2% Never married37.6% Now married48.6% Separated0.0% Widowed3.7% DivorcedWomen who did not give birth in the past 12 months Now married:
70.9% (182)Unmarried:
29.1% (75)
Marital status - Other race population 15 years and over
Males 58.7% Never married28.0% Now married0.0% Separated0.0% Widowed13.3% DivorcedFemales 94.5% Never married5.5% Now married0.0% Separated0.0% Widowed0.0% DivorcedWomen who gave birth in the past 12 months Now married:
0.0% (0)Unmarried:
100.0% (13)
Women who did not give birth in the past 12 months Now married:
0.0% (0)Unmarried:
100.0% (112)
Marital status - Two or more races population 15 years and over
Males 56.3% Never married35.8% Now married2.5% Separated0.1% Widowed5.2% DivorcedFemales 47.8% Never married19.0% Now married0.0% Separated5.8% Widowed27.5% DivorcedWomen who did not give birth in the past 12 months Now married:
21.4% (202)Unmarried:
78.6% (745)
Marital status - White alone, not Hispanic / Latino population 15 years and over
Males 33.7% Never married46.6% Now married1.5% Separated4.3% Widowed14.0% DivorcedFemales 25.0% Never married40.8% Now married1.3% Separated13.7% Widowed19.1% DivorcedWomen who gave birth in the past 12 months Now married:
43.7% (286)Unmarried:
56.3% (369)
Women who did not give birth in the past 12 months Now married:
41.5% (4,115)Unmarried:
58.5% (5,812)
Marital status - Hispanic or Latino population 15 years and over
Males 54.2% Never married30.0% Now married0.0% Separated0.0% Widowed15.8% DivorcedFemales 44.3% Never married18.5% Now married0.0% Separated18.2% Widowed18.9% DivorcedWomen who gave birth in the past 12 months Now married:
0.0% (0)Unmarried:
100.0% (12)
Women who did not give birth in the past 12 months Now married:
28.0% (194)Unmarried:
72.0% (500)
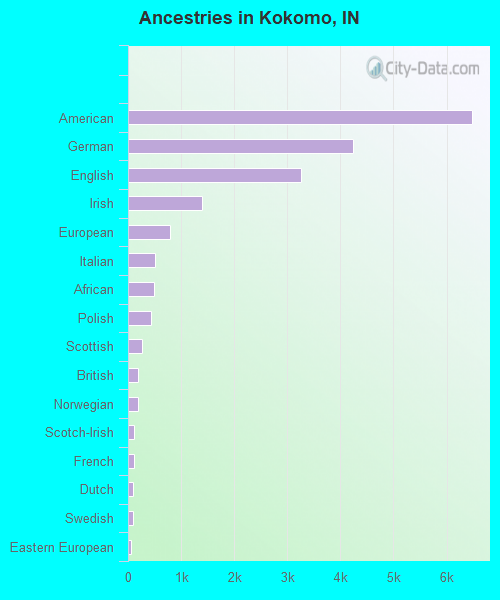
Ancestries in Kokomo
6,476 21.9% American4,238 14.3% German3,256 11.0% English1,401 4.7% Irish784 2.6% European501 1.7% Italian487 1.6% African426 1.4% Polish259 0.9% Scottish192 0.6% British181 0.6% Norwegian119 0.4% Scotch-Irish104 0.4% French99 0.3% Dutch86 0.3% Swedish59 0.2% Eastern European52 0.2% Nigerian52 0.2% Romanian51 0.2% Russian46 0.2% Iranian23 0.08% Scandinavian22 0.07% Cajun18 0.06% Austrian17 0.06% Danish12 0.04% Belgian12 0.04% Swiss11 0.04% Bulgarian10 0.03% Slovene10 0.03% Ethiopian9 0.03% Czechoslovakian9 0.03% Hungarian8 0.03% French Canadian7 0.02% Welsh5 0.02% Moroccan
Geographical mobility in Kokomo Same house 1 year ago 42,147 87.0% White (Caucasian)5,105 82.9% Black or African American252 86.2% American Indian / Alaska Native883 87.7% Asian6 100.0% Native Hawaiian / Pacific Islander400 66.4% Other race3,241 83.7% Two or more races40,887 87.8% White alone, not Hispanic / Latino1,854 69.8% Hispanic or LatinoMoved within same county 3,214 6.6% White / Caucasian821 13.3% Black or African American107 10.7% Asian447 11.5% Two or more races2,975 6.4% White alone, not Hispanic / Latino302 11.4% Hispanic or LatinoMoved within same state 2,259 4.7% White / Caucasian224 3.6% Black or African American179 29.6% Other race114 2.9% Two or more races1,952 4.2% White alone, not Hispanic / Latino384 14.5% Hispanic or LatinoMoved from different state 212 0.4% White / Caucasian20 0.3% Black or African American16 5.6% American Indian / Alaska Native62 1.6% Two or more races408 0.9% White alone, not Hispanic / Latino68 2.6% Hispanic or LatinoMoved from abroad 68 0.1% White67 0.1% White alone, not Hispanic / Latino
Children Nativity (place of birth) in Kokomo
Children under 6 years - Living with two parents Both parents native 2,069 100.0% NativeBoth parents foreign-born 15 100.0% NativeOne native, one foreign-born parent 32 100.0% NativeChildren under 6 years - Living with one parent Native parent 1,363 100.0% NativeChildren 6 to 17 years - Living with two parents Both parents native 4,606 100.0% NativeBoth parents foreign-born 32 100.0% NativeOne native, one foreign-born parent 231 100.0% NativeChildren 6 to 17 years - Living with one parent Native parent 3,860 100.0% NativeForeign-born parent 120 54.1% Native102 45.9% Foreign-born
Grandparents responsible for own grandchildren in Kokomo
Grandparents (30 to 59 years) White / Caucasian 131 38.9% Responsible for grandchildren206 61.1% Not responsible for grandchildrenBlack or African American 41 75.1% Responsible for grandchildren14 24.9% Not responsible for grandchildrenTwo or more races 9 100.0% Not responsible for grandchildrenWhite alone, not Hispanic / Latino 119 35.4% Responsible for grandchildren218 64.6% Not responsible for grandchildrenHispanic or Latino 21 100.0% Responsible for grandchildrenGrandparents (60 years and over) White / Caucasian 59 10.4% Responsible for grandchildren502 89.6% Not responsible for grandchildrenBlack or African American 36 45.3% Responsible for grandchildren44 54.7% Not responsible for grandchildrenTwo or more races 12 100.0% Responsible for grandchildrenWhite alone, not Hispanic / Latino 59 10.4% Responsible for grandchildren511 89.6% Not responsible for grandchildrenHispanic or Latino 4 100.0% Responsible for grandchildren