Races in La Belle, Florida (FL) Detailed Stats
Ancestries, Foreign-born residents, place of birth
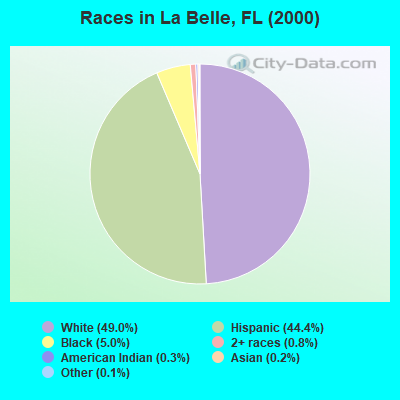
Race distribution in La Belle

- 8,82249.0%White alone
- 7,99444.4%Hispanic
- 9085.0%Black alone
- 1500.8%Two or more races
- 550.3%American Indian alone
- 420.2%Asian alone
- 200.1%Other race alone
- 10.01%Native Hawaiian and Other
Pacific Islander alone
2000
2022
-
- 10,458,50965.4%White alone
- 2,682,71516.8%Hispanic
- 2,264,26814.2%Black alone
- 261,6931.6%Asian alone
- 236,9541.5%Two or more races
- 42,3580.3%American Indian alone
- 28,9940.2%Other race alone
- 6,8870.04%Native Hawaiian and Other
Pacific Islander alone

-
- 11,309,40350.8%White alone
- 6,025,03927.1%Hispanic
- 3,241,01514.6%Black alone
- 861,6303.9%Two or more races
- 623,6922.8%Asian alone
- 152,0540.7%Other race alone
- 22,5040.1%American Indian alone
- 9,4860.04%Native Hawaiian and Other
Pacific Islander alone

Income and house value in La Belle
- Median household income in 2022
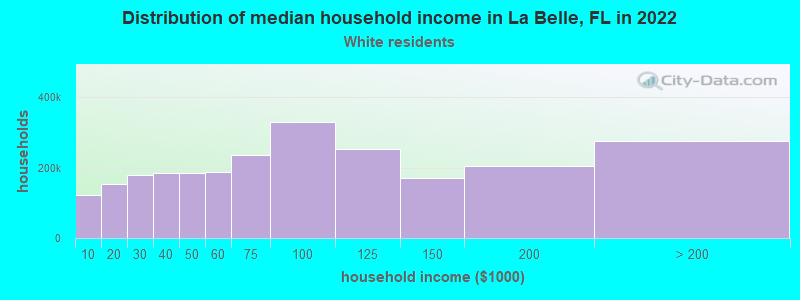
- $67,722White non-Hispanic householders
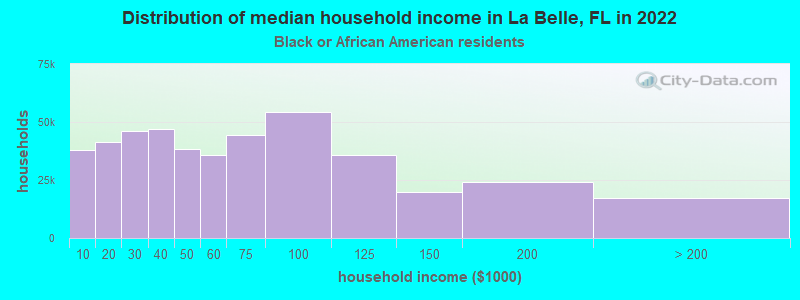
- $36,805Black householders
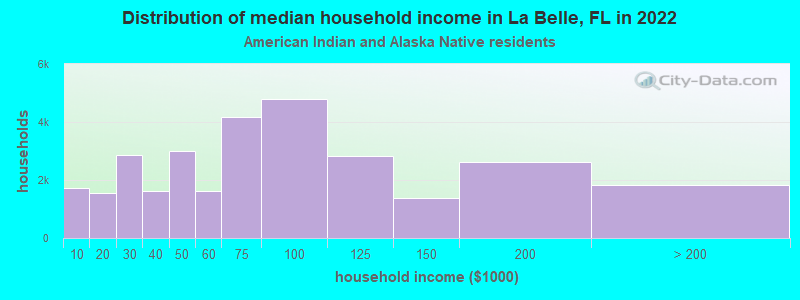
- $93,286American Indian and Alaska Native householders
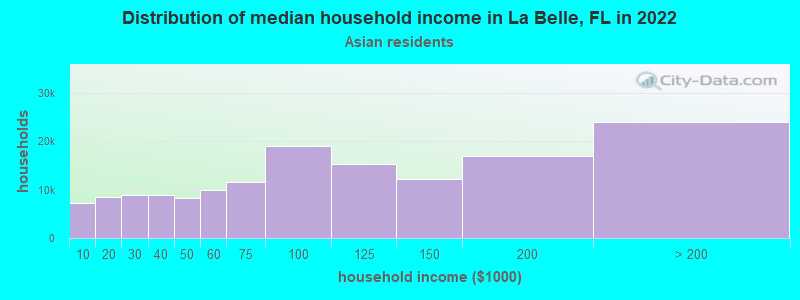
- $111,161Asian householders
- $48,815Some other race householders
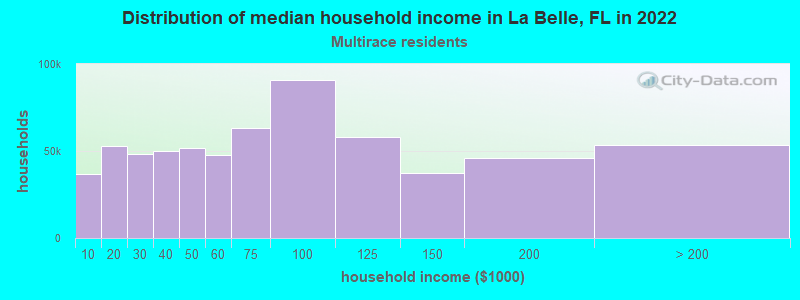
- $60,470Two or more races householders
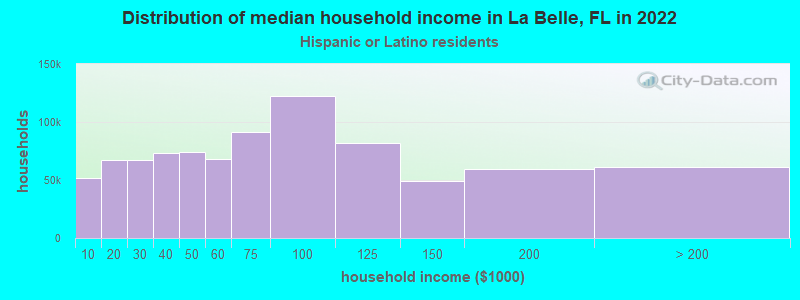
- $55,589Hispanic or Latino race householders
- Median 2022 house value
- $251,584White Non-Hispanic householders
- $156,789Black or African American householders
- over $1,000,000American Indian or Alaska Native householders
- $389,676Asian householders
- $225,343Some other race householders
- $184,670Two or more races householders
- $210,582Hispanic or Latino householders
Household income for White non-Hispanic householders
Household income for Black householders
Household income for American Indian and Alaska Native householders
Household income for Asian householders
Household income for Two or more races householders
Household income for Hispanic or Latino race householders
Zip code: 33935