Races in La Crosse, Wisconsin (WI) Detailed Stats
Data:
Races - White alone (%)
Races - White alone (% change since 2000)
Races - Black alone (%)
Races - Black alone (% change since 2000)
Races - American Indian alone (%)
Races - American Indian alone (% change since 2000)
Races - Asian alone (%)
Races - Asian alone (% change since 2000)
Races - Hispanic (%)
Races - Hispanic (% change since 2000)
Races - Native Hawaiian and Other Pacific Islander alone (%)
Races - Native Hawaiian and Other Pacific Islander alone (% change since 2000)
Races - Two or more races(%)
Races - Two or more races(% change since 2000)
Races - Other race alone (%)
Races - Other race alone (% change since 2000)
Racial diversity
Place of birth - Born in state of residence (%)
Place of birth - Born in state of residence (%) - White
Place of birth - Born in state of residence (%) - Black or African American
Place of birth - Born in state of residence (%) - Asian
Place of birth - Born in state of residence (%) - Hispanic or Latino
Place of birth - Born in state of residence (%) - American Indian and Alaska Native
Place of birth - Born in state of residence (%) - Multirace
Place of birth - Born in state of residence (%) - Other Race
Place of birth - Born in other state (%)
Place of birth - Born in other state (%) - White
Place of birth - Born in other state (%) - Black or African American
Place of birth - Born in other state (%) - Asian
Place of birth - Born in other state (%) - Hispanic or Latino
Place of birth - Born in other state (%) - American Indian and Alaska Native
Place of birth - Born in other state (%) - Multirace
Place of birth - Born in other state (%) - Other Race
Place of birth - Native, outside of US (%)
Place of birth - Native, outside of US (%) - White
Place of birth - Native, outside of US (%) - Black or African American
Place of birth - Native, outside of US (%) - Asian
Place of birth - Native, outside of US (%) - Hispanic or Latino
Place of birth - Native, outside of US (%) - American Indian and Alaska Native
Place of birth - Native, outside of US (%) - Multirace
Place of birth - Native, outside of US (%) - Other Race
Place of birth - Foreign born (%)
Place of birth - Foreign born (%) - White
Place of birth - Foreign born (%) - Black or African American
Place of birth - Foreign born (%) - Asian
Place of birth - Foreign born (%) - Hispanic or Latino
Place of birth - Foreign born (%) - American Indian and Alaska Native
Place of birth - Foreign born (%) - Multirace
Place of birth - Foreign born (%) - Other Race
Residents speaking English at home (%)
Residents speaking English at home - Born in the United States (%)
Residents speaking English at home - Native, born elsewhere (%)
Residents speaking English at home - Foreign born (%)
Residents speaking Spanish at home (%)
Residents speaking Spanish at home - Born in the United States (%)
Residents speaking Spanish at home - Native, born elsewhere (%)
Residents speaking Spanish at home - Foreign born (%)
Residents speaking other language at home (%)
Residents speaking other language at home - Born in the United States (%)
Residents speaking other language at home - Native, born elsewhere (%)
Residents speaking other language at home - Foreign born (%)
Marital status - Never married (%)
Marital status - Now married (%)
Marital status - Separated (%)
Marital status - Widowed (%)
Marital status - Divorced (%)
Ancestries Reported - Arab (%)
Ancestries Reported - Czech (%)
Ancestries Reported - Danish (%)
Ancestries Reported - Dutch (%)
Ancestries Reported - English (%)
Ancestries Reported - French (%)
Ancestries Reported - French Canadian (%)
Ancestries Reported - German (%)
Ancestries Reported - Greek (%)
Ancestries Reported - Hungarian (%)
Ancestries Reported - Irish (%)
Ancestries Reported - Italian (%)
Ancestries Reported - Lithuanian (%)
Ancestries Reported - Norwegian (%)
Ancestries Reported - Polish (%)
Ancestries Reported - Portuguese (%)
Ancestries Reported - Russian (%)
Ancestries Reported - Scotch-Irish (%)
Ancestries Reported - Scottish (%)
Ancestries Reported - Slovak (%)
Ancestries Reported - Subsaharan African (%)
Ancestries Reported - Swedish (%)
Ancestries Reported - Swiss (%)
Ancestries Reported - Ukrainian (%)
Ancestries Reported - United States (%)
Ancestries Reported - Welsh (%)
Ancestries Reported - West Indian (%)
Ancestries Reported - Other (%)
Geographical mobility - Same house 1 year ago (%)
Geographical mobility - Same house 1 year ago (%) - White
Geographical mobility - Same house 1 year ago (%) - Black or African American
Geographical mobility - Same house 1 year ago (%) - Asian
Geographical mobility - Same house 1 year ago (%) - Hispanic or Latino
Geographical mobility - Same house 1 year ago (%) - American Indian and Alaska Native
Geographical mobility - Same house 1 year ago (%) - Multirace
Geographical mobility - Same house 1 year ago (%) - Other Race
Geographical mobility - Moved within same county (%)
Geographical mobility - Moved within same county (%) - White
Geographical mobility - Moved within same county (%) - Black or African American
Geographical mobility - Moved within same county (%) - Asian
Geographical mobility - Moved within same county (%) - Hispanic or Latino
Geographical mobility - Moved within same county (%) - American Indian and Alaska Native
Geographical mobility - Moved within same county (%) - Multirace
Geographical mobility - Moved within same county (%) - Other Race
Geographical mobility - Moved from different county within same state (%)
Geographical mobility - Moved from different county within same state (%) - White
Geographical mobility - Moved from different county within same state (%) - Black or African American
Geographical mobility - Moved from different county within same state (%) - Asian
Geographical mobility - Moved from different county within same state (%) - Hispanic or Latino
Geographical mobility - Moved from different county within same state (%) - American Indian and Alaska Native
Geographical mobility - Moved from different county within same state (%) - Multirace
Geographical mobility - Moved from different county within same state (%) - Other Race
Geographical mobility - Moved from different state (%)
Geographical mobility - Moved from different state (%) - White
Geographical mobility - Moved from different state (%) - Black or African American
Geographical mobility - Moved from different state (%) - Asian
Geographical mobility - Moved from different state (%) - Hispanic or Latino
Geographical mobility - Moved from different state (%) - American Indian and Alaska Native
Geographical mobility - Moved from different state (%) - Multirace
Geographical mobility - Moved from different state (%) - Other Race
Geographical mobility - Moved from abroad (%)
Geographical mobility - Moved from abroad (%) - White
Geographical mobility - Moved from abroad (%) - Black or African American
Geographical mobility - Moved from abroad (%) - Asian
Geographical mobility - Moved from abroad (%) - Hispanic or Latino
Geographical mobility - Moved from abroad (%) - American Indian and Alaska Native
Geographical mobility - Moved from abroad (%) - Multirace
Geographical mobility - Moved from abroad (%) - Other Race
Place of birth for the foreign-born population - Ireland (%)
Place of birth for the foreign-born population - Denmark (%)
Place of birth for the foreign-born population - Norway (%)
Place of birth for the foreign-born population - Sweden (%)
Place of birth for the foreign-born population - United Kingdom (%)
Place of birth for the foreign-born population - England (%)
Place of birth for the foreign-born population - Scotland (%)
Place of birth for the foreign-born population - Other Northern Europe (%)
Place of birth for the foreign-born population - Austria (%)
Place of birth for the foreign-born population - Belgium (%)
Place of birth for the foreign-born population - France (%)
Place of birth for the foreign-born population - Germany (%)
Place of birth for the foreign-born population - Netherlands (%)
Place of birth for the foreign-born population - Switzerland (%)
Place of birth for the foreign-born population - Other Western Europe (%)
Place of birth for the foreign-born population - Greece (%)
Place of birth for the foreign-born population - Italy (%)
Place of birth for the foreign-born population - Portugal (%)
Place of birth for the foreign-born population - Spain (%)
Place of birth for the foreign-born population - Other Southern Europe (%)
Place of birth for the foreign-born population - Albania (%)
Place of birth for the foreign-born population - Belarus (%)
Place of birth for the foreign-born population - Bosnia and Herzegovina (%)
Place of birth for the foreign-born population - Bulgaria (%)
Place of birth for the foreign-born population - Croatia (%)
Place of birth for the foreign-born population - Czechoslovakia (%)
Place of birth for the foreign-born population - Hungary (%)
Place of birth for the foreign-born population - Latvia (%)
Place of birth for the foreign-born population - Lithuania (%)
Place of birth for the foreign-born population - North Macedonia (Macedonia) (%)
Place of birth for the foreign-born population - Moldova (%)
Place of birth for the foreign-born population - Poland (%)
Place of birth for the foreign-born population - Romania (%)
Place of birth for the foreign-born population - Russia (%)
Place of birth for the foreign-born population - Serbia (%)
Place of birth for the foreign-born population - Ukraine (%)
Place of birth for the foreign-born population - Other Eastern Europe (%)
Place of birth for the foreign-born population - China (%)
Place of birth for the foreign-born population - Hong Kong (%)
Place of birth for the foreign-born population - Taiwan (%)
Place of birth for the foreign-born population - Japan (%)
Place of birth for the foreign-born population - Korea (%)
Place of birth for the foreign-born population - Other Eastern Asia (%)
Place of birth for the foreign-born population - Afghanistan (%)
Place of birth for the foreign-born population - Bangladesh (%)
Place of birth for the foreign-born population - India (%)
Place of birth for the foreign-born population - Iran (%)
Place of birth for the foreign-born population - Kazakhstan (%)
Place of birth for the foreign-born population - Nepal (%)
Place of birth for the foreign-born population - Pakistan (%)
Place of birth for the foreign-born population - Sri Lanka (%)
Place of birth for the foreign-born population - Uzbekistan (%)
Place of birth for the foreign-born population - Other South Central Asia (%)
Place of birth for the foreign-born population - Burma (%)
Place of birth for the foreign-born population - Cambodia (%)
Place of birth for the foreign-born population - Indonesia (%)
Place of birth for the foreign-born population - Laos (%)
Place of birth for the foreign-born population - Malaysia (%)
Place of birth for the foreign-born population - Philippines (%)
Place of birth for the foreign-born population - Singapore (%)
Place of birth for the foreign-born population - Thailand (%)
Place of birth for the foreign-born population - Vietnam (%)
Place of birth for the foreign-born population - Other South Eastern Asia (%)
Place of birth for the foreign-born population - Armenia (%)
Place of birth for the foreign-born population - Iraq (%)
Place of birth for the foreign-born population - Israel (%)
Place of birth for the foreign-born population - Jordan (%)
Place of birth for the foreign-born population - Kuwait (%)
Place of birth for the foreign-born population - Lebanon (%)
Place of birth for the foreign-born population - Saudi Arabia (%)
Place of birth for the foreign-born population - Syria (%)
Place of birth for the foreign-born population - Turkey (%)
Place of birth for the foreign-born population - Yemen (%)
Place of birth for the foreign-born population - Other Western Asia (%)
Place of birth for the foreign-born population - Eritrea (%)
Place of birth for the foreign-born population - Ethiopia (%)
Place of birth for the foreign-born population - Kenya (%)
Place of birth for the foreign-born population - Somalia (%)
Place of birth for the foreign-born population - Uganda (%)
Place of birth for the foreign-born population - Zimbabwe (%)
Place of birth for the foreign-born population - Other Eastern Africa (%)
Place of birth for the foreign-born population - Cameroon (%)
Place of birth for the foreign-born population - Congo (%)
Place of birth for the foreign-born population - Democratic Republic of Congo (Zaire) (%)
Place of birth for the foreign-born population - Other Middle Africa (%)
Place of birth for the foreign-born population - Egypt (%)
Place of birth for the foreign-born population - Morocco (%)
Place of birth for the foreign-born population - Sudan (%)
Place of birth for the foreign-born population - Other Northern Africa (%)
Place of birth for the foreign-born population - South Africa (%)
Place of birth for the foreign-born population - Other Southern Africa (%)
Place of birth for the foreign-born population - Cabo Verde (%)
Place of birth for the foreign-born population - Ghana (%)
Place of birth for the foreign-born population - Liberia (%)
Place of birth for the foreign-born population - Nigeria (%)
Place of birth for the foreign-born population - Senegal (%)
Place of birth for the foreign-born population - Sierra Leone (%)
Place of birth for the foreign-born population - Other Western Africa (%)
Place of birth for the foreign-born population - Australia (%)
Place of birth for the foreign-born population - New Zealand (%)
Place of birth for the foreign-born population - Fiji (%)
Place of birth for the foreign-born population - Micronesia (%)
Place of birth for the foreign-born population - Bahamas (%)
Place of birth for the foreign-born population - Barbados (%)
Place of birth for the foreign-born population - Cuba (%)
Place of birth for the foreign-born population - Dominica (%)
Place of birth for the foreign-born population - Dominican Republic (%)
Place of birth for the foreign-born population - Grenada (%)
Place of birth for the foreign-born population - Haiti (%)
Place of birth for the foreign-born population - Jamaica (%)
Place of birth for the foreign-born population - St. Vincent and the Grenadines (%)
Place of birth for the foreign-born population - Trinidad and Tobago (%)
Place of birth for the foreign-born population - West Indies (%)
Place of birth for the foreign-born population - Other Caribbean (%)
Place of birth for the foreign-born population - Belize (%)
Place of birth for the foreign-born population - Costa Rica (%)
Place of birth for the foreign-born population - El Salvador (%)
Place of birth for the foreign-born population - Guatemala (%)
Place of birth for the foreign-born population - Honduras (%)
Place of birth for the foreign-born population - Mexico (%)
Place of birth for the foreign-born population - Nicaragua (%)
Place of birth for the foreign-born population - Panama (%)
Place of birth for the foreign-born population - Other Central America (%)
Place of birth for the foreign-born population - Argentina (%)
Place of birth for the foreign-born population - Bolivia (%)
Place of birth for the foreign-born population - Brazil (%)
Place of birth for the foreign-born population - Chile (%)
Place of birth for the foreign-born population - Colombia (%)
Place of birth for the foreign-born population - Ecuador (%)
Place of birth for the foreign-born population - Guyana (%)
Place of birth for the foreign-born population - Peru (%)
Place of birth for the foreign-born population - Uruguay (%)
Place of birth for the foreign-born population - Venezuela (%)
Place of birth for the foreign-born population - Other South America (%)
Place of birth for the foreign-born population - Canada (%)
Place of birth for the foreign-born population - Other Northern America (%)
Place of birth for the foreign-born population - Other (%)
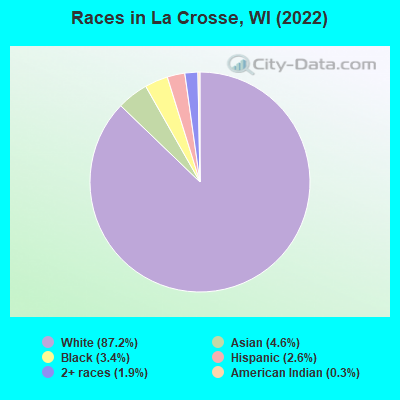
According to 2022 data, the most numerous races in La Crosse, WI are White alone (45,420 residents), Hispanic (1,359 residents), and Black alone (1,762 residents). 94.2% of La Crosse residents speak English at home. 2.6% of La Crosse, WI residents are foreign-born (1.7% born in Asia, 0.3% born in Latin America, 0.3% born in Europe), which is 92.9% less than the foreign-born rate of 5.0% across the entire state of Wisconsin.
Race distribution in La Crosse
2000 2022
4,681,630 87.3% White alone 300,245 5.6% Black alone 192,921 3.6% Hispanic 87,995 1.6% Asian alone 51,921 1.0% Two or more races 43,980 0.8% American Indian alone 3,637 0.07% Other race alone 1,346 0.03% Native Hawaiian and Other
4,654,031 79.0% White alone 447,022 7.6% Hispanic 345,678 5.9% Black alone 217,532 3.7% Two or more races 172,242 2.9% Asian alone 33,762 0.6% American Indian alone 19,680 0.3% Other race alone 2,592 0.04% Native Hawaiian and Other
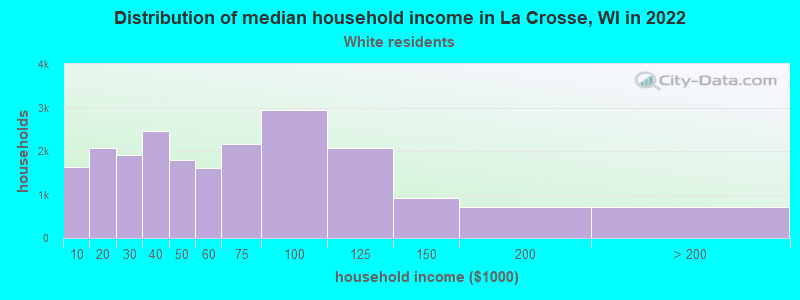
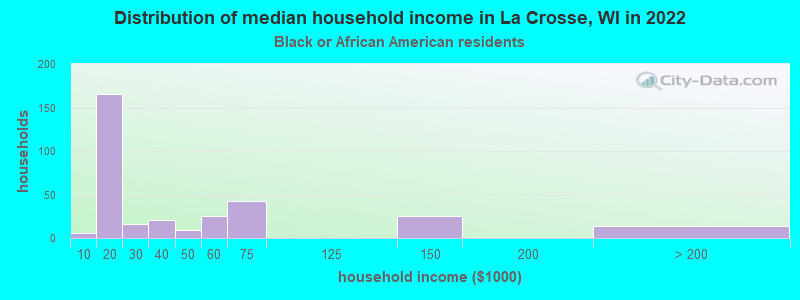
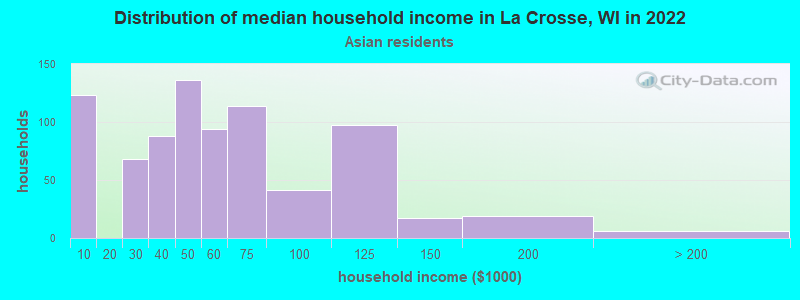
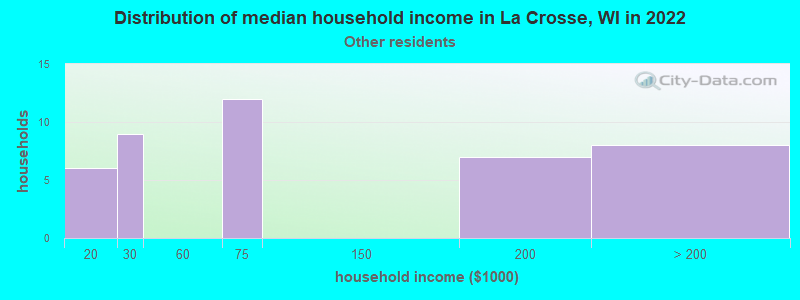
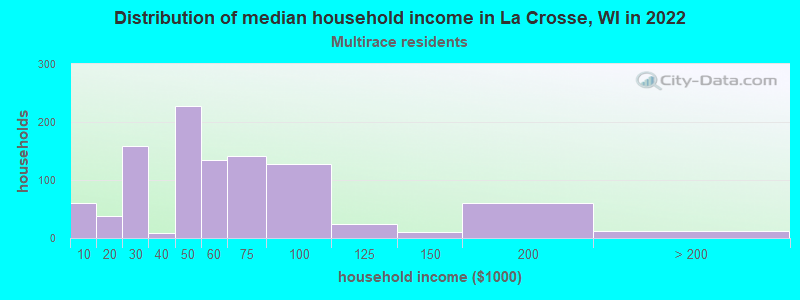
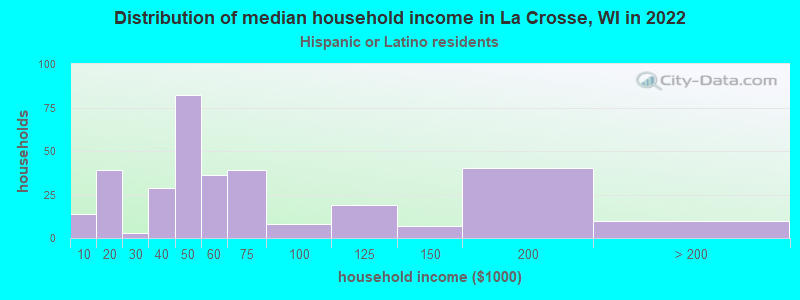
Income and house value in La Crosse Median household income in 2022 $53,485 White non-Hispanic householders$74,830 Asian householders$38,168 Two or more races householders$63,157 Hispanic or Latino race householdersMedian 2022 house value $191,374 White Non-Hispanic householders$101,196 Black or African American householders$243,547 American Indian or Alaska Native householders $233,877 Asian householders$146,173 Some other race householders$138,077 Two or more races householders$149,996 Hispanic or Latino householders
Median age by race in La Crosse
31.9 Median age for White residents33.4 30.0 20.9 Median age for Black or African American residents19.3 33.4 28.9 Median age for American Indian / Alaska Native residents21.6 35.4 22.0 Median age for Asian residents17.6 26.2 -825,688,072.6 Median age for Native Hawaiian / Pacific Islander residents-666,666,666.0 -732,444,443.7 30.2 Median age for Other race residents28.2 34.4 32.9 Median age for Two or more races residents30.7 37.2 32.0 Median age for White alone residents33.6 30.1 28.5 Median age for Hispanic or Latino residents18.0 29.2
Owner/renter occupied households by race in La Crosse
House owners and renters - White residents 9,785 46.4% Owner occupied11,298 53.6% Renter occupiedHouse owners and renters - Black or African American residents 63 9.4% Owner occupied608 90.6% Renter occupiedHouse owners and renters - American Indian / Alaska Native residents 20 28.7% Owner occupied51 71.3% Renter occupiedHouse owners and renters - Asian residents 228 31.1% Owner occupied505 68.9% Renter occupiedHouse owners and renters - Other race residents 27 65.4% Owner occupied14 34.6% Renter occupiedHouse owners and renters - Two or more races residents 437 57.0% Owner occupied330 43.0% Renter occupiedHouse owners and renters - White alone residents 9,746 46.7% Owner occupied11,108 53.3% Renter occupiedHouse owners and renters - Hispanic or Latino residents 64 12.4% Owner occupied453 87.6% Renter occupied
Language usage in La Crosse
English speakers - Total 94.2% of residents of La Crosse speak English at home.
2.0% of residents speak Spanish at home 729 71.9% Speak English very well285 28.1% Speak English less than very well3.7% of residents speak other language at home 1,235 65.7% Speak English very well646 34.3% Speak English less than very well
English speakers - Born in the United States 96.4% of residents of La Crosse speak English at home.
1.4% of residents speak Spanish at home 79 45.9% Speak English very well93 54.1% Speak English less than very well1.3% of residents speak other language at home 126 82.9% Speak English very well26 17.1% Speak English less than very well
English speakers - Native, born elsewhere 58.6% of residents of La Crosse speak English at home.
7.0% of residents speak Spanish at home 17 47.2% Speak English very well19 52.8% Speak English less than very well6.6% of residents speak other language at home 34 100.0% Speak English very well
English speakers - Foreign-born 29.3% of residents of La Crosse speak English at home.
18.4% of residents speak Spanish at home 250 86.8% Speak English very well38 13.2% Speak English less than very well56.3% of residents speak other language at home 417 47.2% Speak English very well467 52.8% Speak English less than very well
White (Caucasian) - Speak only English Native:
97.8% (42,970)Foreign-born:
40.0% (141)
White (Caucasian) - Speak another language Native:
2.2% (965)Foreign-born:
62.7% (221)
Black or African American - Speak only English Native:
94.6% (854)Foreign-born:
61.3% (56)
Black or African American - Speak another language Native:
4.0% (36)Foreign-born:
23.4% (21)
Asian - Speak only English Native:
70.6% (975)Foreign-born:
27.6% (266)
Asian - Speak another language Native:
28.3% (390)Foreign-born:
69.4% (669)
Other race - Speak another language Native:
39.7% (54)Foreign-born:
98.8% (88)
Two or more races - Speak another language Native:
14.3% (338)Foreign-born:
100.0% (98)
White alone - Speak only English Native:
98.0% (42,579)Foreign-born:
40.9% (141)
White alone - Speak another language Native:
2.0% (862)Foreign-born:
61.5% (211)
Hispanic or Latino - Speak another language Native:
53.9% (564)Foreign-born:
100.0% (250)
Foreign-born residents in La Crosse 1,350 residents are foreign born (1.7% Asia , 0.3% Latin America , 0.3% Europe ).
This city:
2.6%Wisconsin:
5.0%
Marital status for residents in La Crosse Marital status - White (Caucasian) population 15 years and over
Males 53.8% Never married31.8% Now married0.9% Separated2.6% Widowed10.9% DivorcedFemales 52.2% Never married27.3% Now married0.2% Separated9.0% Widowed11.3% DivorcedWomen who gave birth in the past 12 months Now married:
86.0% (306)Unmarried:
14.0% (50)
Women who did not give birth in the past 12 months Now married:
19.8% (2,761)Unmarried:
80.2% (11,174)
Marital status - Black or African American population 15 years and over
Males 75.3% Never married17.8% Now married4.3% Separated0.0% Widowed2.6% DivorcedFemales 67.7% Never married22.6% Now married1.9% Separated3.1% Widowed4.7% DivorcedWomen who gave birth in the past 12 months Now married:
90.9% (19)Unmarried:
9.1% (2)
Women who did not give birth in the past 12 months Now married:
26.2% (36)Unmarried:
73.8% (100)
Marital status - American Indian / Alaska Native population 15 years and over
Males 74.3% Never married0.0% Now married0.0% Separated0.0% Widowed25.7% DivorcedFemales 52.7% Never married14.9% Now married0.0% Separated0.0% Widowed32.4% DivorcedWomen who did not give birth in the past 12 months Now married:
0.0% (0)Unmarried:
100.0% (35)
Marital status - Asian population 15 years and over
Males 59.3% Never married29.4% Now married6.4% Separated0.0% Widowed4.9% DivorcedFemales 51.9% Never married35.8% Now married1.7% Separated7.6% Widowed3.0% DivorcedWomen who gave birth in the past 12 months Now married:
100.0% (88)Unmarried:
0.0% (0)
Women who did not give birth in the past 12 months Now married:
31.1% (200)Unmarried:
68.9% (443)
Marital status - Other race population 15 years and over
Males 64.9% Never married35.1% Now married0.0% Separated0.0% Widowed0.0% DivorcedFemales 74.0% Never married26.0% Now married0.0% Separated0.0% Widowed0.0% DivorcedWomen who did not give birth in the past 12 months Now married:
0.0% (0)Unmarried:
100.0% (34)
Marital status - Two or more races population 15 years and over
Males 64.1% Never married23.2% Now married9.8% Separated0.0% Widowed2.8% DivorcedFemales 62.2% Never married24.1% Now married0.0% Separated1.3% Widowed12.4% DivorcedWomen who gave birth in the past 12 months Now married:
23.8% (15)Unmarried:
76.2% (48)
Women who did not give birth in the past 12 months Now married:
16.7% (109)Unmarried:
83.3% (541)
Marital status - White alone, not Hispanic / Latino population 15 years and over
Males 53.9% Never married31.6% Now married0.9% Separated2.7% Widowed11.0% DivorcedFemales 52.4% Never married27.0% Now married0.2% Separated9.1% Widowed11.2% DivorcedWomen who gave birth in the past 12 months Now married:
86.0% (303)Unmarried:
14.0% (50)
Women who did not give birth in the past 12 months Now married:
19.2% (2,614)Unmarried:
80.8% (10,986)
Marital status - Hispanic or Latino population 15 years and over
Males 59.1% Never married40.9% Now married0.0% Separated0.0% Widowed0.0% DivorcedFemales 48.5% Never married42.1% Now married0.0% Separated0.0% Widowed9.3% DivorcedWomen who gave birth in the past 12 months Now married:
100.0% (12)Unmarried:
0.0% (0)
Women who did not give birth in the past 12 months Now married:
43.8% (166)Unmarried:
56.2% (212)
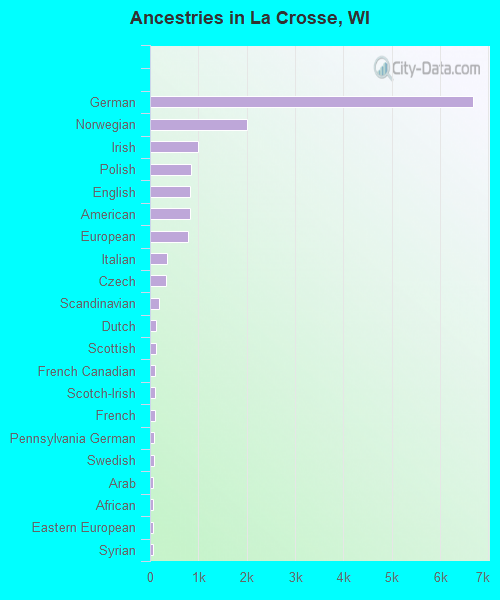
Ancestries in La Crosse
6,678 34.2% German2,004 10.3% Norwegian995 5.1% Irish853 4.4% Polish823 4.2% English821 4.2% American793 4.1% European345 1.8% Italian334 1.7% Czech179 0.9% Scandinavian132 0.7% Dutch128 0.7% Scottish104 0.5% French Canadian96 0.5% Scotch-Irish94 0.5% French80 0.4% Pennsylvania German73 0.4% Swedish68 0.3% Arab67 0.3% African67 0.3% Eastern European62 0.3% Syrian60 0.3% Finnish56 0.3% Swiss43 0.2% Canadian35 0.2% Brazilian34 0.2% Welsh31 0.2% Danish26 0.1% British23 0.1% Nigerian21 0.1% Northern European13 0.07% Czechoslovakian12 0.06% Lebanese11 0.06% Ethiopian11 0.06% Yugoslavian10 0.05% Bulgarian10 0.05% Romanian9 0.05% Latvian9 0.05% Luxembourger9 0.05% Belizean8 0.04% Austrian8 0.04% Belgian5 0.03% Greek5 0.03% Australian5 0.03% Ukrainian3 0.02% Icelander3 0.02% Russian3 0.02% Slovak
Geographical mobility in La Crosse Same house 1 year ago 33,186 72.9% White (Caucasian)864 82.1% Black or African American66 43.0% American Indian / Alaska Native1,818 85.6% Asian14 100.0% Native Hawaiian / Pacific Islander147 56.8% Other race916 60.6% Two or more races32,778 72.8% White alone, not Hispanic / Latino650 49.0% Hispanic or LatinoMoved within same county 6,331 13.9% White / Caucasian140 13.3% Black or African American80 51.6% American Indian / Alaska Native95 4.5% Asian18 7.0% Other race291 19.3% Two or more races6,280 13.9% White alone, not Hispanic / Latino392 29.6% Hispanic or LatinoMoved within same state 4,033 8.9% White / Caucasian39 3.7% Black or African American2 1.2% American Indian / Alaska Native7 0.3% Asian53 20.4% Other race87 5.8% Two or more races4,037 9.0% White alone, not Hispanic / Latino160 12.1% Hispanic or LatinoMoved from different state 2,125 4.7% White / Caucasian6 0.6% Black or African American188 8.8% Asian26 10.2% Other race116 7.7% Two or more races2,099 4.7% White alone, not Hispanic / Latino30 2.3% Hispanic or LatinoMoved from abroad 41 0.1% White44 17.0% Other race40 0.1% White alone, not Hispanic / Latino47 3.5% Hispanic or Latino
Children Nativity (place of birth) in La Crosse
Children under 6 years - Living with two parents Both parents native 1,666 100.0% NativeBoth parents foreign-born 58 100.0% NativeOne native, one foreign-born parent 32 100.0% NativeChildren under 6 years - Living with one parent Native parent 669 100.0% NativeChildren 6 to 17 years - Living with two parents Both parents native 2,566 97.1% Native77 2.9% Foreign-bornBoth parents foreign-born 235 100.0% NativeOne native, one foreign-born parent 81 100.0% NativeChildren 6 to 17 years - Living with one parent Native parent 1,697 100.0% NativeForeign-born parent 70 51.7% Native66 48.3% Foreign-born
Grandparents responsible for own grandchildren in La Crosse
Grandparents (30 to 59 years) White / Caucasian 4 100.0% Responsible for grandchildrenBlack or African American 33 100.0% Not responsible for grandchildrenAsian 15 100.0% Not responsible for grandchildrenWhite alone, not Hispanic / Latino 4 100.0% Responsible for grandchildrenGrandparents (60 years and over) White / Caucasian 64 55.0% Responsible for grandchildren53 45.0% Not responsible for grandchildrenAsian 33 100.0% Not responsible for grandchildrenWhite alone, not Hispanic / Latino 65 54.3% Responsible for grandchildren55 45.7% Not responsible for grandchildren