Races in La Grange, New York (NY) Detailed Stats
Ancestries, Foreign-born residents, place of birth
7.5% of La Grange, NY residents are foreign-born (3.5% born in Europe, 2.4% born in Asia, 1.4% born in Latin America), which is 194.5% less than the foreign-born rate of 22.0% across the entire state of New York.
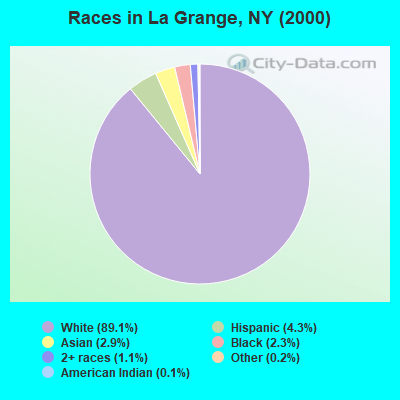
Race distribution in La Grange

- 13,30089.1%White alone
- 6364.3%Hispanic
- 4342.9%Asian alone
- 3402.3%Black alone
- 1681.1%Two or more races
- 340.2%Other race alone
- 160.1%American Indian alone
2000
2022
-
- 11,760,98162.0%White alone
- 2,867,58315.1%Hispanic
- 2,812,62314.8%Black alone
- 1,035,9265.5%Asian alone
- 366,1161.9%Two or more races
- 75,4990.4%Other race alone
- 52,4990.3%American Indian alone
- 5,2300.03%Native Hawaiian and Other
Pacific Islander alone

-
- 10,408,93352.9%White alone
- 3,867,29919.7%Hispanic
- 2,633,84013.4%Black alone
- 1,776,2869.0%Asian alone
- 732,6703.7%Two or more races
- 216,1101.1%Other race alone
- 35,0820.2%American Indian alone
- 6,9310.04%Native Hawaiian and Other
Pacific Islander alone

Income and house value in La Grange
- Median household income in 2022
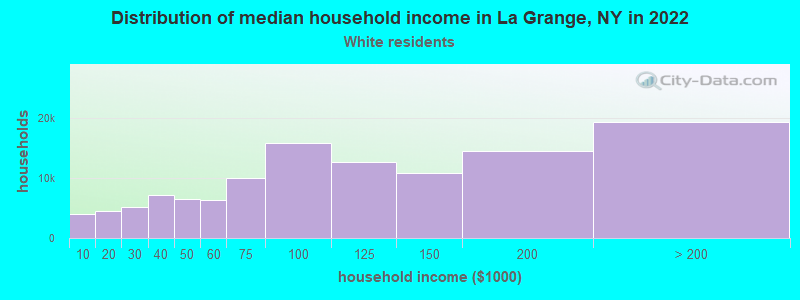
- $129,512White non-Hispanic householders
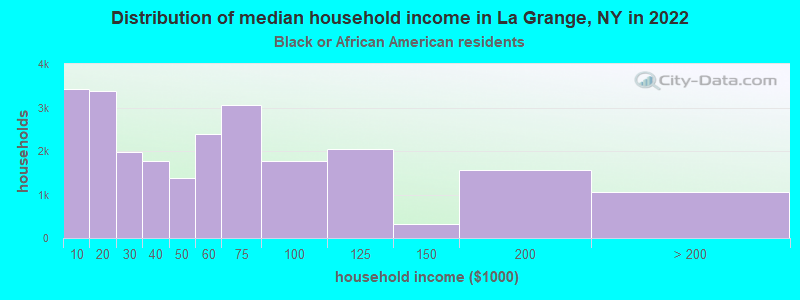
- $116,538Black householders
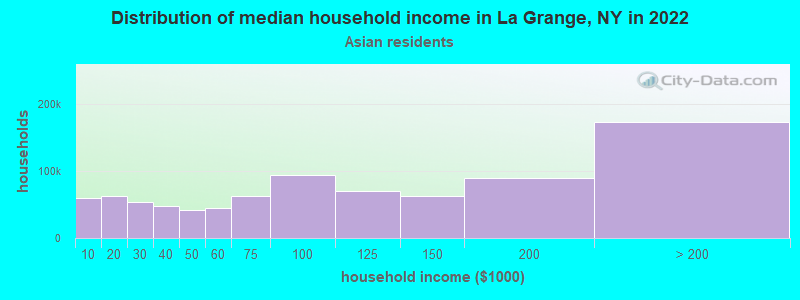
- over $200,000Asian householders
- $56,374Some other race householders
- $108,540Two or more races householders
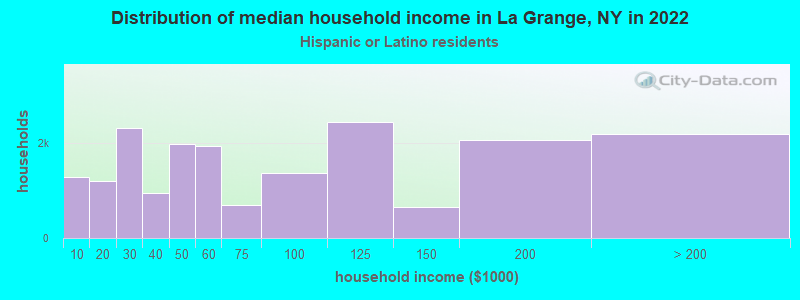
- $89,072Hispanic or Latino race householders
- Median 2022 house value
- $432,461White Non-Hispanic householders
- $475,459Black or African American householders
- $682,493Asian householders
- $714,555Some other race householders
- $734,438Two or more races householders
- $401,642Hispanic or Latino householders
Household income for White non-Hispanic householders
Household income for Black householders
Household income for Asian householders
Household income for Two or more races householders
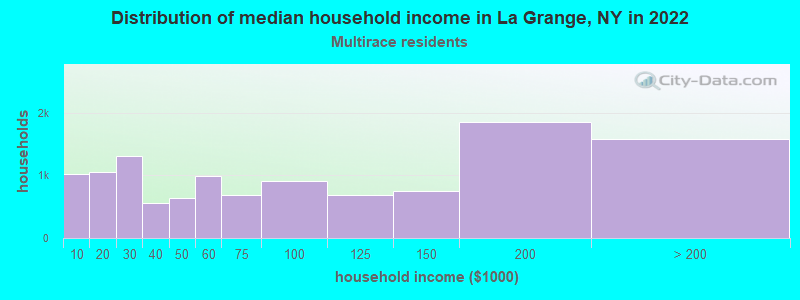
Household income for Hispanic or Latino race householders
Foreign-born residents in La Grange
1,115 residents are foreign born (3.5% Europe, 2.4% Asia, 1.4% Latin America).
| This city: | 7.5% |
| New York: | 20.4% |
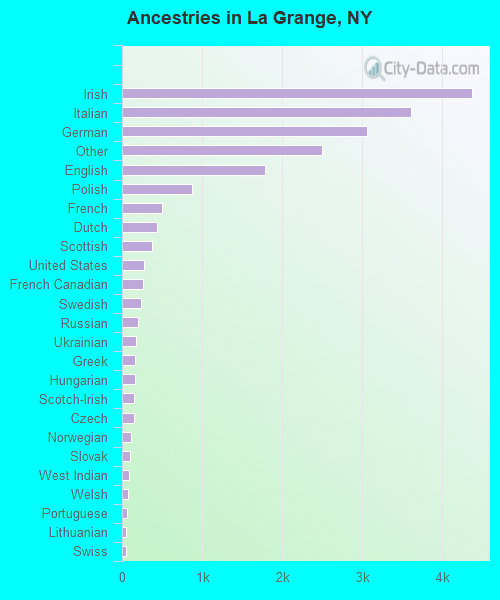
Ancestries in La Grange

- 4,36622.0%Irish
- 3,60918.2%Italian
- 3,05915.4%German
- 2,50412.6%Other
- 1,7909.0%English
- 8754.4%Polish
- 4952.5%French
- 4312.2%Dutch
- 3731.9%Scottish
- 2801.4%United States
- 2661.3%French Canadian
- 2341.2%Swedish
- 1951.0%Russian
- 1780.9%Ukrainian
- 1670.8%Greek
- 1590.8%Hungarian
- 1540.8%Scotch-Irish
- 1510.8%Czech
- 1160.6%Norwegian
- 1020.5%Slovak
- 880.4%West Indian
- 750.4%Welsh
- 620.3%Portuguese
- 540.3%Lithuanian
- 500.3%Swiss
- 350.2%Arab
- 160.08%Danish
Zip codes: 12540.