Races in La Grange Park, Illinois (IL) Detailed Stats
Data:
Races - White alone (%)
Races - White alone (% change since 2000)
Races - Black alone (%)
Races - Black alone (% change since 2000)
Races - American Indian alone (%)
Races - American Indian alone (% change since 2000)
Races - Asian alone (%)
Races - Asian alone (% change since 2000)
Races - Hispanic (%)
Races - Hispanic (% change since 2000)
Races - Native Hawaiian and Other Pacific Islander alone (%)
Races - Native Hawaiian and Other Pacific Islander alone (% change since 2000)
Races - Two or more races(%)
Races - Two or more races(% change since 2000)
Races - Other race alone (%)
Races - Other race alone (% change since 2000)
Racial diversity
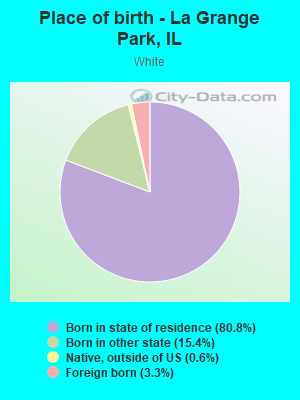
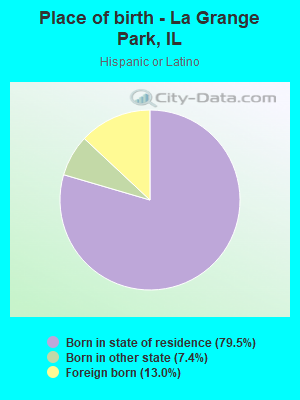
Place of birth - Born in state of residence (%)
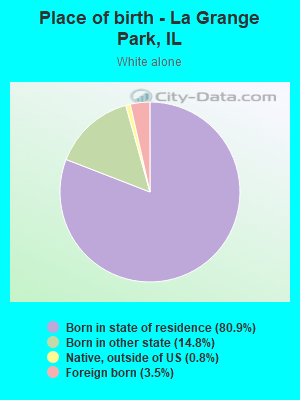
Place of birth - Born in state of residence (%) - White
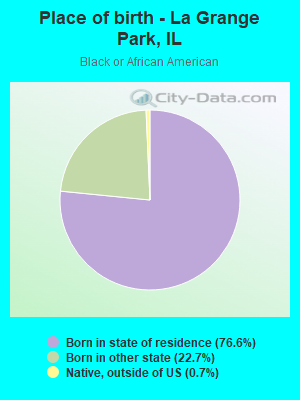
Place of birth - Born in state of residence (%) - Black or African American
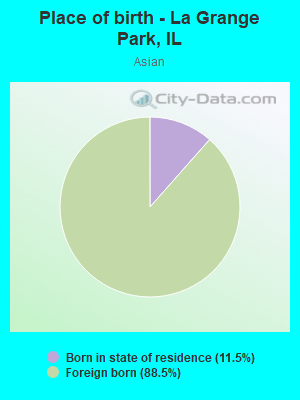
Place of birth - Born in state of residence (%) - Asian
Place of birth - Born in state of residence (%) - Hispanic or Latino
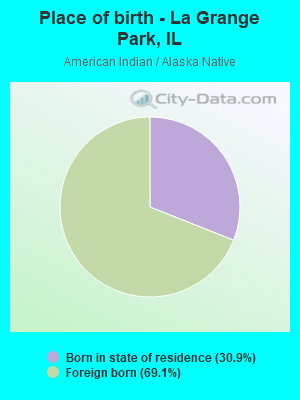
Place of birth - Born in state of residence (%) - American Indian and Alaska Native
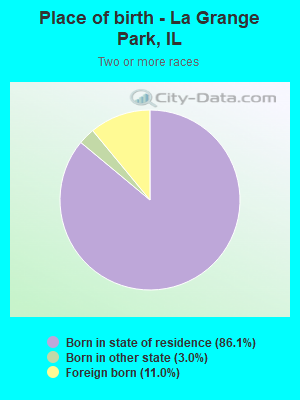
Place of birth - Born in state of residence (%) - Multirace
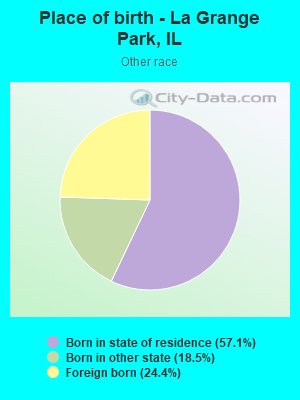
Place of birth - Born in state of residence (%) - Other Race
Place of birth - Born in other state (%)
Place of birth - Born in other state (%) - White
Place of birth - Born in other state (%) - Black or African American
Place of birth - Born in other state (%) - Asian
Place of birth - Born in other state (%) - Hispanic or Latino
Place of birth - Born in other state (%) - American Indian and Alaska Native
Place of birth - Born in other state (%) - Multirace
Place of birth - Born in other state (%) - Other Race
Place of birth - Native, outside of US (%)
Place of birth - Native, outside of US (%) - White
Place of birth - Native, outside of US (%) - Black or African American
Place of birth - Native, outside of US (%) - Asian
Place of birth - Native, outside of US (%) - Hispanic or Latino
Place of birth - Native, outside of US (%) - American Indian and Alaska Native
Place of birth - Native, outside of US (%) - Multirace
Place of birth - Native, outside of US (%) - Other Race
Place of birth - Foreign born (%)
Place of birth - Foreign born (%) - White
Place of birth - Foreign born (%) - Black or African American
Place of birth - Foreign born (%) - Asian
Place of birth - Foreign born (%) - Hispanic or Latino
Place of birth - Foreign born (%) - American Indian and Alaska Native
Place of birth - Foreign born (%) - Multirace
Place of birth - Foreign born (%) - Other Race
Residents speaking English at home (%)
Residents speaking English at home - Born in the United States (%)
Residents speaking English at home - Native, born elsewhere (%)
Residents speaking English at home - Foreign born (%)
Residents speaking Spanish at home (%)
Residents speaking Spanish at home - Born in the United States (%)
Residents speaking Spanish at home - Native, born elsewhere (%)
Residents speaking Spanish at home - Foreign born (%)
Residents speaking other language at home (%)
Residents speaking other language at home - Born in the United States (%)
Residents speaking other language at home - Native, born elsewhere (%)
Residents speaking other language at home - Foreign born (%)
Marital status - Never married (%)
Marital status - Now married (%)
Marital status - Separated (%)
Marital status - Widowed (%)
Marital status - Divorced (%)
Ancestries Reported - Arab (%)
Ancestries Reported - Czech (%)
Ancestries Reported - Danish (%)
Ancestries Reported - Dutch (%)
Ancestries Reported - English (%)
Ancestries Reported - French (%)
Ancestries Reported - French Canadian (%)
Ancestries Reported - German (%)
Ancestries Reported - Greek (%)
Ancestries Reported - Hungarian (%)
Ancestries Reported - Irish (%)
Ancestries Reported - Italian (%)
Ancestries Reported - Lithuanian (%)
Ancestries Reported - Norwegian (%)
Ancestries Reported - Polish (%)
Ancestries Reported - Portuguese (%)
Ancestries Reported - Russian (%)
Ancestries Reported - Scotch-Irish (%)
Ancestries Reported - Scottish (%)
Ancestries Reported - Slovak (%)
Ancestries Reported - Subsaharan African (%)
Ancestries Reported - Swedish (%)
Ancestries Reported - Swiss (%)
Ancestries Reported - Ukrainian (%)
Ancestries Reported - United States (%)
Ancestries Reported - Welsh (%)
Ancestries Reported - West Indian (%)
Ancestries Reported - Other (%)
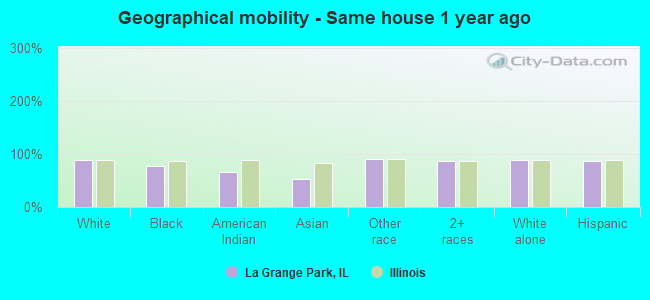
Geographical mobility - Same house 1 year ago (%)
Geographical mobility - Same house 1 year ago (%) - White
Geographical mobility - Same house 1 year ago (%) - Black or African American
Geographical mobility - Same house 1 year ago (%) - Asian
Geographical mobility - Same house 1 year ago (%) - Hispanic or Latino
Geographical mobility - Same house 1 year ago (%) - American Indian and Alaska Native
Geographical mobility - Same house 1 year ago (%) - Multirace
Geographical mobility - Same house 1 year ago (%) - Other Race
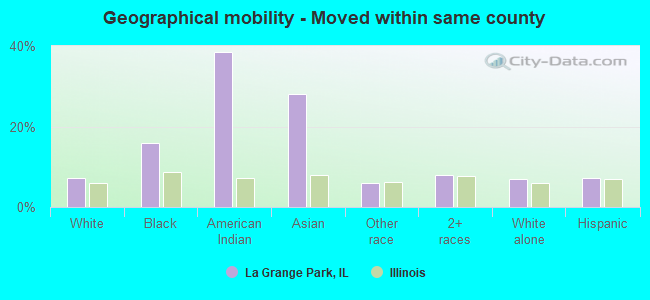
Geographical mobility - Moved within same county (%)
Geographical mobility - Moved within same county (%) - White
Geographical mobility - Moved within same county (%) - Black or African American
Geographical mobility - Moved within same county (%) - Asian
Geographical mobility - Moved within same county (%) - Hispanic or Latino
Geographical mobility - Moved within same county (%) - American Indian and Alaska Native
Geographical mobility - Moved within same county (%) - Multirace
Geographical mobility - Moved within same county (%) - Other Race
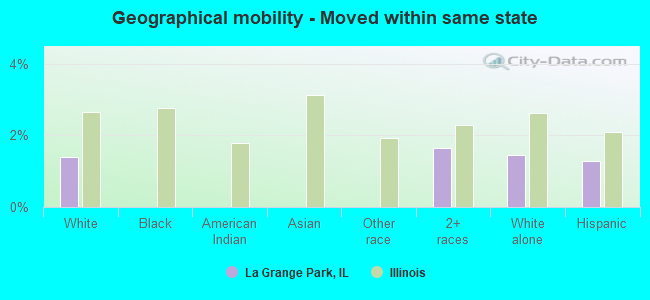
Geographical mobility - Moved from different county within same state (%)
Geographical mobility - Moved from different county within same state (%) - White
Geographical mobility - Moved from different county within same state (%) - Black or African American
Geographical mobility - Moved from different county within same state (%) - Asian
Geographical mobility - Moved from different county within same state (%) - Hispanic or Latino
Geographical mobility - Moved from different county within same state (%) - American Indian and Alaska Native
Geographical mobility - Moved from different county within same state (%) - Multirace
Geographical mobility - Moved from different county within same state (%) - Other Race
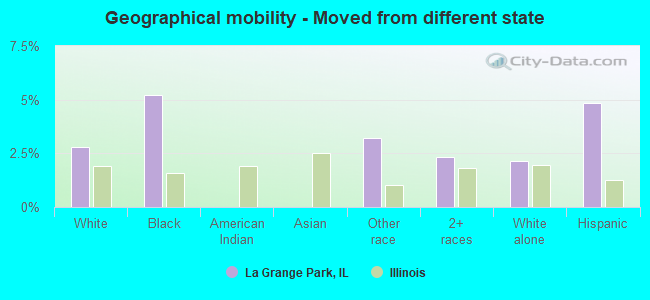
Geographical mobility - Moved from different state (%)
Geographical mobility - Moved from different state (%) - White
Geographical mobility - Moved from different state (%) - Black or African American
Geographical mobility - Moved from different state (%) - Asian
Geographical mobility - Moved from different state (%) - Hispanic or Latino
Geographical mobility - Moved from different state (%) - American Indian and Alaska Native
Geographical mobility - Moved from different state (%) - Multirace
Geographical mobility - Moved from different state (%) - Other Race
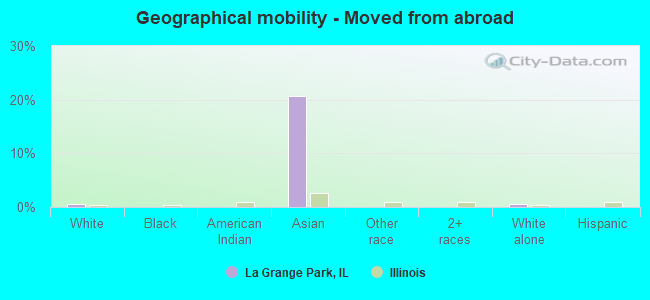
Geographical mobility - Moved from abroad (%)
Geographical mobility - Moved from abroad (%) - White
Geographical mobility - Moved from abroad (%) - Black or African American
Geographical mobility - Moved from abroad (%) - Asian
Geographical mobility - Moved from abroad (%) - Hispanic or Latino
Geographical mobility - Moved from abroad (%) - American Indian and Alaska Native
Geographical mobility - Moved from abroad (%) - Multirace
Geographical mobility - Moved from abroad (%) - Other Race
Place of birth for the foreign-born population - Ireland (%)
Place of birth for the foreign-born population - Denmark (%)
Place of birth for the foreign-born population - Norway (%)
Place of birth for the foreign-born population - Sweden (%)
Place of birth for the foreign-born population - United Kingdom (%)
Place of birth for the foreign-born population - England (%)
Place of birth for the foreign-born population - Scotland (%)
Place of birth for the foreign-born population - Other Northern Europe (%)
Place of birth for the foreign-born population - Austria (%)
Place of birth for the foreign-born population - Belgium (%)
Place of birth for the foreign-born population - France (%)
Place of birth for the foreign-born population - Germany (%)
Place of birth for the foreign-born population - Netherlands (%)
Place of birth for the foreign-born population - Switzerland (%)
Place of birth for the foreign-born population - Other Western Europe (%)
Place of birth for the foreign-born population - Greece (%)
Place of birth for the foreign-born population - Italy (%)
Place of birth for the foreign-born population - Portugal (%)
Place of birth for the foreign-born population - Spain (%)
Place of birth for the foreign-born population - Other Southern Europe (%)
Place of birth for the foreign-born population - Albania (%)
Place of birth for the foreign-born population - Belarus (%)
Place of birth for the foreign-born population - Bosnia and Herzegovina (%)
Place of birth for the foreign-born population - Bulgaria (%)
Place of birth for the foreign-born population - Croatia (%)
Place of birth for the foreign-born population - Czechoslovakia (%)
Place of birth for the foreign-born population - Hungary (%)
Place of birth for the foreign-born population - Latvia (%)
Place of birth for the foreign-born population - Lithuania (%)
Place of birth for the foreign-born population - North Macedonia (Macedonia) (%)
Place of birth for the foreign-born population - Moldova (%)
Place of birth for the foreign-born population - Poland (%)
Place of birth for the foreign-born population - Romania (%)
Place of birth for the foreign-born population - Russia (%)
Place of birth for the foreign-born population - Serbia (%)
Place of birth for the foreign-born population - Ukraine (%)
Place of birth for the foreign-born population - Other Eastern Europe (%)
Place of birth for the foreign-born population - China (%)
Place of birth for the foreign-born population - Hong Kong (%)
Place of birth for the foreign-born population - Taiwan (%)
Place of birth for the foreign-born population - Japan (%)
Place of birth for the foreign-born population - Korea (%)
Place of birth for the foreign-born population - Other Eastern Asia (%)
Place of birth for the foreign-born population - Afghanistan (%)
Place of birth for the foreign-born population - Bangladesh (%)
Place of birth for the foreign-born population - India (%)
Place of birth for the foreign-born population - Iran (%)
Place of birth for the foreign-born population - Kazakhstan (%)
Place of birth for the foreign-born population - Nepal (%)
Place of birth for the foreign-born population - Pakistan (%)
Place of birth for the foreign-born population - Sri Lanka (%)
Place of birth for the foreign-born population - Uzbekistan (%)
Place of birth for the foreign-born population - Other South Central Asia (%)
Place of birth for the foreign-born population - Burma (%)
Place of birth for the foreign-born population - Cambodia (%)
Place of birth for the foreign-born population - Indonesia (%)
Place of birth for the foreign-born population - Laos (%)
Place of birth for the foreign-born population - Malaysia (%)
Place of birth for the foreign-born population - Philippines (%)
Place of birth for the foreign-born population - Singapore (%)
Place of birth for the foreign-born population - Thailand (%)
Place of birth for the foreign-born population - Vietnam (%)
Place of birth for the foreign-born population - Other South Eastern Asia (%)
Place of birth for the foreign-born population - Armenia (%)
Place of birth for the foreign-born population - Iraq (%)
Place of birth for the foreign-born population - Israel (%)
Place of birth for the foreign-born population - Jordan (%)
Place of birth for the foreign-born population - Kuwait (%)
Place of birth for the foreign-born population - Lebanon (%)
Place of birth for the foreign-born population - Saudi Arabia (%)
Place of birth for the foreign-born population - Syria (%)
Place of birth for the foreign-born population - Turkey (%)
Place of birth for the foreign-born population - Yemen (%)
Place of birth for the foreign-born population - Other Western Asia (%)
Place of birth for the foreign-born population - Eritrea (%)
Place of birth for the foreign-born population - Ethiopia (%)
Place of birth for the foreign-born population - Kenya (%)
Place of birth for the foreign-born population - Somalia (%)
Place of birth for the foreign-born population - Uganda (%)
Place of birth for the foreign-born population - Zimbabwe (%)
Place of birth for the foreign-born population - Other Eastern Africa (%)
Place of birth for the foreign-born population - Cameroon (%)
Place of birth for the foreign-born population - Congo (%)
Place of birth for the foreign-born population - Democratic Republic of Congo (Zaire) (%)
Place of birth for the foreign-born population - Other Middle Africa (%)
Place of birth for the foreign-born population - Egypt (%)
Place of birth for the foreign-born population - Morocco (%)
Place of birth for the foreign-born population - Sudan (%)
Place of birth for the foreign-born population - Other Northern Africa (%)
Place of birth for the foreign-born population - South Africa (%)
Place of birth for the foreign-born population - Other Southern Africa (%)
Place of birth for the foreign-born population - Cabo Verde (%)
Place of birth for the foreign-born population - Ghana (%)
Place of birth for the foreign-born population - Liberia (%)
Place of birth for the foreign-born population - Nigeria (%)
Place of birth for the foreign-born population - Senegal (%)
Place of birth for the foreign-born population - Sierra Leone (%)
Place of birth for the foreign-born population - Other Western Africa (%)
Place of birth for the foreign-born population - Australia (%)
Place of birth for the foreign-born population - New Zealand (%)
Place of birth for the foreign-born population - Fiji (%)
Place of birth for the foreign-born population - Micronesia (%)
Place of birth for the foreign-born population - Bahamas (%)
Place of birth for the foreign-born population - Barbados (%)
Place of birth for the foreign-born population - Cuba (%)
Place of birth for the foreign-born population - Dominica (%)
Place of birth for the foreign-born population - Dominican Republic (%)
Place of birth for the foreign-born population - Grenada (%)
Place of birth for the foreign-born population - Haiti (%)
Place of birth for the foreign-born population - Jamaica (%)
Place of birth for the foreign-born population - St. Vincent and the Grenadines (%)
Place of birth for the foreign-born population - Trinidad and Tobago (%)
Place of birth for the foreign-born population - West Indies (%)
Place of birth for the foreign-born population - Other Caribbean (%)
Place of birth for the foreign-born population - Belize (%)
Place of birth for the foreign-born population - Costa Rica (%)
Place of birth for the foreign-born population - El Salvador (%)
Place of birth for the foreign-born population - Guatemala (%)
Place of birth for the foreign-born population - Honduras (%)
Place of birth for the foreign-born population - Mexico (%)
Place of birth for the foreign-born population - Nicaragua (%)
Place of birth for the foreign-born population - Panama (%)
Place of birth for the foreign-born population - Other Central America (%)
Place of birth for the foreign-born population - Argentina (%)
Place of birth for the foreign-born population - Bolivia (%)
Place of birth for the foreign-born population - Brazil (%)
Place of birth for the foreign-born population - Chile (%)
Place of birth for the foreign-born population - Colombia (%)
Place of birth for the foreign-born population - Ecuador (%)
Place of birth for the foreign-born population - Guyana (%)
Place of birth for the foreign-born population - Peru (%)
Place of birth for the foreign-born population - Uruguay (%)
Place of birth for the foreign-born population - Venezuela (%)
Place of birth for the foreign-born population - Other South America (%)
Place of birth for the foreign-born population - Canada (%)
Place of birth for the foreign-born population - Other Northern America (%)
Place of birth for the foreign-born population - Other (%)
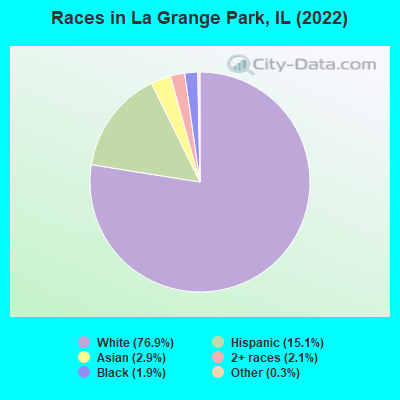
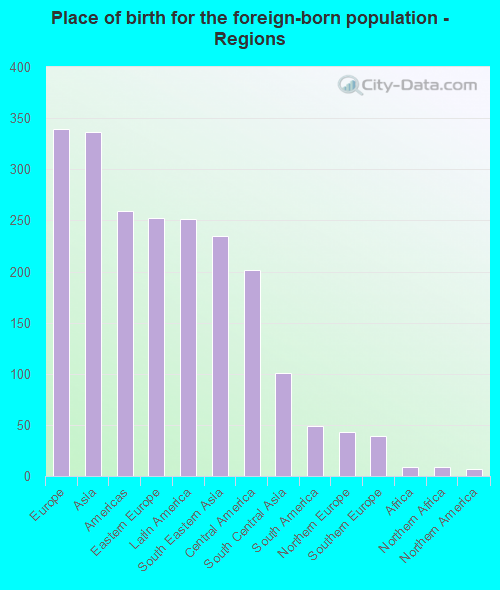
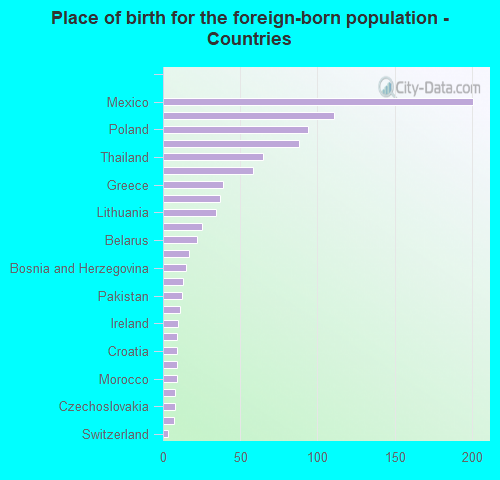
According to 2022 data, the most numerous races in La Grange Park, IL are White alone (10,028 residents), Hispanic (1,966 residents), and Black alone (249 residents). 84.8% of La Grange Park residents speak English at home. 7.3% of La Grange Park, IL residents are foreign-born (2.6% born in Europe, 2.5% born in Asia, 1.9% born in Latin America), which is 92.9% less than the foreign-born rate of 14.0% across the entire state of Illinois.
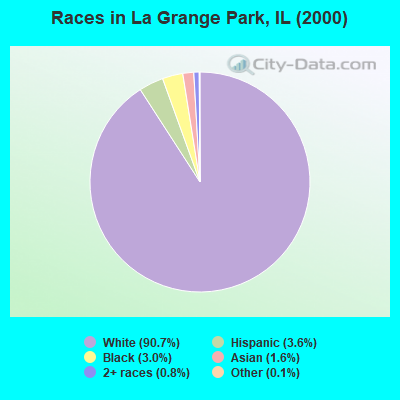
Race distribution in La Grange Park
2000 2022
8,424,140 67.8% White alone 1,856,152 14.9% Black alone 1,530,262 12.3% Hispanic 419,916 3.4% Asian alone 153,996 1.2% Two or more races 13,479 0.1% Other race alone 18,232 0.1% American Indian alone 3,116 0.03% Native Hawaiian and Other
7,356,301 58.5% White alone 2,299,726 18.3% Hispanic 1,660,423 13.2% Black alone 747,296 5.9% Asian alone 458,599 3.6% Two or more races 45,386 0.4% Other race alone 10,405 0.08% American Indian alone 3,896 0.03% Native Hawaiian and Other
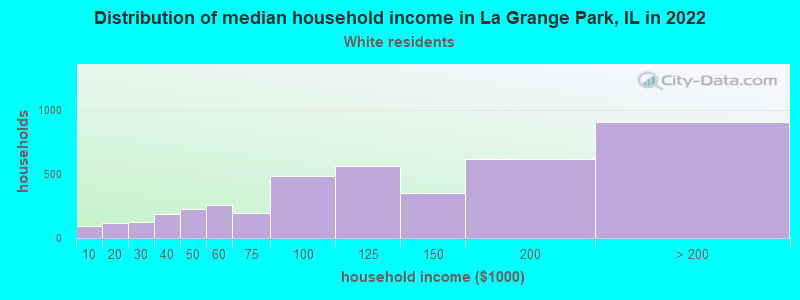
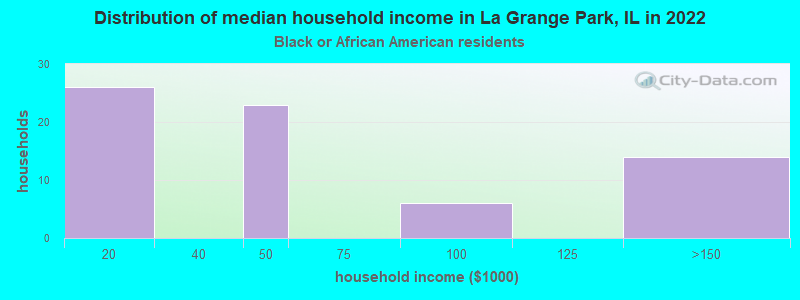
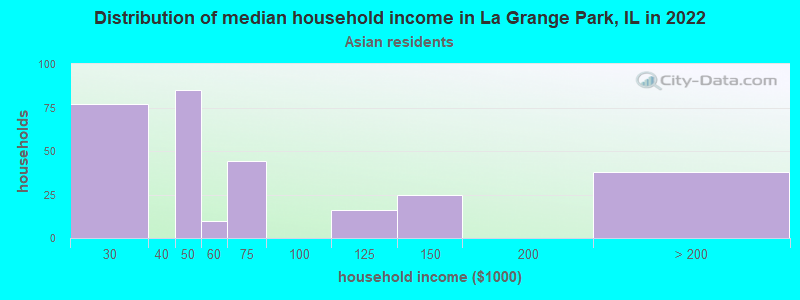
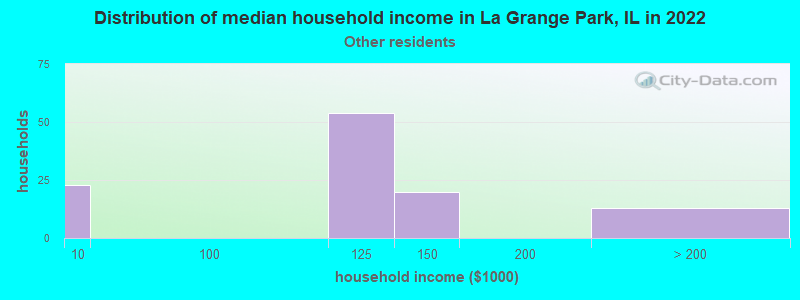
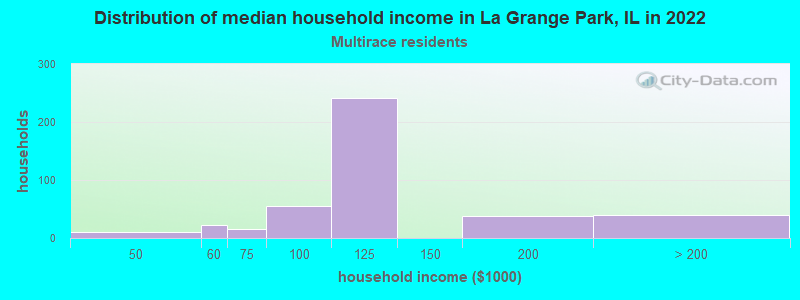
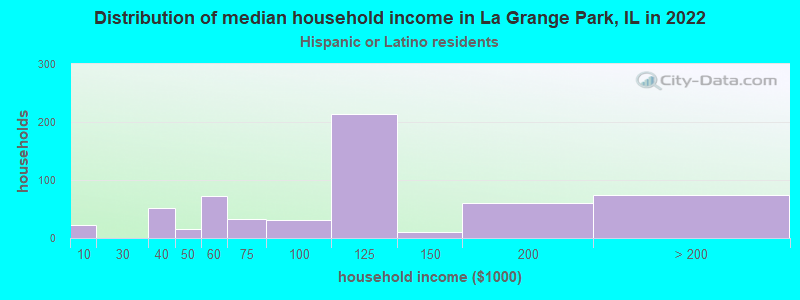
Income and house value in La Grange Park Median household income in 2022 $115,283 White non-Hispanic householders$45,347 Black householders$121,180 Some other race householders$107,215 Two or more races householders$116,194 Hispanic or Latino race householdersMedian 2022 house value $407,011 White Non-Hispanic householders$271,144 Black or African American householders$314,921 American Indian or Alaska Native householders $464,790 Asian householders$321,428 Some other race householders$401,490 Two or more races householders$324,978 Hispanic or Latino householders
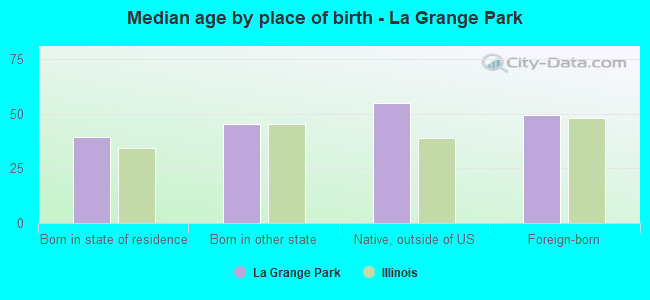
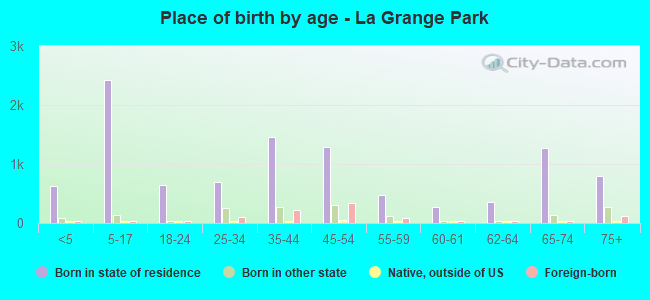
Median age by race in La Grange Park
44.8 Median age for White residents44.0 45.5 62.2 Median age for Black or African American residents49.4 75.0 -680,473,372.1 Median age for American Indian / Alaska Native residents-736,736,736.0 -641,399,416.3 43.0 Median age for Asian residents42.1 43.1 -687,999,999.3 Median age for Native Hawaiian / Pacific Islander residents-918,721,460.3 -610,229,276.3 41.0 Median age for Other race residents40.6 46.5 28.6 Median age for Two or more races residents24.2 35.3 45.3 Median age for White alone residents45.3 45.2 25.9 Median age for Hispanic or Latino residents19.2 34.3
Owner/renter occupied households by race in La Grange Park
House owners and renters - White residents 3,223 78.1% Owner occupied903 21.9% Renter occupiedHouse owners and renters - Black or African American residents 72 100.0% Renter occupiedHouse owners and renters - American Indian / Alaska Native residents 11 100.0% Owner occupiedHouse owners and renters - Asian residents 75 28.0% Owner occupied192 72.0% Renter occupiedHouse owners and renters - Other race residents 58 55.3% Owner occupied47 44.7% Renter occupiedHouse owners and renters - Two or more races residents 335 77.3% Owner occupied98 22.7% Renter occupiedHouse owners and renters - White alone residents 3,308 79.0% Owner occupied880 21.0% Renter occupiedHouse owners and renters - Hispanic or Latino residents 371 64.6% Owner occupied203 35.4% Renter occupied
Language usage in La Grange Park
English speakers - Total 84.8% of residents of La Grange Park speak English at home.
7.3% of residents speak Spanish at home 852 94.4% Speak English very well51 5.6% Speak English less than very well7.3% of residents speak other language at home 697 78.0% Speak English very well197 22.0% Speak English less than very well
English speakers - Born in the United States 93.9% of residents of La Grange Park speak English at home.
4.1% of residents speak Spanish at home 66 100.0% Speak English very well1.5% of residents speak other language at home 25 100.0% Speak English very well
All residents speak only English at home
English speakers - Foreign-born 23.6% of residents of La Grange Park speak English at home.
23.8% of residents speak Spanish at home 179 79.6% Speak English very well46 20.4% Speak English less than very well51.2% of residents speak other language at home 322 66.5% Speak English very well162 33.5% Speak English less than very well
White (Caucasian) - Speak only English Native:
97.6% (8,936)Foreign-born:
27.1% (88)
White (Caucasian) - Speak another language Native:
4.9% (451)Foreign-born:
73.8% (241)
Asian - Speak only English Native:
74.7% (34)Foreign-born:
30.6% (103)
Asian - Speak another language Native:
25.5% (11)Foreign-born:
66.5% (223)
Other race - Speak another language Native:
46.6% (113)Foreign-born:
100.0% (76)
Two or more races - Speak only English Native:
61.3% (698)Foreign-born:
3.6% (6)
Two or more races - Speak another language Native:
38.0% (432)Foreign-born:
96.4% (154)
White alone - Speak only English Native:
94.8% (8,652)Foreign-born:
27.9% (98)
White alone - Speak another language Native:
4.8% (440)Foreign-born:
70.7% (247)
Hispanic or Latino - Speak only English Native:
59.8% (918)Foreign-born:
5.7% (14)
Hispanic or Latino - Speak another language Native:
42.0% (645)Foreign-born:
94.2% (239)
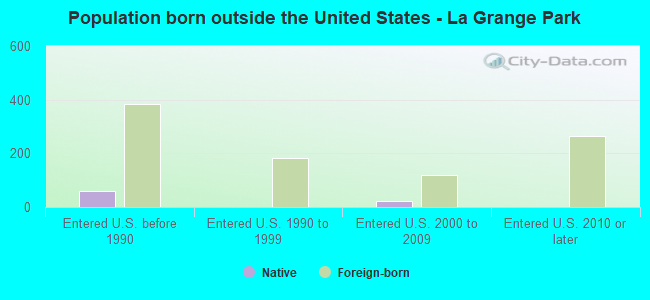
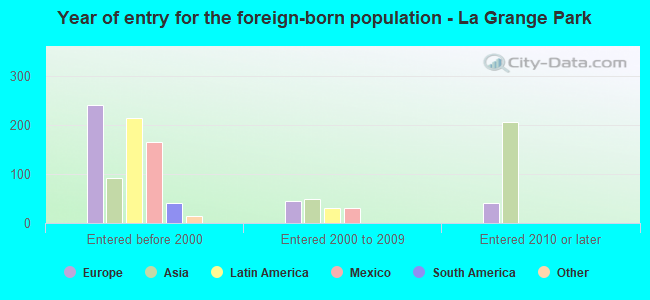
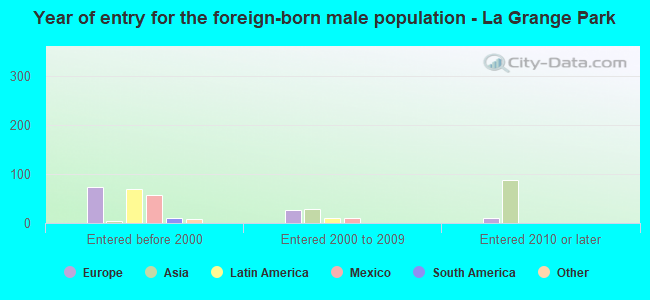
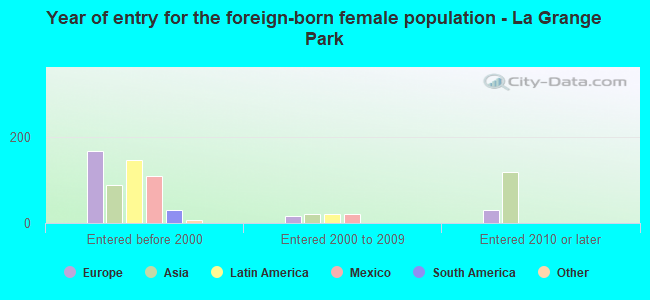
Foreign-born residents in La Grange Park 946 residents are foreign born (2.6% Europe , 2.5% Asia , 1.9% Latin America ).
This city:
7.3%Illinois:
14.1%
Marital status for residents in La Grange Park Marital status - White (Caucasian) population 15 years and over
Males 26.0% Never married63.2% Now married0.2% Separated4.4% Widowed6.2% DivorcedFemales 23.3% Never married54.8% Now married1.3% Separated11.1% Widowed9.5% DivorcedWomen who gave birth in the past 12 months Now married:
66.3% (57)Unmarried:
33.7% (29)
Women who did not give birth in the past 12 months Now married:
54.7% (1,042)Unmarried:
45.3% (864)
Marital status - Black or African American population 15 years and over
Males 47.9% Never married44.6% Now married0.0% Separated4.1% Widowed3.3% DivorcedFemales 41.1% Never married0.0% Now married0.0% Separated28.4% Widowed30.5% DivorcedWomen who did not give birth in the past 12 months Now married:
0.0% (0)Unmarried:
100.0% (42)
Marital status - American Indian / Alaska Native population 15 years and over
Males 0.0% Never married100.0% Now married0.0% Separated0.0% Widowed0.0% DivorcedFemales 0.0% Never married100.0% Now married0.0% Separated0.0% Widowed0.0% DivorcedWomen who did not give birth in the past 12 months Now married:
100.0% (11)Unmarried:
0.0% (0)
Marital status - Asian population 15 years and over
Males 4.9% Never married91.2% Now married0.0% Separated3.9% Widowed0.0% DivorcedFemales 33.3% Never married59.6% Now married0.0% Separated0.0% Widowed7.1% DivorcedWomen who gave birth in the past 12 months Now married:
100.0% (15)Unmarried:
0.0% (0)
Women who did not give birth in the past 12 months Now married:
61.3% (120)Unmarried:
38.7% (76)
Marital status - Other race population 15 years and over
Males 35.1% Never married38.3% Now married0.0% Separated0.0% Widowed26.6% DivorcedFemales 43.2% Never married26.6% Now married0.0% Separated8.6% Widowed21.6% DivorcedWomen who did not give birth in the past 12 months Now married:
38.5% (42)Unmarried:
61.5% (67)
Marital status - Two or more races population 15 years and over
Males 40.9% Never married59.1% Now married0.0% Separated0.0% Widowed0.0% DivorcedFemales 45.6% Never married48.2% Now married0.0% Separated3.9% Widowed2.3% DivorcedWomen who did not give birth in the past 12 months Now married:
31.4% (118)Unmarried:
68.6% (258)
Marital status - White alone, not Hispanic / Latino population 15 years and over
Males 24.4% Never married64.4% Now married0.2% Separated4.6% Widowed6.5% DivorcedFemales 20.7% Never married58.3% Now married0.6% Separated10.6% Widowed9.8% DivorcedWomen who gave birth in the past 12 months Now married:
66.3% (64)Unmarried:
33.7% (32)
Women who did not give birth in the past 12 months Now married:
60.0% (1,120)Unmarried:
40.0% (746)
Marital status - Hispanic or Latino population 15 years and over
Males 47.9% Never married47.5% Now married0.0% Separated0.0% Widowed4.6% DivorcedFemales 47.0% Never married31.0% Now married4.3% Separated11.0% Widowed6.6% DivorcedWomen who did not give birth in the past 12 months Now married:
27.7% (168)Unmarried:
72.3% (437)
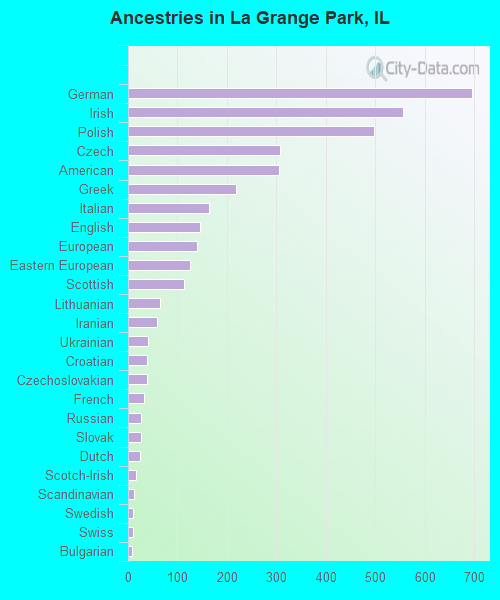
Ancestries in La Grange Park
695 12.2% German555 9.8% Irish498 8.8% Polish308 5.4% Czech305 5.4% American219 3.9% Greek164 2.9% Italian146 2.6% English140 2.5% European125 2.2% Eastern European113 2.0% Scottish64 1.1% Lithuanian58 1.0% Iranian40 0.7% Ukrainian39 0.7% Croatian39 0.7% Czechoslovakian33 0.6% French26 0.5% Russian26 0.5% Slovak25 0.4% Dutch17 0.3% Scotch-Irish13 0.2% Scandinavian11 0.2% Swedish10 0.2% Swiss9 0.2% Bulgarian9 0.2% Norwegian8 0.1% Welsh8 0.1% Austrian8 0.1% Finnish7 0.1% Serbian6 0.1% Hungarian5 0.09% Assyrian4 0.07% British3 0.05% French Canadian
Children Nativity (place of birth) in La Grange Park
Children under 6 years - Living with two parents Both parents native 589 100.0% NativeBoth parents foreign-born 14 100.0% NativeOne native, one foreign-born parent 57 100.0% NativeChildren under 6 years - Living with one parent Native parent 90 100.0% NativeForeign-born parent 34 100.0% NativeChildren 6 to 17 years - Living with two parents Both parents native 1,738 100.0% NativeBoth parents foreign-born 38 53.7% Native33 46.3% Foreign-bornOne native, one foreign-born parent 179 100.0% NativeChildren 6 to 17 years - Living with one parent Native parent 451 100.0% NativeForeign-born parent 32 50.1% Native32 49.9% Foreign-born
Grandparents responsible for own grandchildren in La Grange Park
Grandparents (30 to 59 years) Black or African American 1 80.2% Not responsible for grandchildren
Grandparents (60 years and over)