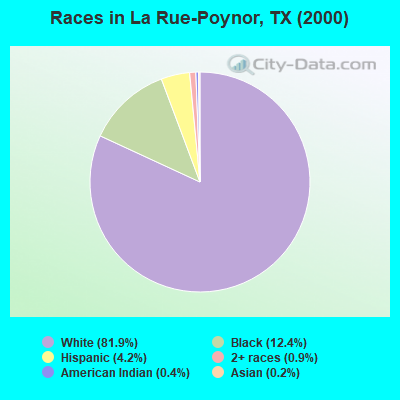
Races in La Rue-Poynor, Texas (TX) Detailed Stats
Ancestries, Foreign-born residents, place of birth
Race distribution in La Rue-Poynor

- 5,13181.9%White alone
- 77912.4%Black alone
- 2624.2%Hispanic
- 540.9%Two or more races
- 250.4%American Indian alone
- 140.2%Asian alone
2000
2022
-
- 10,933,31352.4%White alone
- 6,669,66632.0%Hispanic
- 2,364,25511.3%Black alone
- 554,4452.7%Asian alone
- 230,5671.1%Two or more races
- 68,8590.3%American Indian alone
- 19,9580.10%Other race alone
- 10,7570.05%Native Hawaiian and Other
Pacific Islander alone

-
- 12,070,64240.2%Hispanic
- 11,683,43038.9%White alone
- 3,508,70611.7%Black alone
- 1,608,1735.4%Asian alone
- 956,5603.2%Two or more races
- 125,7630.4%Other race alone
- 47,0230.2%American Indian alone
- 29,2750.10%Native Hawaiian and Other
Pacific Islander alone

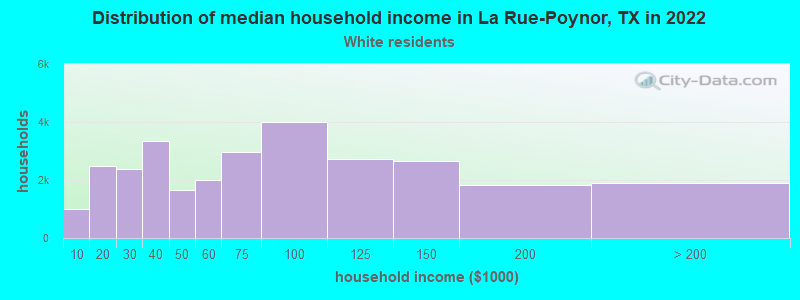
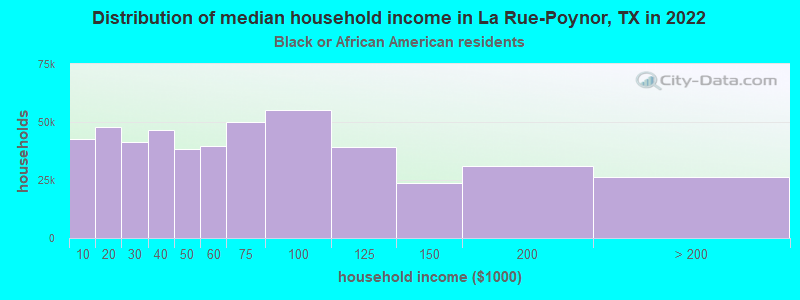
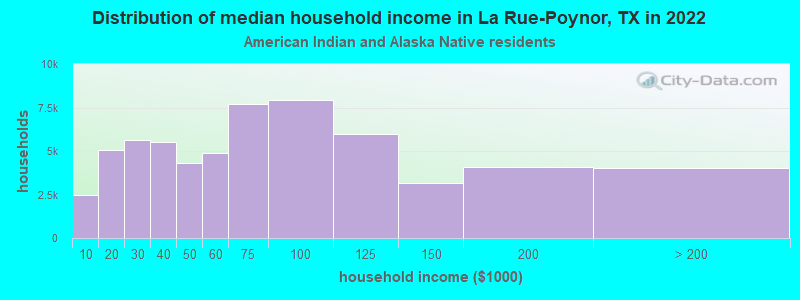
Income and house value in La Rue-Poynor
- Median household income in 2022
- $64,586White non-Hispanic householders
- $63,681Black householders
- $100,584American Indian and Alaska Native householders
- $4,890Some other race householders
- $102,534Two or more races householders
- $92,735Hispanic or Latino race householders
- Median 2022 house value
- $246,924White Non-Hispanic householders
- $131,582Black or African American householders
- $455,733Asian householders
- $215,437Some other race householders
- $165,721Two or more races householders
- $215,437Hispanic or Latino householders
Household income for White non-Hispanic householders
Household income for Black householders
Household income for American Indian and Alaska Native householders
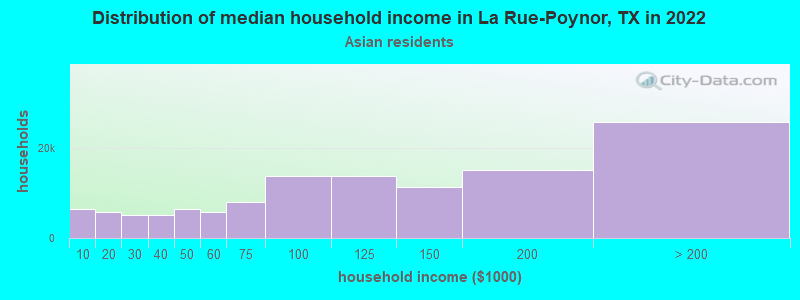
Household income for Asian householders
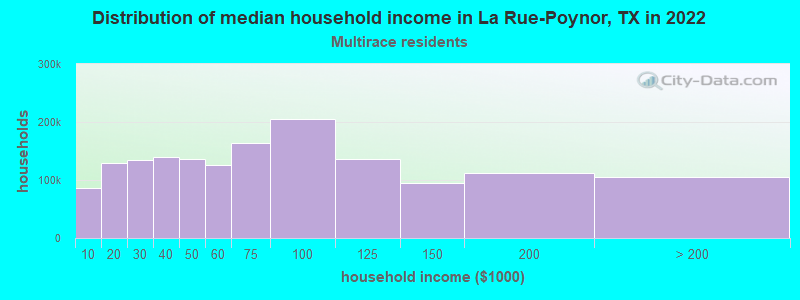
Household income for Two or more races householders
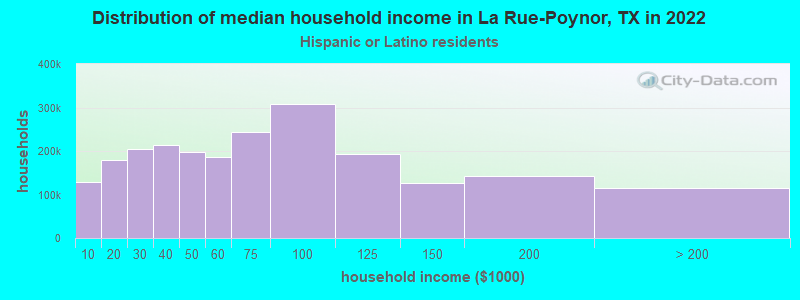
Household income for Hispanic or Latino race householders
Zip code: 75763