Races in Ladson, South Carolina (SC) Detailed Stats
Data:
Races - White alone (%)
Races - White alone (% change since 2000)
Races - Black alone (%)
Races - Black alone (% change since 2000)
Races - American Indian alone (%)
Races - American Indian alone (% change since 2000)
Races - Asian alone (%)
Races - Asian alone (% change since 2000)
Races - Hispanic (%)
Races - Hispanic (% change since 2000)
Races - Native Hawaiian and Other Pacific Islander alone (%)
Races - Native Hawaiian and Other Pacific Islander alone (% change since 2000)
Races - Two or more races(%)
Races - Two or more races(% change since 2000)
Races - Other race alone (%)
Races - Other race alone (% change since 2000)
Racial diversity
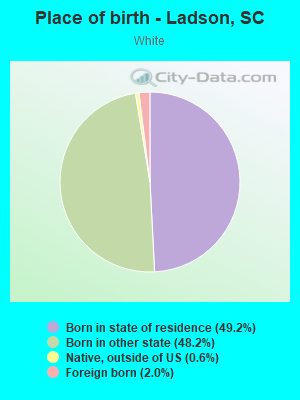
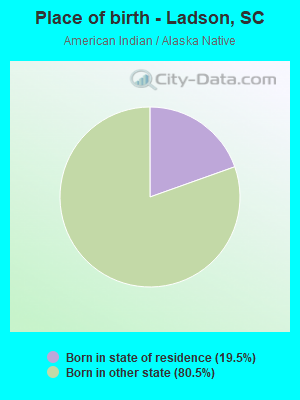
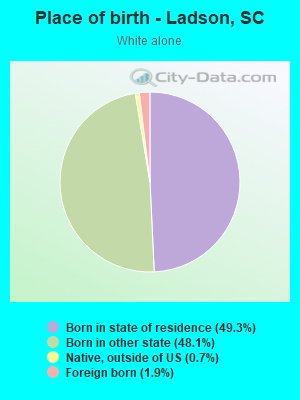
Place of birth - Born in state of residence (%)
Place of birth - Born in state of residence (%) - White
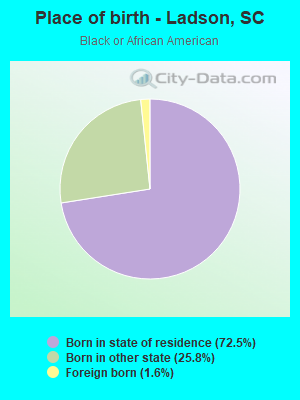
Place of birth - Born in state of residence (%) - Black or African American
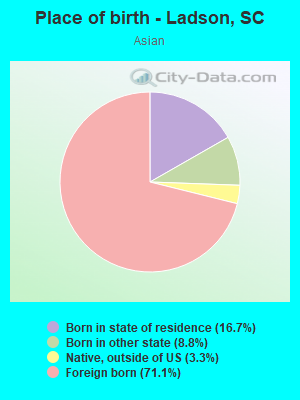
Place of birth - Born in state of residence (%) - Asian
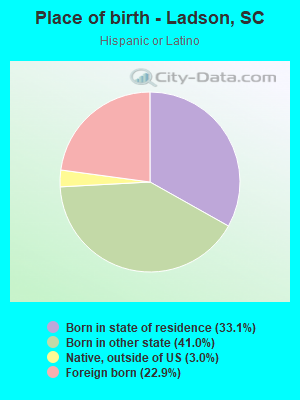
Place of birth - Born in state of residence (%) - Hispanic or Latino
Place of birth - Born in state of residence (%) - American Indian and Alaska Native
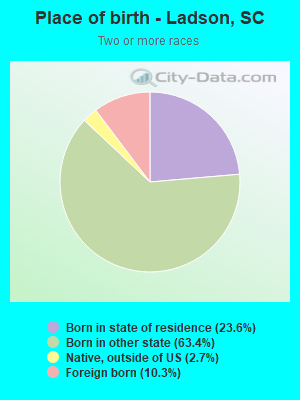
Place of birth - Born in state of residence (%) - Multirace
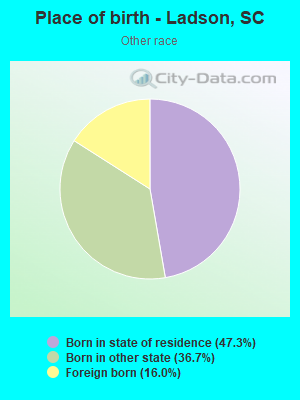
Place of birth - Born in state of residence (%) - Other Race
Place of birth - Born in other state (%)
Place of birth - Born in other state (%) - White
Place of birth - Born in other state (%) - Black or African American
Place of birth - Born in other state (%) - Asian
Place of birth - Born in other state (%) - Hispanic or Latino
Place of birth - Born in other state (%) - American Indian and Alaska Native
Place of birth - Born in other state (%) - Multirace
Place of birth - Born in other state (%) - Other Race
Place of birth - Native, outside of US (%)
Place of birth - Native, outside of US (%) - White
Place of birth - Native, outside of US (%) - Black or African American
Place of birth - Native, outside of US (%) - Asian
Place of birth - Native, outside of US (%) - Hispanic or Latino
Place of birth - Native, outside of US (%) - American Indian and Alaska Native
Place of birth - Native, outside of US (%) - Multirace
Place of birth - Native, outside of US (%) - Other Race
Place of birth - Foreign born (%)
Place of birth - Foreign born (%) - White
Place of birth - Foreign born (%) - Black or African American
Place of birth - Foreign born (%) - Asian
Place of birth - Foreign born (%) - Hispanic or Latino
Place of birth - Foreign born (%) - American Indian and Alaska Native
Place of birth - Foreign born (%) - Multirace
Place of birth - Foreign born (%) - Other Race
Residents speaking English at home (%)
Residents speaking English at home - Born in the United States (%)
Residents speaking English at home - Native, born elsewhere (%)
Residents speaking English at home - Foreign born (%)
Residents speaking Spanish at home (%)
Residents speaking Spanish at home - Born in the United States (%)
Residents speaking Spanish at home - Native, born elsewhere (%)
Residents speaking Spanish at home - Foreign born (%)
Residents speaking other language at home (%)
Residents speaking other language at home - Born in the United States (%)
Residents speaking other language at home - Native, born elsewhere (%)
Residents speaking other language at home - Foreign born (%)
Marital status - Never married (%)
Marital status - Now married (%)
Marital status - Separated (%)
Marital status - Widowed (%)
Marital status - Divorced (%)
Ancestries Reported - Arab (%)
Ancestries Reported - Czech (%)
Ancestries Reported - Danish (%)
Ancestries Reported - Dutch (%)
Ancestries Reported - English (%)
Ancestries Reported - French (%)
Ancestries Reported - French Canadian (%)
Ancestries Reported - German (%)
Ancestries Reported - Greek (%)
Ancestries Reported - Hungarian (%)
Ancestries Reported - Irish (%)
Ancestries Reported - Italian (%)
Ancestries Reported - Lithuanian (%)
Ancestries Reported - Norwegian (%)
Ancestries Reported - Polish (%)
Ancestries Reported - Portuguese (%)
Ancestries Reported - Russian (%)
Ancestries Reported - Scotch-Irish (%)
Ancestries Reported - Scottish (%)
Ancestries Reported - Slovak (%)
Ancestries Reported - Subsaharan African (%)
Ancestries Reported - Swedish (%)
Ancestries Reported - Swiss (%)
Ancestries Reported - Ukrainian (%)
Ancestries Reported - United States (%)
Ancestries Reported - Welsh (%)
Ancestries Reported - West Indian (%)
Ancestries Reported - Other (%)
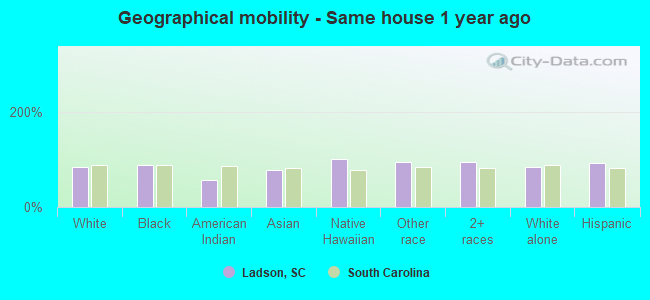
Geographical mobility - Same house 1 year ago (%)
Geographical mobility - Same house 1 year ago (%) - White
Geographical mobility - Same house 1 year ago (%) - Black or African American
Geographical mobility - Same house 1 year ago (%) - Asian
Geographical mobility - Same house 1 year ago (%) - Hispanic or Latino
Geographical mobility - Same house 1 year ago (%) - American Indian and Alaska Native
Geographical mobility - Same house 1 year ago (%) - Multirace
Geographical mobility - Same house 1 year ago (%) - Other Race
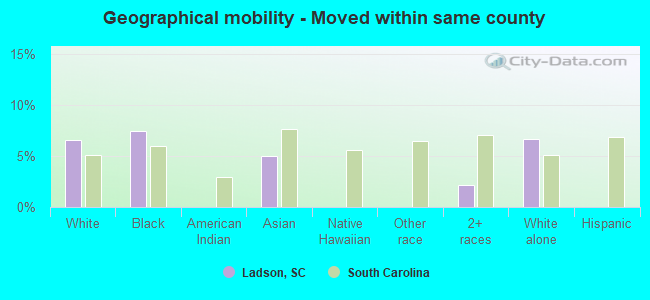
Geographical mobility - Moved within same county (%)
Geographical mobility - Moved within same county (%) - White
Geographical mobility - Moved within same county (%) - Black or African American
Geographical mobility - Moved within same county (%) - Asian
Geographical mobility - Moved within same county (%) - Hispanic or Latino
Geographical mobility - Moved within same county (%) - American Indian and Alaska Native
Geographical mobility - Moved within same county (%) - Multirace
Geographical mobility - Moved within same county (%) - Other Race
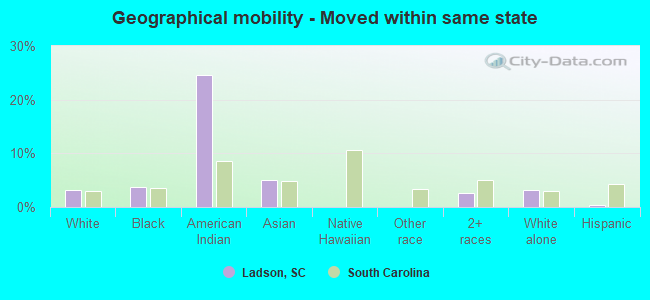
Geographical mobility - Moved from different county within same state (%)
Geographical mobility - Moved from different county within same state (%) - White
Geographical mobility - Moved from different county within same state (%) - Black or African American
Geographical mobility - Moved from different county within same state (%) - Asian
Geographical mobility - Moved from different county within same state (%) - Hispanic or Latino
Geographical mobility - Moved from different county within same state (%) - American Indian and Alaska Native
Geographical mobility - Moved from different county within same state (%) - Multirace
Geographical mobility - Moved from different county within same state (%) - Other Race
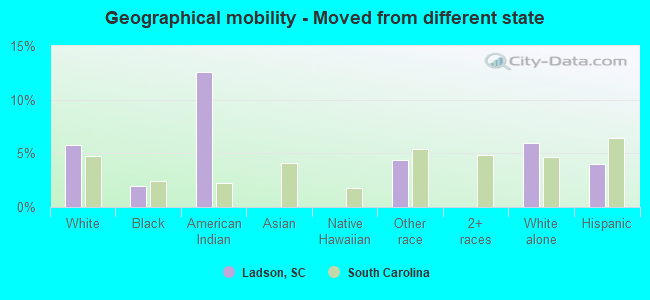
Geographical mobility - Moved from different state (%)
Geographical mobility - Moved from different state (%) - White
Geographical mobility - Moved from different state (%) - Black or African American
Geographical mobility - Moved from different state (%) - Asian
Geographical mobility - Moved from different state (%) - Hispanic or Latino
Geographical mobility - Moved from different state (%) - American Indian and Alaska Native
Geographical mobility - Moved from different state (%) - Multirace
Geographical mobility - Moved from different state (%) - Other Race
Geographical mobility - Moved from abroad (%)
Geographical mobility - Moved from abroad (%) - White
Geographical mobility - Moved from abroad (%) - Black or African American
Geographical mobility - Moved from abroad (%) - Asian
Geographical mobility - Moved from abroad (%) - Hispanic or Latino
Geographical mobility - Moved from abroad (%) - American Indian and Alaska Native
Geographical mobility - Moved from abroad (%) - Multirace
Geographical mobility - Moved from abroad (%) - Other Race
Place of birth for the foreign-born population - Ireland (%)
Place of birth for the foreign-born population - Denmark (%)
Place of birth for the foreign-born population - Norway (%)
Place of birth for the foreign-born population - Sweden (%)
Place of birth for the foreign-born population - United Kingdom (%)
Place of birth for the foreign-born population - England (%)
Place of birth for the foreign-born population - Scotland (%)
Place of birth for the foreign-born population - Other Northern Europe (%)
Place of birth for the foreign-born population - Austria (%)
Place of birth for the foreign-born population - Belgium (%)
Place of birth for the foreign-born population - France (%)
Place of birth for the foreign-born population - Germany (%)
Place of birth for the foreign-born population - Netherlands (%)
Place of birth for the foreign-born population - Switzerland (%)
Place of birth for the foreign-born population - Other Western Europe (%)
Place of birth for the foreign-born population - Greece (%)
Place of birth for the foreign-born population - Italy (%)
Place of birth for the foreign-born population - Portugal (%)
Place of birth for the foreign-born population - Spain (%)
Place of birth for the foreign-born population - Other Southern Europe (%)
Place of birth for the foreign-born population - Albania (%)
Place of birth for the foreign-born population - Belarus (%)
Place of birth for the foreign-born population - Bosnia and Herzegovina (%)
Place of birth for the foreign-born population - Bulgaria (%)
Place of birth for the foreign-born population - Croatia (%)
Place of birth for the foreign-born population - Czechoslovakia (%)
Place of birth for the foreign-born population - Hungary (%)
Place of birth for the foreign-born population - Latvia (%)
Place of birth for the foreign-born population - Lithuania (%)
Place of birth for the foreign-born population - North Macedonia (Macedonia) (%)
Place of birth for the foreign-born population - Moldova (%)
Place of birth for the foreign-born population - Poland (%)
Place of birth for the foreign-born population - Romania (%)
Place of birth for the foreign-born population - Russia (%)
Place of birth for the foreign-born population - Serbia (%)
Place of birth for the foreign-born population - Ukraine (%)
Place of birth for the foreign-born population - Other Eastern Europe (%)
Place of birth for the foreign-born population - China (%)
Place of birth for the foreign-born population - Hong Kong (%)
Place of birth for the foreign-born population - Taiwan (%)
Place of birth for the foreign-born population - Japan (%)
Place of birth for the foreign-born population - Korea (%)
Place of birth for the foreign-born population - Other Eastern Asia (%)
Place of birth for the foreign-born population - Afghanistan (%)
Place of birth for the foreign-born population - Bangladesh (%)
Place of birth for the foreign-born population - India (%)
Place of birth for the foreign-born population - Iran (%)
Place of birth for the foreign-born population - Kazakhstan (%)
Place of birth for the foreign-born population - Nepal (%)
Place of birth for the foreign-born population - Pakistan (%)
Place of birth for the foreign-born population - Sri Lanka (%)
Place of birth for the foreign-born population - Uzbekistan (%)
Place of birth for the foreign-born population - Other South Central Asia (%)
Place of birth for the foreign-born population - Burma (%)
Place of birth for the foreign-born population - Cambodia (%)
Place of birth for the foreign-born population - Indonesia (%)
Place of birth for the foreign-born population - Laos (%)
Place of birth for the foreign-born population - Malaysia (%)
Place of birth for the foreign-born population - Philippines (%)
Place of birth for the foreign-born population - Singapore (%)
Place of birth for the foreign-born population - Thailand (%)
Place of birth for the foreign-born population - Vietnam (%)
Place of birth for the foreign-born population - Other South Eastern Asia (%)
Place of birth for the foreign-born population - Armenia (%)
Place of birth for the foreign-born population - Iraq (%)
Place of birth for the foreign-born population - Israel (%)
Place of birth for the foreign-born population - Jordan (%)
Place of birth for the foreign-born population - Kuwait (%)
Place of birth for the foreign-born population - Lebanon (%)
Place of birth for the foreign-born population - Saudi Arabia (%)
Place of birth for the foreign-born population - Syria (%)
Place of birth for the foreign-born population - Turkey (%)
Place of birth for the foreign-born population - Yemen (%)
Place of birth for the foreign-born population - Other Western Asia (%)
Place of birth for the foreign-born population - Eritrea (%)
Place of birth for the foreign-born population - Ethiopia (%)
Place of birth for the foreign-born population - Kenya (%)
Place of birth for the foreign-born population - Somalia (%)
Place of birth for the foreign-born population - Uganda (%)
Place of birth for the foreign-born population - Zimbabwe (%)
Place of birth for the foreign-born population - Other Eastern Africa (%)
Place of birth for the foreign-born population - Cameroon (%)
Place of birth for the foreign-born population - Congo (%)
Place of birth for the foreign-born population - Democratic Republic of Congo (Zaire) (%)
Place of birth for the foreign-born population - Other Middle Africa (%)
Place of birth for the foreign-born population - Egypt (%)
Place of birth for the foreign-born population - Morocco (%)
Place of birth for the foreign-born population - Sudan (%)
Place of birth for the foreign-born population - Other Northern Africa (%)
Place of birth for the foreign-born population - South Africa (%)
Place of birth for the foreign-born population - Other Southern Africa (%)
Place of birth for the foreign-born population - Cabo Verde (%)
Place of birth for the foreign-born population - Ghana (%)
Place of birth for the foreign-born population - Liberia (%)
Place of birth for the foreign-born population - Nigeria (%)
Place of birth for the foreign-born population - Senegal (%)
Place of birth for the foreign-born population - Sierra Leone (%)
Place of birth for the foreign-born population - Other Western Africa (%)
Place of birth for the foreign-born population - Australia (%)
Place of birth for the foreign-born population - New Zealand (%)
Place of birth for the foreign-born population - Fiji (%)
Place of birth for the foreign-born population - Micronesia (%)
Place of birth for the foreign-born population - Bahamas (%)
Place of birth for the foreign-born population - Barbados (%)
Place of birth for the foreign-born population - Cuba (%)
Place of birth for the foreign-born population - Dominica (%)
Place of birth for the foreign-born population - Dominican Republic (%)
Place of birth for the foreign-born population - Grenada (%)
Place of birth for the foreign-born population - Haiti (%)
Place of birth for the foreign-born population - Jamaica (%)
Place of birth for the foreign-born population - St. Vincent and the Grenadines (%)
Place of birth for the foreign-born population - Trinidad and Tobago (%)
Place of birth for the foreign-born population - West Indies (%)
Place of birth for the foreign-born population - Other Caribbean (%)
Place of birth for the foreign-born population - Belize (%)
Place of birth for the foreign-born population - Costa Rica (%)
Place of birth for the foreign-born population - El Salvador (%)
Place of birth for the foreign-born population - Guatemala (%)
Place of birth for the foreign-born population - Honduras (%)
Place of birth for the foreign-born population - Mexico (%)
Place of birth for the foreign-born population - Nicaragua (%)
Place of birth for the foreign-born population - Panama (%)
Place of birth for the foreign-born population - Other Central America (%)
Place of birth for the foreign-born population - Argentina (%)
Place of birth for the foreign-born population - Bolivia (%)
Place of birth for the foreign-born population - Brazil (%)
Place of birth for the foreign-born population - Chile (%)
Place of birth for the foreign-born population - Colombia (%)
Place of birth for the foreign-born population - Ecuador (%)
Place of birth for the foreign-born population - Guyana (%)
Place of birth for the foreign-born population - Peru (%)
Place of birth for the foreign-born population - Uruguay (%)
Place of birth for the foreign-born population - Venezuela (%)
Place of birth for the foreign-born population - Other South America (%)
Place of birth for the foreign-born population - Canada (%)
Place of birth for the foreign-born population - Other Northern America (%)
Place of birth for the foreign-born population - Other (%)
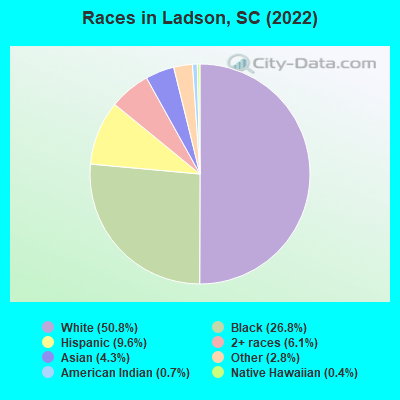
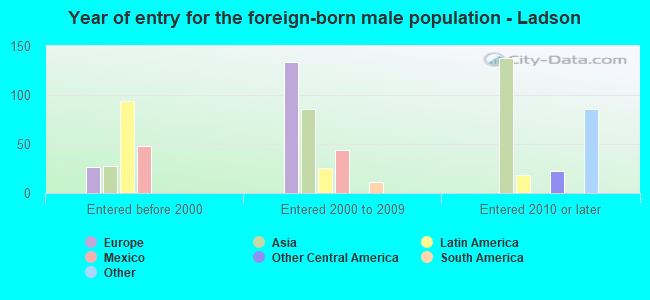
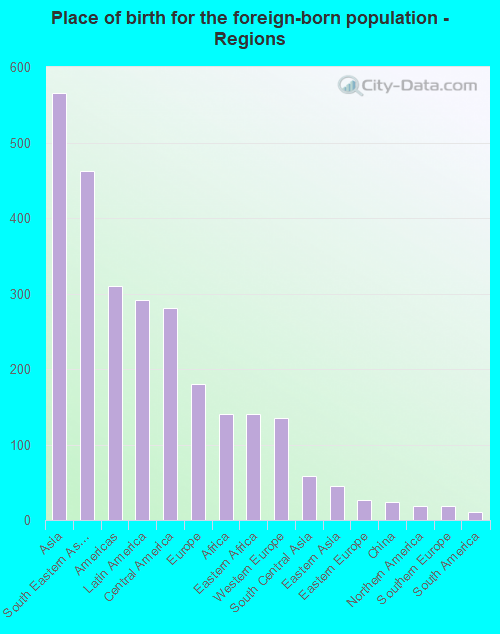
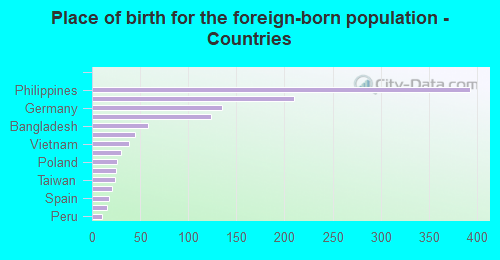
According to 2022 data, the most numerous races in Ladson, SC are White alone (7,952 residents), Black alone (4,190 residents), and Hispanic (1,502 residents). 86.7% of Ladson residents speak English at home. 7.7% of Ladson, SC residents are foreign-born (3.7% born in Asia, 1.9% born in Latin America, 1.2% born in Europe, 0.9% born in Africa), which is 34.7% greater than the foreign-born rate of 5.0% across the entire state of South Carolina.
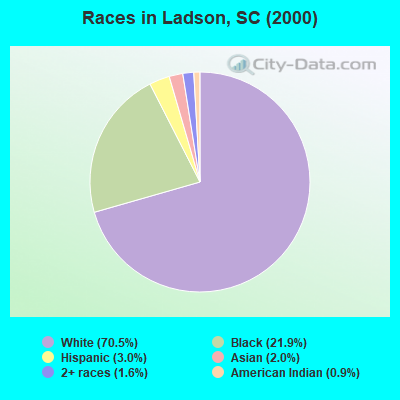
Race distribution in Ladson
2000 2022
2,652,291 66.1% White alone 1,178,486 29.4% Black alone 95,076 2.4% Hispanic 35,568 0.9% Asian alone 33,290 0.8% Two or more races 12,765 0.3% American Indian alone 3,266 0.08% Other race alone 1,270 0.03% Native Hawaiian and Other
3,301,739 62.5% White alone 1,313,290 24.9% Black alone 343,783 6.5% Hispanic 190,508 3.6% Two or more races 89,888 1.7% Asian alone 29,390 0.6% Other race alone 12,112 0.2% American Indian alone 1,924 0.04% Native Hawaiian and Other
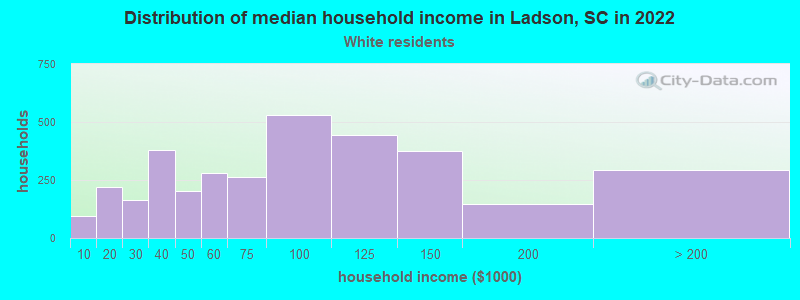
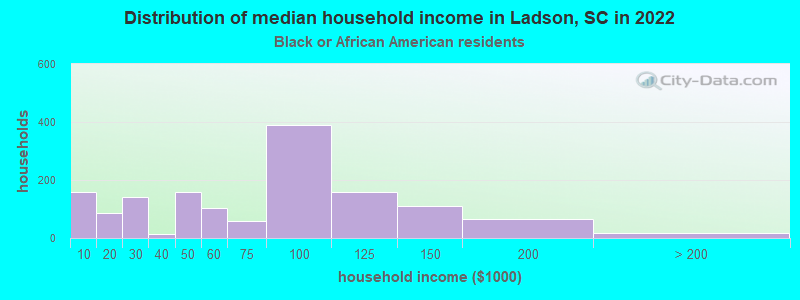
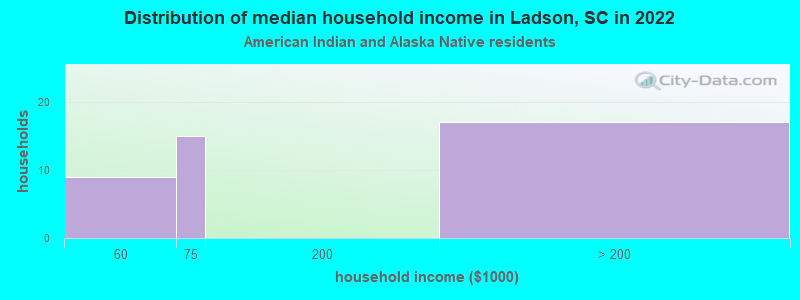
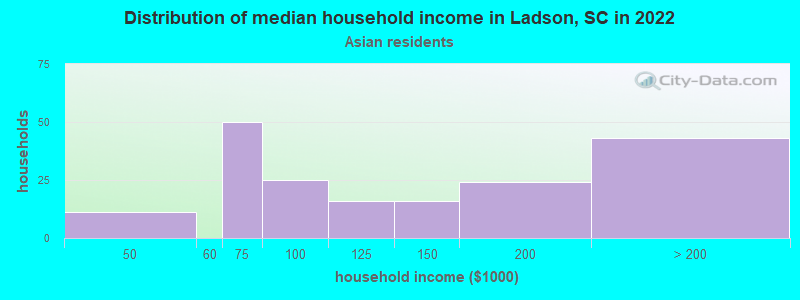
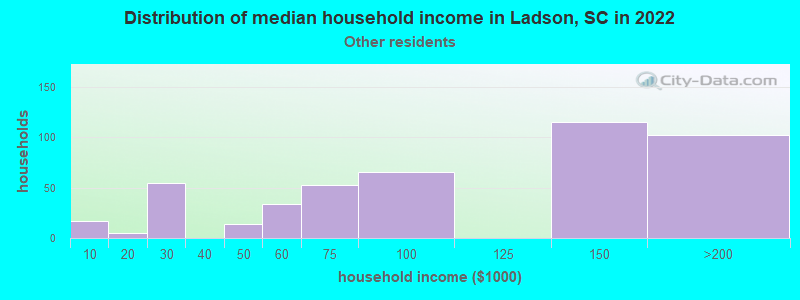
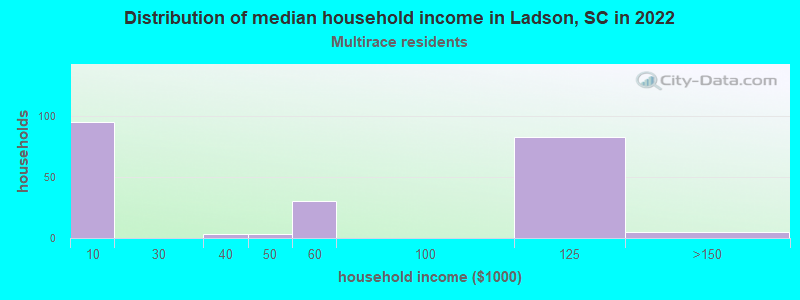
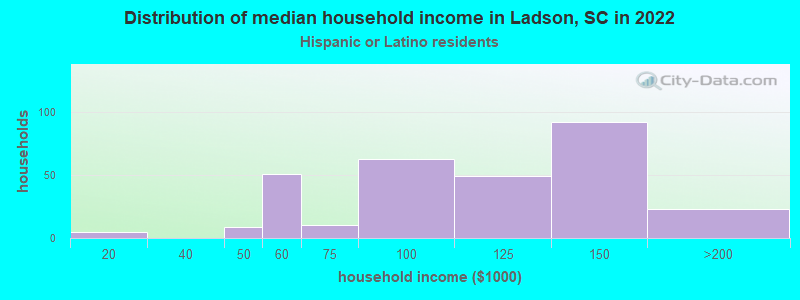
Income and house value in Ladson Median household income in 2022 $78,160 White non-Hispanic householders$64,193 Black householders$68,012 Asian householders$119,309 Some other race householders$141,096 Hispanic or Latino race householdersMedian 2022 house value $285,893 White Non-Hispanic householders$232,567 Black or African American householders$212,269 American Indian or Alaska Native householders $290,365 Asian householders$387,039 Some other race householders$265,939 Two or more races householders$288,989 Hispanic or Latino householders
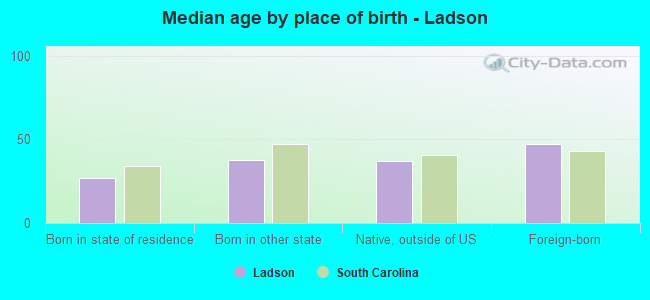
Median age by race in Ladson
39.0 Median age for White residents37.3 41.5 30.6 Median age for Black or African American residents21.0 35.5 44.4 Median age for American Indian / Alaska Native residents41.9 90.3 43.9 Median age for Asian residents40.3 42.0 -511,904,761.4 Median age for Native Hawaiian / Pacific Islander residents-346,445,824.4 -1,016,109,044.8 21.9 Median age for Other race residents27.9 17.1 15.0 Median age for Two or more races residents16.4 20.6 39.0 Median age for White alone residents37.3 41.6 18.0 Median age for Hispanic or Latino residents20.4 16.0
Owner/renter occupied households by race in Ladson
House owners and renters - White residents 2,960 85.5% Owner occupied500 14.5% Renter occupiedHouse owners and renters - Black or African American residents 1,016 69.1% Owner occupied454 30.9% Renter occupiedHouse owners and renters - American Indian / Alaska Native residents 33 81.7% Owner occupied7 18.3% Renter occupiedHouse owners and renters - Asian residents 121 87.6% Owner occupied17 12.4% Renter occupiedHouse owners and renters - Other race residents 210 62.7% Owner occupied125 37.3% Renter occupiedHouse owners and renters - Two or more races residents 35 13.3% Owner occupied229 86.7% Renter occupiedHouse owners and renters - White alone residents 2,951 85.7% Owner occupied491 14.3% Renter occupiedHouse owners and renters - Hispanic or Latino residents 95 37.8% Owner occupied157 62.2% Renter occupied
Language usage in Ladson
English speakers - Total 86.7% of residents of Ladson speak English at home.
8.1% of residents speak Spanish at home 612 51.0% Speak English very well587 49.0% Speak English less than very well4.6% of residents speak other language at home 506 73.4% Speak English very well183 26.6% Speak English less than very well
English speakers - Born in the United States 89.7% of residents of Ladson speak English at home.
8.9% of residents speak Spanish at home 323 57.5% Speak English very well239 42.5% Speak English less than very well0.6% of residents speak other language at home 39 100.0% Speak English very well
English speakers - Native, born elsewhere 52.9% of residents of Ladson speak English at home.
30.3% of residents speak Spanish at home 36 100.0% Speak English very well6.7% of residents speak other language at home 8 100.0% Speak English very well
English speakers - Foreign-born 21.9% of residents of Ladson speak English at home.
21.5% of residents speak Spanish at home 90 36.4% Speak English very well157 63.6% Speak English less than very well44.3% of residents speak other language at home 349 68.6% Speak English very well160 31.4% Speak English less than very well
White (Caucasian) - Speak only English Native:
98.2% (7,354)Foreign-born:
61.2% (95)
White (Caucasian) - Speak another language Native:
1.8% (135)Foreign-born:
44.0% (69)
Black or African American - Speak only English Native:
99.8% (3,994)Foreign-born:
9.9% (13)
Asian - Speak only English Native:
30.2% (59)Foreign-born:
10.3% (48)
Asian - Speak another language Native:
84.6% (164)Foreign-born:
84.8% (392)
Other race - Speak only English Native:
54.2% (525)Foreign-born:
57.4% (107)
Other race - Speak another language Native:
45.9% (444)Foreign-born:
60.3% (112)
Two or more races - Speak another language Native:
39.5% (569)Foreign-born:
82.8% (150)
White alone - Speak only English Native:
97.9% (7,327)Foreign-born:
66.6% (101)
White alone - Speak another language Native:
2.1% (154)Foreign-born:
37.3% (56)
Hispanic or Latino - Speak only English Native:
25.9% (261)Foreign-born:
22.2% (74)
Hispanic or Latino - Speak another language Native:
78.5% (791)Foreign-born:
77.8% (259)
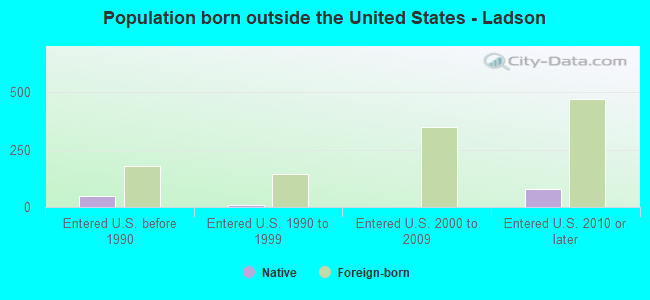
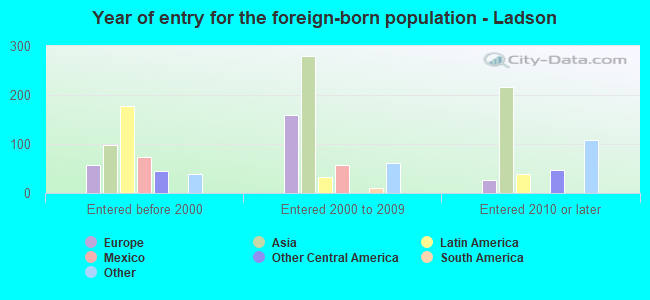
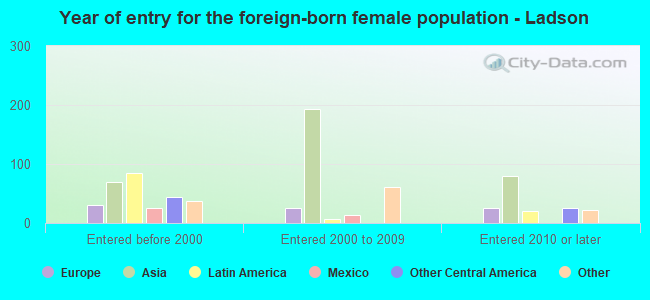
Foreign-born residents in Ladson 1,198 residents are foreign born (3.7% Asia , 1.9% Latin America , 1.2% Europe , 0.9% Africa ).
This city:
7.7%South Carolina:
5.3%
Marital status for residents in Ladson Marital status - White (Caucasian) population 15 years and over
Males 39.0% Never married43.6% Now married2.7% Separated6.6% Widowed8.1% DivorcedFemales 24.5% Never married52.9% Now married3.6% Separated8.3% Widowed10.7% DivorcedWomen who gave birth in the past 12 months Now married:
100.0% (116)Unmarried:
0.0% (0)
Women who did not give birth in the past 12 months Now married:
51.1% (777)Unmarried:
48.9% (745)
Marital status - Black or African American population 15 years and over
Males 42.7% Never married34.7% Now married11.1% Separated3.2% Widowed8.2% DivorcedFemales 40.2% Never married32.5% Now married5.4% Separated15.5% Widowed6.4% DivorcedWomen who gave birth in the past 12 months Now married:
0.0% (0)Unmarried:
100.0% (39)
Women who did not give birth in the past 12 months Now married:
50.8% (464)Unmarried:
49.2% (450)
Marital status - American Indian / Alaska Native population 15 years and over
Males 17.2% Never married65.6% Now married0.0% Separated0.0% Widowed17.2% DivorcedFemales 0.0% Never married22.6% Now married0.0% Separated22.6% Widowed54.8% DivorcedMarital status - Asian population 15 years and over
Males 50.2% Never married28.3% Now married0.0% Separated9.9% Widowed11.7% DivorcedFemales 46.7% Never married31.0% Now married2.4% Separated7.1% Widowed12.8% DivorcedWomen who gave birth in the past 12 months Now married:
100.0% (12)Unmarried:
0.0% (0)
Women who did not give birth in the past 12 months Now married:
26.5% (53)Unmarried:
73.5% (147)
Marital status - Other race population 15 years and over
Males 59.4% Never married27.0% Now married0.0% Separated13.7% Widowed0.0% DivorcedFemales 37.9% Never married15.2% Now married1.9% Separated3.9% Widowed41.1% DivorcedWomen who did not give birth in the past 12 months Now married:
5.3% (12)Unmarried:
94.7% (216)
Marital status - Two or more races population 15 years and over
Males 45.5% Never married54.5% Now married0.0% Separated0.0% Widowed0.0% DivorcedFemales 58.6% Never married28.2% Now married0.0% Separated2.2% Widowed11.0% DivorcedWomen who gave birth in the past 12 months Now married:
0.0% (0)Unmarried:
100.0% (19)
Women who did not give birth in the past 12 months Now married:
26.7% (74)Unmarried:
73.3% (202)
Marital status - White alone, not Hispanic / Latino population 15 years and over
Males 39.2% Never married43.5% Now married2.5% Separated6.6% Widowed8.1% DivorcedFemales 23.8% Never married53.9% Now married3.6% Separated7.9% Widowed10.9% DivorcedWomen who gave birth in the past 12 months Now married:
100.0% (118)Unmarried:
0.0% (0)
Women who did not give birth in the past 12 months Now married:
52.2% (786)Unmarried:
47.8% (720)
Marital status - Hispanic or Latino population 15 years and over
Males 68.2% Never married21.3% Now married1.7% Separated8.9% Widowed0.0% DivorcedFemales 52.3% Never married19.8% Now married1.5% Separated7.5% Widowed19.0% DivorcedWomen who did not give birth in the past 12 months Now married:
18.7% (63)Unmarried:
81.3% (273)
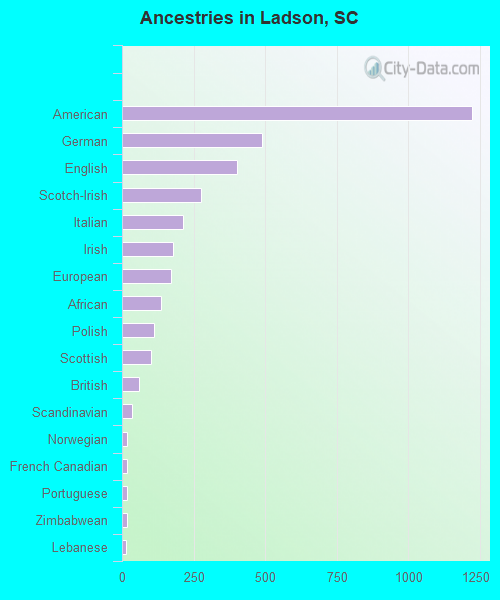
Ancestries in Ladson
1,222 14.4% American491 5.8% German401 4.7% English277 3.3% Scotch-Irish215 2.5% Italian177 2.1% Irish171 2.0% European138 1.6% African111 1.3% Polish103 1.2% Scottish58 0.7% British36 0.4% Scandinavian18 0.2% Norwegian17 0.2% French Canadian16 0.2% Portuguese16 0.2% Zimbabwean15 0.2% Lebanese9 0.1% Russian4 0.05% Northern European
Geographical mobility in Ladson Same house 1 year ago 6,621 84.2% White (Caucasian)3,642 87.1% Black or African American85 57.0% American Indian / Alaska Native556 77.7% Asian30 100.0% Native Hawaiian / Pacific Islander1,105 95.3% Other race1,732 95.5% Two or more races6,596 84.1% White alone, not Hispanic / Latino1,398 92.5% Hispanic or LatinoMoved within same county 517 6.6% White / Caucasian313 7.5% Black or African American36 5.0% Asian39 2.1% Two or more races525 6.7% White alone, not Hispanic / LatinoMoved within same state 256 3.3% White / Caucasian154 3.7% Black or African American37 24.7% American Indian / Alaska Native35 5.0% Asian49 2.7% Two or more races250 3.2% White alone, not Hispanic / Latino7 0.4% Hispanic or LatinoMoved from different state 455 5.8% White / Caucasian83 2.0% Black or African American19 12.6% American Indian / Alaska Native51 4.4% Other race465 5.9% White alone, not Hispanic / Latino60 4.0% Hispanic or LatinoMoved from abroad 84 11.8% Asian
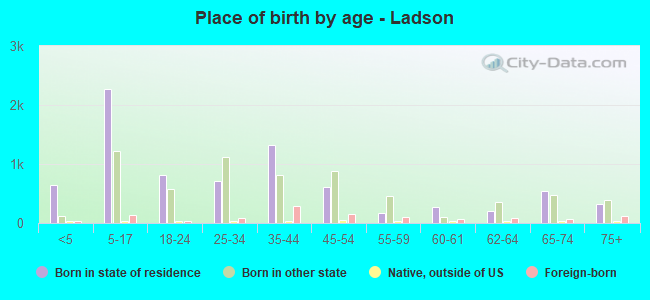
Children Nativity (place of birth) in Ladson
Children under 6 years - Living with two parents Both parents native 730 100.0% NativeBoth parents foreign-born 26 100.0% Foreign-bornOne native, one foreign-born parent 18 100.0% NativeChildren under 6 years - Living with one parent Native parent 189 100.0% NativeForeign-born parent 115 92.0% Native10 8.0% Foreign-bornChildren 6 to 17 years - Living with two parents Both parents native 1,650 99.9% Native1 0.1% Foreign-bornBoth parents foreign-born 128 69.4% Native56 30.6% Foreign-bornOne native, one foreign-born parent 203 87.2% Native30 12.8% Foreign-bornChildren 6 to 17 years - Living with one parent Native parent 844 100.0% NativeForeign-born parent 155 54.9% Native127 45.1% Foreign-born
Grandparents responsible for own grandchildren in Ladson
Grandparents (30 to 59 years) White / Caucasian 62 100.0% Responsible for grandchildrenBlack or African American 13 100.0% Responsible for grandchildrenAsian 6 47.9% Responsible for grandchildren7 52.1% Not responsible for grandchildrenWhite alone, not Hispanic / Latino 62 100.0% Responsible for grandchildrenGrandparents (60 years and over) White / Caucasian 43 45.2% Responsible for grandchildren52 54.8% Not responsible for grandchildrenBlack or African American 40 26.7% Responsible for grandchildren109 73.3% Not responsible for grandchildrenAsian 79 100.0% Not responsible for grandchildrenWhite alone, not Hispanic / Latino 43 44.8% Responsible for grandchildren53 55.2% Not responsible for grandchildren