Races in Lafayette, Indiana (IN) Detailed Stats
Data:
Races - White alone (%)
Races - White alone (% change since 2000)
Races - Black alone (%)
Races - Black alone (% change since 2000)
Races - American Indian alone (%)
Races - American Indian alone (% change since 2000)
Races - Asian alone (%)
Races - Asian alone (% change since 2000)
Races - Hispanic (%)
Races - Hispanic (% change since 2000)
Races - Native Hawaiian and Other Pacific Islander alone (%)
Races - Native Hawaiian and Other Pacific Islander alone (% change since 2000)
Races - Two or more races(%)
Races - Two or more races(% change since 2000)
Races - Other race alone (%)
Races - Other race alone (% change since 2000)
Racial diversity
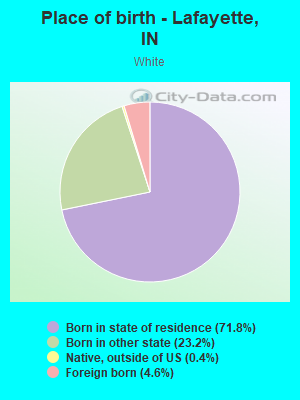
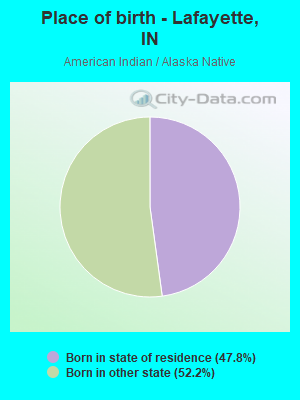
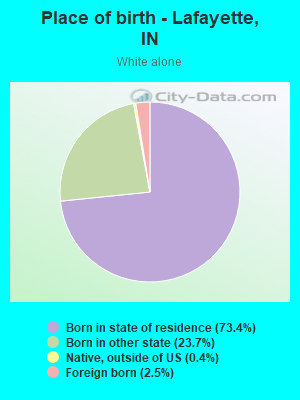
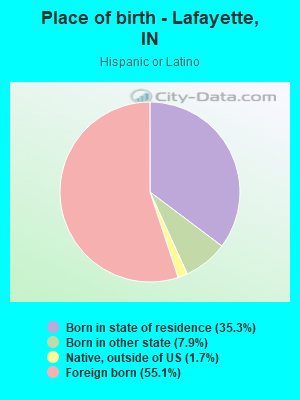
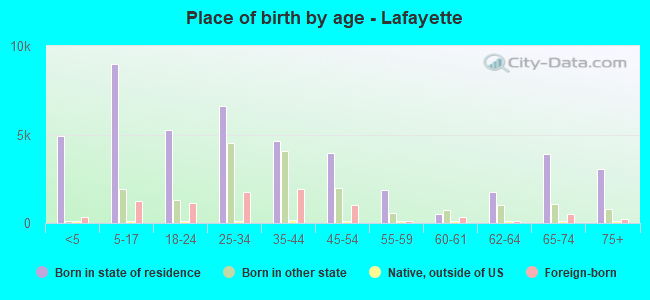
Place of birth - Born in state of residence (%)
Place of birth - Born in state of residence (%) - White
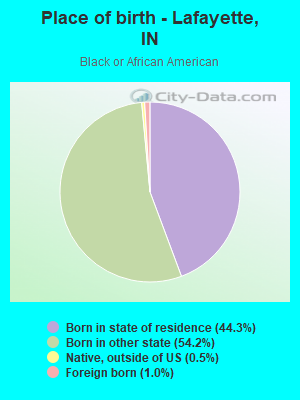
Place of birth - Born in state of residence (%) - Black or African American
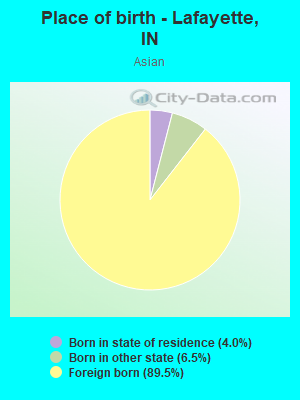
Place of birth - Born in state of residence (%) - Asian
Place of birth - Born in state of residence (%) - Hispanic or Latino
Place of birth - Born in state of residence (%) - American Indian and Alaska Native
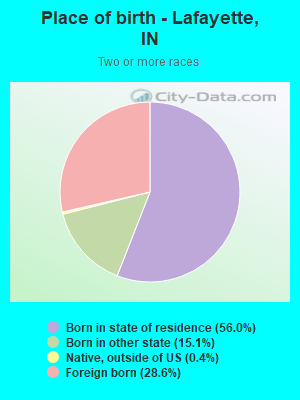
Place of birth - Born in state of residence (%) - Multirace
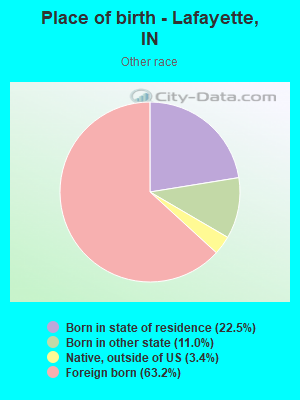
Place of birth - Born in state of residence (%) - Other Race
Place of birth - Born in other state (%)
Place of birth - Born in other state (%) - White
Place of birth - Born in other state (%) - Black or African American
Place of birth - Born in other state (%) - Asian
Place of birth - Born in other state (%) - Hispanic or Latino
Place of birth - Born in other state (%) - American Indian and Alaska Native
Place of birth - Born in other state (%) - Multirace
Place of birth - Born in other state (%) - Other Race
Place of birth - Native, outside of US (%)
Place of birth - Native, outside of US (%) - White
Place of birth - Native, outside of US (%) - Black or African American
Place of birth - Native, outside of US (%) - Asian
Place of birth - Native, outside of US (%) - Hispanic or Latino
Place of birth - Native, outside of US (%) - American Indian and Alaska Native
Place of birth - Native, outside of US (%) - Multirace
Place of birth - Native, outside of US (%) - Other Race
Place of birth - Foreign born (%)
Place of birth - Foreign born (%) - White
Place of birth - Foreign born (%) - Black or African American
Place of birth - Foreign born (%) - Asian
Place of birth - Foreign born (%) - Hispanic or Latino
Place of birth - Foreign born (%) - American Indian and Alaska Native
Place of birth - Foreign born (%) - Multirace
Place of birth - Foreign born (%) - Other Race
Residents speaking English at home (%)
Residents speaking English at home - Born in the United States (%)
Residents speaking English at home - Native, born elsewhere (%)
Residents speaking English at home - Foreign born (%)
Residents speaking Spanish at home (%)
Residents speaking Spanish at home - Born in the United States (%)
Residents speaking Spanish at home - Native, born elsewhere (%)
Residents speaking Spanish at home - Foreign born (%)
Residents speaking other language at home (%)
Residents speaking other language at home - Born in the United States (%)
Residents speaking other language at home - Native, born elsewhere (%)
Residents speaking other language at home - Foreign born (%)
Marital status - Never married (%)
Marital status - Now married (%)
Marital status - Separated (%)
Marital status - Widowed (%)
Marital status - Divorced (%)
Ancestries Reported - Arab (%)
Ancestries Reported - Czech (%)
Ancestries Reported - Danish (%)
Ancestries Reported - Dutch (%)
Ancestries Reported - English (%)
Ancestries Reported - French (%)
Ancestries Reported - French Canadian (%)
Ancestries Reported - German (%)
Ancestries Reported - Greek (%)
Ancestries Reported - Hungarian (%)
Ancestries Reported - Irish (%)
Ancestries Reported - Italian (%)
Ancestries Reported - Lithuanian (%)
Ancestries Reported - Norwegian (%)
Ancestries Reported - Polish (%)
Ancestries Reported - Portuguese (%)
Ancestries Reported - Russian (%)
Ancestries Reported - Scotch-Irish (%)
Ancestries Reported - Scottish (%)
Ancestries Reported - Slovak (%)
Ancestries Reported - Subsaharan African (%)
Ancestries Reported - Swedish (%)
Ancestries Reported - Swiss (%)
Ancestries Reported - Ukrainian (%)
Ancestries Reported - United States (%)
Ancestries Reported - Welsh (%)
Ancestries Reported - West Indian (%)
Ancestries Reported - Other (%)
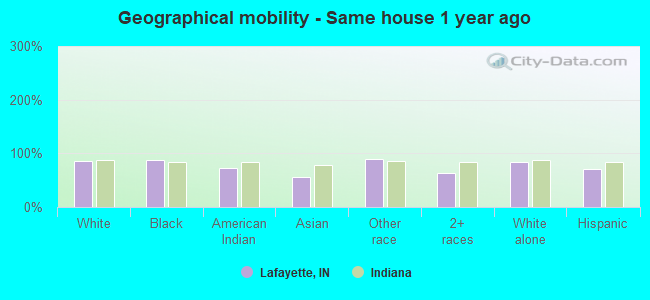
Geographical mobility - Same house 1 year ago (%)
Geographical mobility - Same house 1 year ago (%) - White
Geographical mobility - Same house 1 year ago (%) - Black or African American
Geographical mobility - Same house 1 year ago (%) - Asian
Geographical mobility - Same house 1 year ago (%) - Hispanic or Latino
Geographical mobility - Same house 1 year ago (%) - American Indian and Alaska Native
Geographical mobility - Same house 1 year ago (%) - Multirace
Geographical mobility - Same house 1 year ago (%) - Other Race
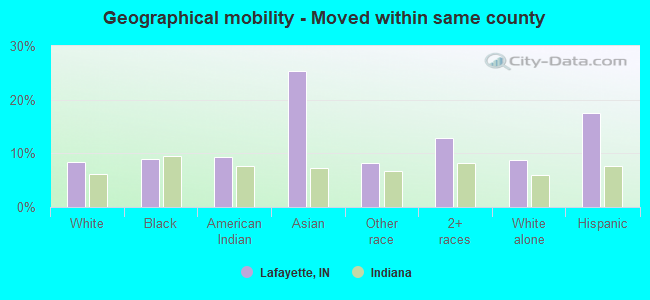
Geographical mobility - Moved within same county (%)
Geographical mobility - Moved within same county (%) - White
Geographical mobility - Moved within same county (%) - Black or African American
Geographical mobility - Moved within same county (%) - Asian
Geographical mobility - Moved within same county (%) - Hispanic or Latino
Geographical mobility - Moved within same county (%) - American Indian and Alaska Native
Geographical mobility - Moved within same county (%) - Multirace
Geographical mobility - Moved within same county (%) - Other Race
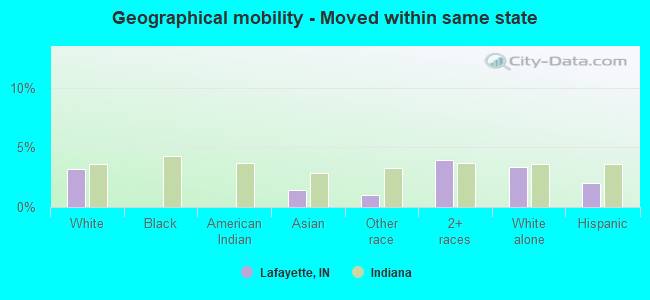
Geographical mobility - Moved from different county within same state (%)
Geographical mobility - Moved from different county within same state (%) - White
Geographical mobility - Moved from different county within same state (%) - Black or African American
Geographical mobility - Moved from different county within same state (%) - Asian
Geographical mobility - Moved from different county within same state (%) - Hispanic or Latino
Geographical mobility - Moved from different county within same state (%) - American Indian and Alaska Native
Geographical mobility - Moved from different county within same state (%) - Multirace
Geographical mobility - Moved from different county within same state (%) - Other Race
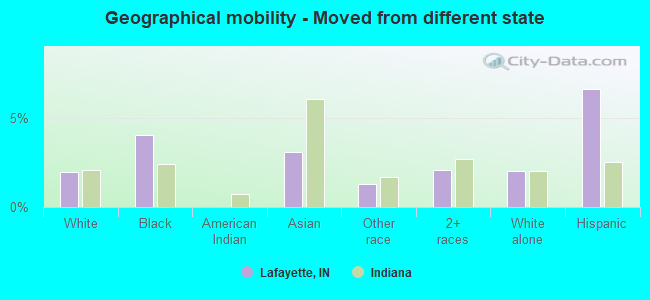
Geographical mobility - Moved from different state (%)
Geographical mobility - Moved from different state (%) - White
Geographical mobility - Moved from different state (%) - Black or African American
Geographical mobility - Moved from different state (%) - Asian
Geographical mobility - Moved from different state (%) - Hispanic or Latino
Geographical mobility - Moved from different state (%) - American Indian and Alaska Native
Geographical mobility - Moved from different state (%) - Multirace
Geographical mobility - Moved from different state (%) - Other Race
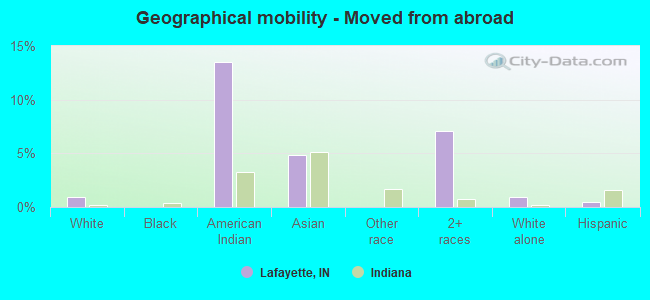
Geographical mobility - Moved from abroad (%)
Geographical mobility - Moved from abroad (%) - White
Geographical mobility - Moved from abroad (%) - Black or African American
Geographical mobility - Moved from abroad (%) - Asian
Geographical mobility - Moved from abroad (%) - Hispanic or Latino
Geographical mobility - Moved from abroad (%) - American Indian and Alaska Native
Geographical mobility - Moved from abroad (%) - Multirace
Geographical mobility - Moved from abroad (%) - Other Race
Place of birth for the foreign-born population - Ireland (%)
Place of birth for the foreign-born population - Denmark (%)
Place of birth for the foreign-born population - Norway (%)
Place of birth for the foreign-born population - Sweden (%)
Place of birth for the foreign-born population - United Kingdom (%)
Place of birth for the foreign-born population - England (%)
Place of birth for the foreign-born population - Scotland (%)
Place of birth for the foreign-born population - Other Northern Europe (%)
Place of birth for the foreign-born population - Austria (%)
Place of birth for the foreign-born population - Belgium (%)
Place of birth for the foreign-born population - France (%)
Place of birth for the foreign-born population - Germany (%)
Place of birth for the foreign-born population - Netherlands (%)
Place of birth for the foreign-born population - Switzerland (%)
Place of birth for the foreign-born population - Other Western Europe (%)
Place of birth for the foreign-born population - Greece (%)
Place of birth for the foreign-born population - Italy (%)
Place of birth for the foreign-born population - Portugal (%)
Place of birth for the foreign-born population - Spain (%)
Place of birth for the foreign-born population - Other Southern Europe (%)
Place of birth for the foreign-born population - Albania (%)
Place of birth for the foreign-born population - Belarus (%)
Place of birth for the foreign-born population - Bosnia and Herzegovina (%)
Place of birth for the foreign-born population - Bulgaria (%)
Place of birth for the foreign-born population - Croatia (%)
Place of birth for the foreign-born population - Czechoslovakia (%)
Place of birth for the foreign-born population - Hungary (%)
Place of birth for the foreign-born population - Latvia (%)
Place of birth for the foreign-born population - Lithuania (%)
Place of birth for the foreign-born population - North Macedonia (Macedonia) (%)
Place of birth for the foreign-born population - Moldova (%)
Place of birth for the foreign-born population - Poland (%)
Place of birth for the foreign-born population - Romania (%)
Place of birth for the foreign-born population - Russia (%)
Place of birth for the foreign-born population - Serbia (%)
Place of birth for the foreign-born population - Ukraine (%)
Place of birth for the foreign-born population - Other Eastern Europe (%)
Place of birth for the foreign-born population - China (%)
Place of birth for the foreign-born population - Hong Kong (%)
Place of birth for the foreign-born population - Taiwan (%)
Place of birth for the foreign-born population - Japan (%)
Place of birth for the foreign-born population - Korea (%)
Place of birth for the foreign-born population - Other Eastern Asia (%)
Place of birth for the foreign-born population - Afghanistan (%)
Place of birth for the foreign-born population - Bangladesh (%)
Place of birth for the foreign-born population - India (%)
Place of birth for the foreign-born population - Iran (%)
Place of birth for the foreign-born population - Kazakhstan (%)
Place of birth for the foreign-born population - Nepal (%)
Place of birth for the foreign-born population - Pakistan (%)
Place of birth for the foreign-born population - Sri Lanka (%)
Place of birth for the foreign-born population - Uzbekistan (%)
Place of birth for the foreign-born population - Other South Central Asia (%)
Place of birth for the foreign-born population - Burma (%)
Place of birth for the foreign-born population - Cambodia (%)
Place of birth for the foreign-born population - Indonesia (%)
Place of birth for the foreign-born population - Laos (%)
Place of birth for the foreign-born population - Malaysia (%)
Place of birth for the foreign-born population - Philippines (%)
Place of birth for the foreign-born population - Singapore (%)
Place of birth for the foreign-born population - Thailand (%)
Place of birth for the foreign-born population - Vietnam (%)
Place of birth for the foreign-born population - Other South Eastern Asia (%)
Place of birth for the foreign-born population - Armenia (%)
Place of birth for the foreign-born population - Iraq (%)
Place of birth for the foreign-born population - Israel (%)
Place of birth for the foreign-born population - Jordan (%)
Place of birth for the foreign-born population - Kuwait (%)
Place of birth for the foreign-born population - Lebanon (%)
Place of birth for the foreign-born population - Saudi Arabia (%)
Place of birth for the foreign-born population - Syria (%)
Place of birth for the foreign-born population - Turkey (%)
Place of birth for the foreign-born population - Yemen (%)
Place of birth for the foreign-born population - Other Western Asia (%)
Place of birth for the foreign-born population - Eritrea (%)
Place of birth for the foreign-born population - Ethiopia (%)
Place of birth for the foreign-born population - Kenya (%)
Place of birth for the foreign-born population - Somalia (%)
Place of birth for the foreign-born population - Uganda (%)
Place of birth for the foreign-born population - Zimbabwe (%)
Place of birth for the foreign-born population - Other Eastern Africa (%)
Place of birth for the foreign-born population - Cameroon (%)
Place of birth for the foreign-born population - Congo (%)
Place of birth for the foreign-born population - Democratic Republic of Congo (Zaire) (%)
Place of birth for the foreign-born population - Other Middle Africa (%)
Place of birth for the foreign-born population - Egypt (%)
Place of birth for the foreign-born population - Morocco (%)
Place of birth for the foreign-born population - Sudan (%)
Place of birth for the foreign-born population - Other Northern Africa (%)
Place of birth for the foreign-born population - South Africa (%)
Place of birth for the foreign-born population - Other Southern Africa (%)
Place of birth for the foreign-born population - Cabo Verde (%)
Place of birth for the foreign-born population - Ghana (%)
Place of birth for the foreign-born population - Liberia (%)
Place of birth for the foreign-born population - Nigeria (%)
Place of birth for the foreign-born population - Senegal (%)
Place of birth for the foreign-born population - Sierra Leone (%)
Place of birth for the foreign-born population - Other Western Africa (%)
Place of birth for the foreign-born population - Australia (%)
Place of birth for the foreign-born population - New Zealand (%)
Place of birth for the foreign-born population - Fiji (%)
Place of birth for the foreign-born population - Micronesia (%)
Place of birth for the foreign-born population - Bahamas (%)
Place of birth for the foreign-born population - Barbados (%)
Place of birth for the foreign-born population - Cuba (%)
Place of birth for the foreign-born population - Dominica (%)
Place of birth for the foreign-born population - Dominican Republic (%)
Place of birth for the foreign-born population - Grenada (%)
Place of birth for the foreign-born population - Haiti (%)
Place of birth for the foreign-born population - Jamaica (%)
Place of birth for the foreign-born population - St. Vincent and the Grenadines (%)
Place of birth for the foreign-born population - Trinidad and Tobago (%)
Place of birth for the foreign-born population - West Indies (%)
Place of birth for the foreign-born population - Other Caribbean (%)
Place of birth for the foreign-born population - Belize (%)
Place of birth for the foreign-born population - Costa Rica (%)
Place of birth for the foreign-born population - El Salvador (%)
Place of birth for the foreign-born population - Guatemala (%)
Place of birth for the foreign-born population - Honduras (%)
Place of birth for the foreign-born population - Mexico (%)
Place of birth for the foreign-born population - Nicaragua (%)
Place of birth for the foreign-born population - Panama (%)
Place of birth for the foreign-born population - Other Central America (%)
Place of birth for the foreign-born population - Argentina (%)
Place of birth for the foreign-born population - Bolivia (%)
Place of birth for the foreign-born population - Brazil (%)
Place of birth for the foreign-born population - Chile (%)
Place of birth for the foreign-born population - Colombia (%)
Place of birth for the foreign-born population - Ecuador (%)
Place of birth for the foreign-born population - Guyana (%)
Place of birth for the foreign-born population - Peru (%)
Place of birth for the foreign-born population - Uruguay (%)
Place of birth for the foreign-born population - Venezuela (%)
Place of birth for the foreign-born population - Other South America (%)
Place of birth for the foreign-born population - Canada (%)
Place of birth for the foreign-born population - Other Northern America (%)
Place of birth for the foreign-born population - Other (%)
Latest news about races in Lafayette, IN collected exclusively by city-data.com from local newspapers, TV, and radio stations
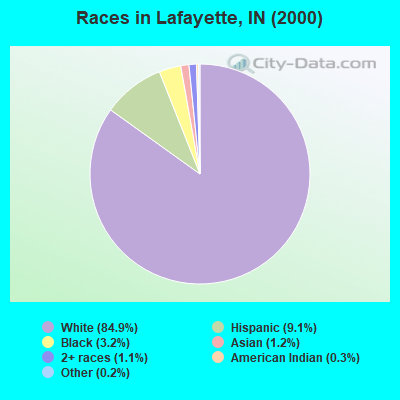
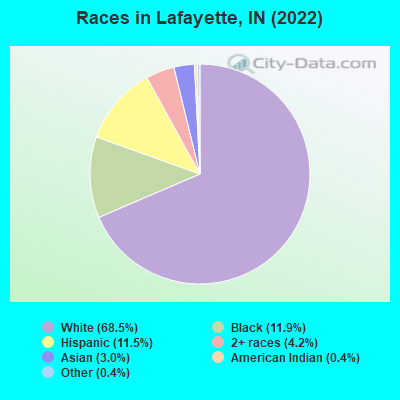
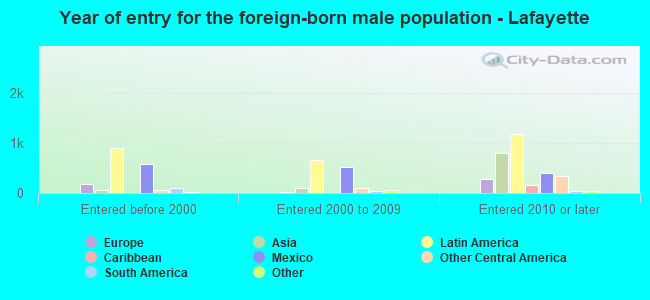
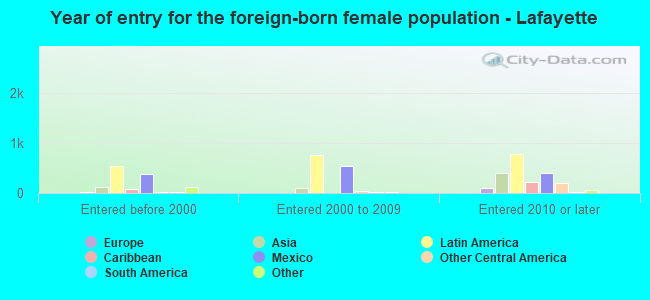
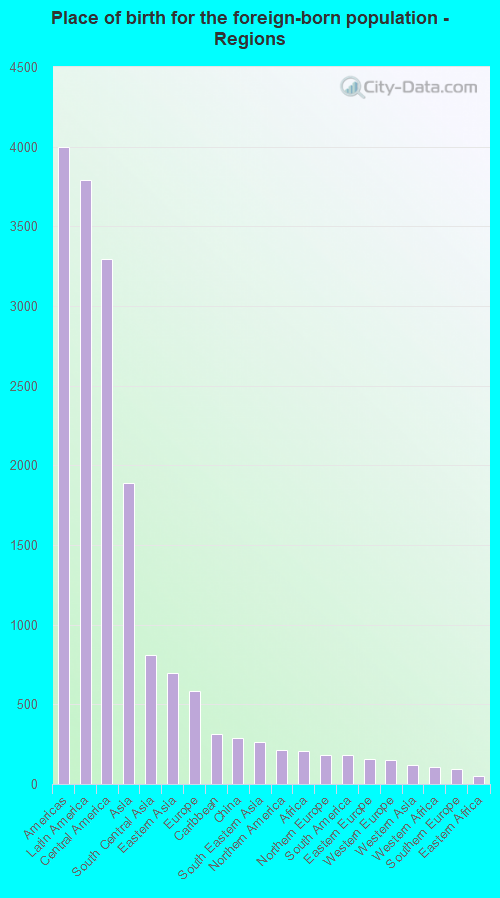
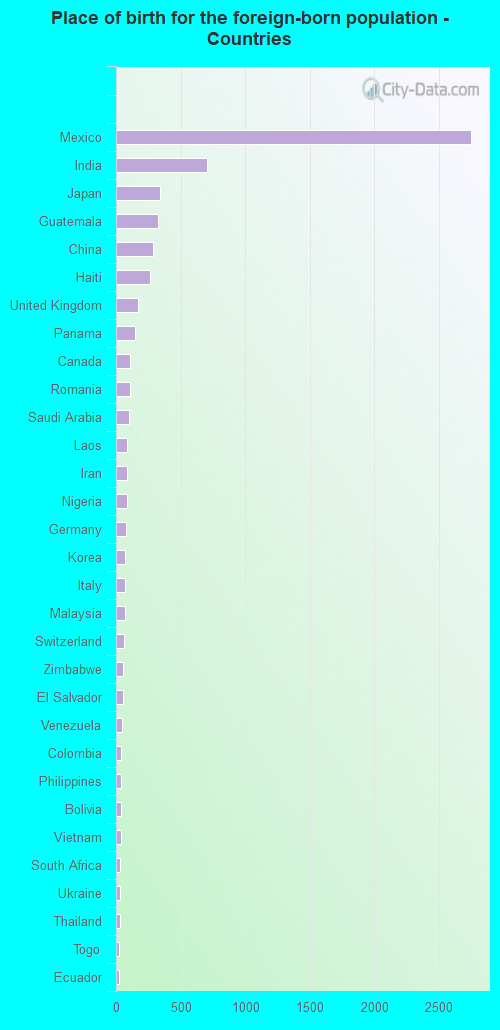
According to 2022 data, the most numerous races in Lafayette, IN are White alone (49,569 residents), Black alone (8,602 residents), and Hispanic (8,316 residents). 89.0% of Lafayette residents speak English at home. 9.3% of Lafayette, IN residents are foreign-born (4.9% born in Latin America, 2.4% born in Asia), which is 35.7% greater than the foreign-born rate of 6.0% across the entire state of Indiana.
Race distribution in Lafayette
2000 2022
5,219,373 85.8% White alone 505,462 8.3% Black alone 214,536 3.5% Hispanic 61,115 1.0% Two or more races 58,424 1.0% Asian alone 13,654 0.2% American Indian alone 6,348 0.1% Other race alone 1,573 0.03% Native Hawaiian and Other
5,192,455 76.0% White alone 628,054 9.2% Black alone 534,528 7.8% Hispanic 263,242 3.9% Two or more races 172,880 2.5% Asian alone 33,467 0.5% Other race alone 5,866 0.09% American Indian alone 2,545 0.04% Native Hawaiian and Other
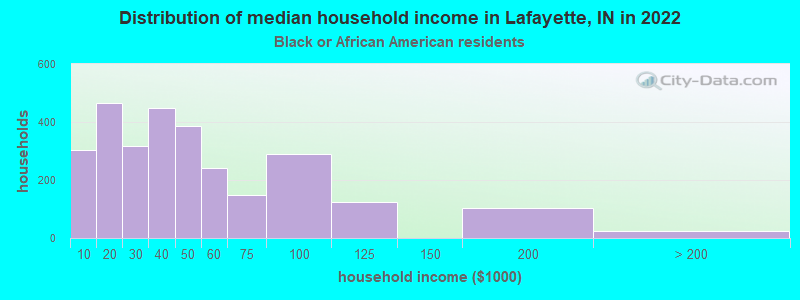
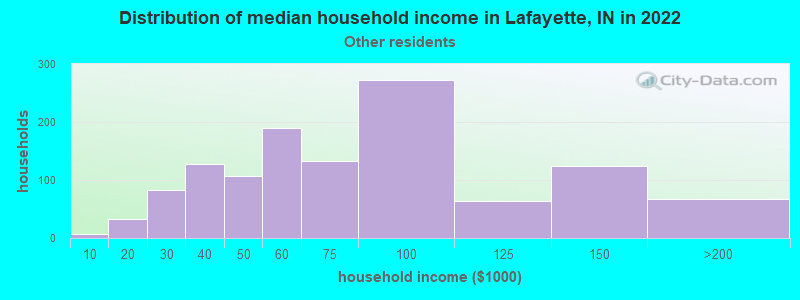
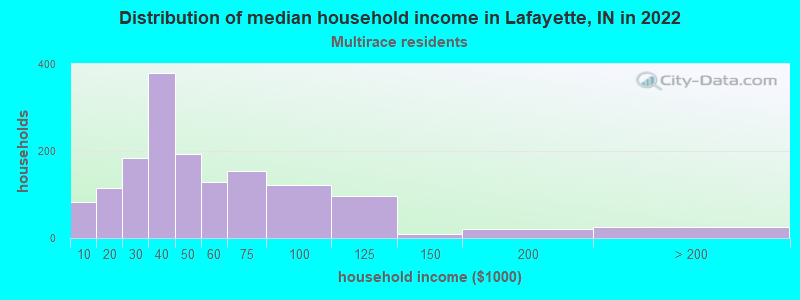
Income and house value in Lafayette Median household income in 2022 $55,349 White non-Hispanic householders$36,028 Black householders$11,138 American Indian and Alaska Native householders$51,098 Asian householders$81,674 Some other race householders$39,488 Two or more races householders$45,750 Hispanic or Latino race householdersMedian 2022 house value $157,645 White Non-Hispanic householders$152,757 Black or African American householders$132,157 American Indian or Alaska Native householders $128,490 Asian householders$136,870 Some other race householders$127,792 Two or more races householders$141,933 Hispanic or Latino householders
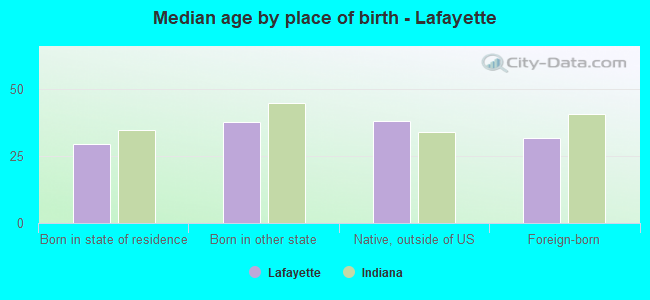
Median age by race in Lafayette
36.9 Median age for White residents33.6 38.2 27.2 Median age for Black or African American residents16.9 28.5 60.6 Median age for American Indian / Alaska Native residents60.4 -666,666,666.0 26.3 Median age for Asian residents25.8 33.1 -666,666,666.0 Median age for Native Hawaiian / Pacific Islander residents-666,666,666.0 -666,666,666.0 34.6 Median age for Other race residents39.8 28.3 26.5 Median age for Two or more races residents24.7 27.8 37.2 Median age for White alone residents33.9 38.4 24.6 Median age for Hispanic or Latino residents24.3 26.1
Owner/renter occupied households by race in Lafayette
House owners and renters - White residents 12,599 53.1% Owner occupied11,139 46.9% Renter occupiedHouse owners and renters - Black or African American residents 300 7.8% Owner occupied3,547 92.2% Renter occupiedHouse owners and renters - American Indian / Alaska Native residents 41 50.2% Owner occupied40 49.8% Renter occupiedHouse owners and renters - Asian residents 396 33.3% Owner occupied793 66.7% Renter occupiedHouse owners and renters - Other race residents 518 45.4% Owner occupied624 54.6% Renter occupiedHouse owners and renters - Two or more races residents 841 35.1% Owner occupied1,555 64.9% Renter occupiedHouse owners and renters - White alone residents 12,451 53.5% Owner occupied10,812 46.5% Renter occupiedHouse owners and renters - Hispanic or Latino residents 1,178 40.7% Owner occupied1,715 59.3% Renter occupied
Language usage in Lafayette
English speakers - Total 89.0% of residents of Lafayette speak English at home.
7.5% of residents speak Spanish at home 1,647 33.0% Speak English very well3,349 67.0% Speak English less than very well3.5% of residents speak other language at home 872 37.3% Speak English very well1,464 62.7% Speak English less than very well
English speakers - Born in the United States 95.8% of residents of Lafayette speak English at home.
3.8% of residents speak Spanish at home 387 56.5% Speak English very well298 43.5% Speak English less than very well0.4% of residents speak other language at home 75 100.0% Speak English very well
English speakers - Native, born elsewhere 58.1% of residents of Lafayette speak English at home.
41.9% of residents speak Spanish at home 86 59.7% Speak English very well58 40.3% Speak English less than very well
English speakers - Foreign-born 36.5% of residents of Lafayette speak English at home.
38.6% of residents speak Spanish at home 205 6.5% Speak English very well2,937 93.5% Speak English less than very well24.9% of residents speak other language at home 568 28.0% Speak English very well1,464 72.0% Speak English less than very well
White (Caucasian) - Speak only English Native:
98.2% (45,351)Foreign-born:
46.5% (1,082)
White (Caucasian) - Speak another language Native:
1.8% (840)Foreign-born:
53.5% (1,243)
Black or African American - Speak only English Native:
96.9% (5,234)Foreign-born:
16.5% (38)
Black or African American - Speak another language Native:
3.3% (176)Foreign-born:
86.3% (200)
Asian - Speak only English Native:
57.8% (79)Foreign-born:
19.2% (226)
Asian - Speak another language Native:
40.5% (56)Foreign-born:
80.8% (948)
Other race - Speak only English Native:
46.3% (468)Foreign-born:
23.6% (358)
Other race - Speak another language Native:
58.3% (589)Foreign-born:
62.0% (943)
Two or more races - Speak only English Native:
88.9% (2,999)Foreign-born:
35.9% (562)
Two or more races - Speak another language Native:
10.0% (337)Foreign-born:
64.7% (1,012)
White alone - Speak only English Native:
98.8% (46,787)Foreign-born:
59.0% (642)
White alone - Speak another language Native:
1.2% (556)Foreign-born:
41.3% (449)
Hispanic or Latino - Speak only English Native:
41.6% (1,087)Foreign-born:
31.4% (1,436)
Hispanic or Latino - Speak another language Native:
58.4% (1,526)Foreign-born:
68.6% (3,142)
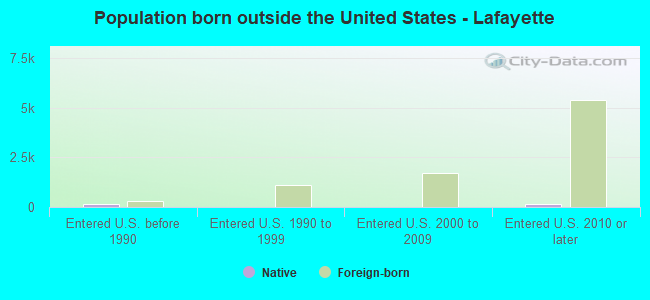
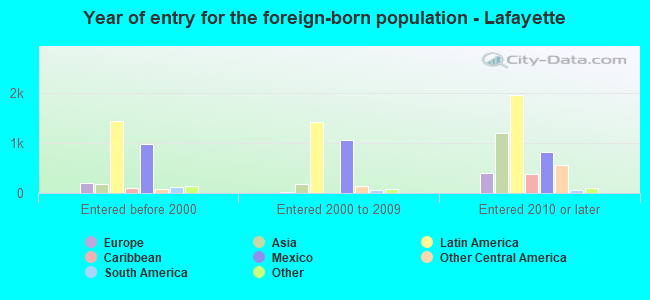
Foreign-born residents in Lafayette 6,675 residents are foreign born (4.9% Latin America , 2.4% Asia ).
This city:
9.3%Indiana:
5.6%
Marital status for residents in Lafayette Marital status - White (Caucasian) population 15 years and over
Males 36.6% Never married46.2% Now married1.3% Separated2.5% Widowed13.4% DivorcedFemales 30.6% Never married42.3% Now married0.8% Separated8.3% Widowed18.0% DivorcedWomen who gave birth in the past 12 months Now married:
44.9% (335)Unmarried:
55.1% (411)
Women who did not give birth in the past 12 months Now married:
42.6% (5,334)Unmarried:
57.4% (7,195)
Marital status - Black or African American population 15 years and over
Males 57.3% Never married24.3% Now married2.5% Separated3.0% Widowed12.9% DivorcedFemales 63.8% Never married16.2% Now married0.3% Separated3.1% Widowed16.6% DivorcedWomen who gave birth in the past 12 months Now married:
0.0% (0)Unmarried:
100.0% (289)
Women who did not give birth in the past 12 months Now married:
15.2% (320)Unmarried:
84.8% (1,785)
Marital status - American Indian / Alaska Native population 15 years and over
Males 51.0% Never married2.0% Now married5.9% Separated0.0% Widowed41.2% DivorcedFemales 0.0% Never married0.0% Now married0.0% Separated0.0% Widowed100.0% DivorcedMarital status - Asian population 15 years and over
Males 57.6% Never married36.9% Now married2.4% Separated0.0% Widowed3.1% DivorcedFemales 24.7% Never married67.0% Now married0.0% Separated7.4% Widowed0.9% DivorcedWomen who gave birth in the past 12 months Now married:
72.4% (38)Unmarried:
27.6% (14)
Women who did not give birth in the past 12 months Now married:
71.4% (251)Unmarried:
28.6% (100)
Marital status - Other race population 15 years and over
Males 43.3% Never married47.4% Now married0.0% Separated0.0% Widowed9.3% DivorcedFemales 42.9% Never married50.4% Now married0.0% Separated0.0% Widowed6.7% DivorcedWomen who gave birth in the past 12 months Now married:
36.8% (17)Unmarried:
63.2% (29)
Women who did not give birth in the past 12 months Now married:
48.4% (525)Unmarried:
51.6% (560)
Marital status - Two or more races population 15 years and over
Males 34.1% Never married60.4% Now married1.9% Separated0.0% Widowed3.7% DivorcedFemales 33.5% Never married49.2% Now married0.0% Separated9.7% Widowed7.5% DivorcedWomen who gave birth in the past 12 months Now married:
28.6% (22)Unmarried:
71.4% (55)
Women who did not give birth in the past 12 months Now married:
42.3% (507)Unmarried:
57.7% (693)
Marital status - White alone, not Hispanic / Latino population 15 years and over
Males 36.0% Never married46.4% Now married1.4% Separated2.5% Widowed13.8% DivorcedFemales 29.8% Never married42.6% Now married0.8% Separated8.6% Widowed18.1% DivorcedWomen who gave birth in the past 12 months Now married:
44.9% (335)Unmarried:
55.1% (411)
Women who did not give birth in the past 12 months Now married:
43.2% (5,113)Unmarried:
56.8% (6,713)
Marital status - Hispanic or Latino population 15 years and over
Males 37.3% Never married60.5% Now married0.0% Separated0.0% Widowed2.1% DivorcedFemales 41.2% Never married51.2% Now married0.0% Separated0.0% Widowed7.6% DivorcedWomen who gave birth in the past 12 months Now married:
21.9% (23)Unmarried:
78.1% (84)
Women who did not give birth in the past 12 months Now married:
42.5% (1,069)Unmarried:
57.5% (1,445)
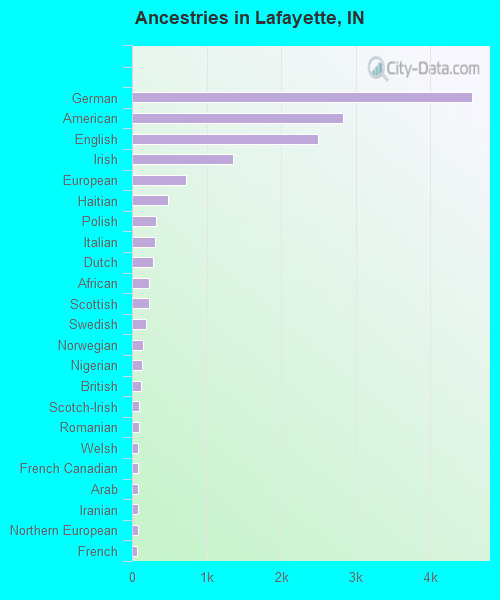
Ancestries in Lafayette
4,558 17.0% German2,826 10.5% American2,495 9.3% English1,359 5.1% Irish718 2.7% European489 1.8% Haitian327 1.2% Polish313 1.2% Italian287 1.1% Dutch232 0.9% African225 0.8% Scottish186 0.7% Swedish142 0.5% Norwegian128 0.5% Nigerian122 0.5% British99 0.4% Scotch-Irish99 0.4% Romanian85 0.3% Welsh82 0.3% French Canadian80 0.3% Arab80 0.3% Iranian80 0.3% Northern European66 0.2% French32 0.1% Ukrainian25 0.09% Hungarian24 0.09% Portuguese22 0.08% Scandinavian21 0.08% Lithuanian20 0.07% Greek19 0.07% Slovak15 0.06% Albanian15 0.06% Canadian13 0.05% Czech12 0.04% Russian11 0.04% Sudanese10 0.04% Jamaican9 0.03% Lebanese9 0.03% Slavic8 0.03% Swiss6 0.02% Pennsylvania German4 0.01% Eastern European4 0.01% Moroccan
Geographical mobility in Lafayette Same house 1 year ago 43,446 85.4% White (Caucasian)6,952 86.9% Black or African American104 73.5% American Indian / Alaska Native847 56.9% Asian3,208 90.0% Other race3,652 64.2% Two or more races41,702 84.9% White alone, not Hispanic / Latino6,481 71.2% Hispanic or LatinoMoved within same county 4,307 8.5% White / Caucasian719 9.0% Black or African American13 9.3% American Indian / Alaska Native378 25.4% Asian292 8.2% Other race732 12.9% Two or more races4,307 8.8% White alone, not Hispanic / Latino1,599 17.6% Hispanic or LatinoMoved within same state 1,642 3.2% White / Caucasian3 0.0% Black or African American21 1.4% Asian37 1.0% Other race222 3.9% Two or more races1,642 3.3% White alone, not Hispanic / Latino182 2.0% Hispanic or LatinoMoved from different state 993 2.0% White / Caucasian322 4.0% Black or African American45 3.1% Asian45 1.3% Other race119 2.1% Two or more races993 2.0% White alone, not Hispanic / Latino602 6.6% Hispanic or LatinoMoved from abroad 479 0.9% White19 13.5% American Indian / Alaska Native72 4.8% Asian401 7.0% Two or more races479 1.0% White alone, not Hispanic / Latino46 0.5% Hispanic or Latino
Children Nativity (place of birth) in Lafayette
Children under 6 years - Living with two parents Both parents native 2,144 100.0% NativeBoth parents foreign-born 546 73.6% Native196 26.4% Foreign-bornOne native, one foreign-born parent 247 100.0% NativeChildren under 6 years - Living with one parent Native parent 2,390 100.0% NativeForeign-born parent 181 100.0% NativeChildren 6 to 17 years - Living with two parents Both parents native 3,487 96.2% Native138 3.8% Foreign-bornBoth parents foreign-born 820 64.9% Native444 35.1% Foreign-bornOne native, one foreign-born parent 306 82.8% Native64 17.2% Foreign-bornChildren 6 to 17 years - Living with one parent Native parent 3,790 100.0% NativeForeign-born parent 525 49.3% Native541 50.7% Foreign-born
Grandparents responsible for own grandchildren in Lafayette
Grandparents (30 to 59 years) White / Caucasian 302 70.2% Responsible for grandchildren128 29.8% Not responsible for grandchildrenBlack or African American 8 100.0% Not responsible for grandchildrenOther race 61 96.0% Responsible for grandchildren3 4.0% Not responsible for grandchildrenWhite alone, not Hispanic / Latino 286 67.8% Responsible for grandchildren136 32.2% Not responsible for grandchildrenHispanic or Latino 89 98.2% Responsible for grandchildren2 1.8% Not responsible for grandchildrenGrandparents (60 years and over) White / Caucasian 125 37.8% Responsible for grandchildren206 62.2% Not responsible for grandchildrenBlack or African American 8 100.0% Not responsible for grandchildrenWhite alone, not Hispanic / Latino 127 56.2% Responsible for grandchildren99 43.8% Not responsible for grandchildrenHispanic or Latino 107 100.0% Not responsible for grandchildren