Races in Lafayette, Louisiana (LA) Detailed Stats
Data:
Races - White alone (%)
Races - White alone (% change since 2000)
Races - Black alone (%)
Races - Black alone (% change since 2000)
Races - American Indian alone (%)
Races - American Indian alone (% change since 2000)
Races - Asian alone (%)
Races - Asian alone (% change since 2000)
Races - Hispanic (%)
Races - Hispanic (% change since 2000)
Races - Native Hawaiian and Other Pacific Islander alone (%)
Races - Native Hawaiian and Other Pacific Islander alone (% change since 2000)
Races - Two or more races(%)
Races - Two or more races(% change since 2000)
Races - Other race alone (%)
Races - Other race alone (% change since 2000)
Racial diversity
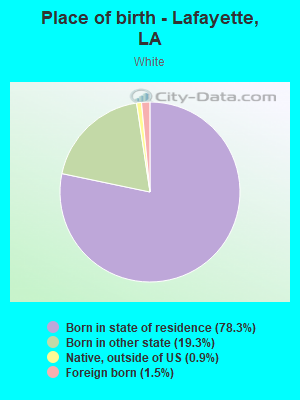
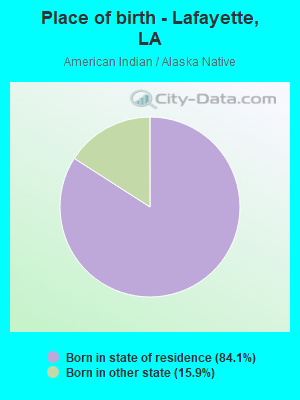
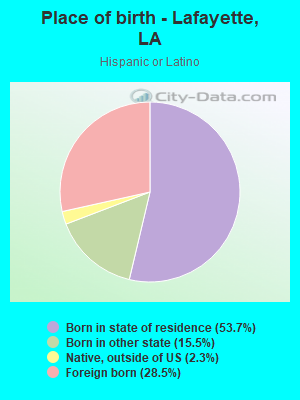
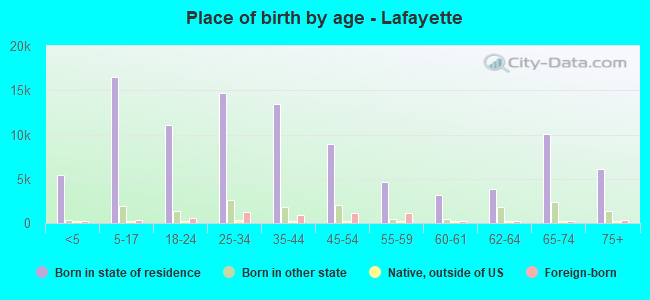
Place of birth - Born in state of residence (%)
Place of birth - Born in state of residence (%) - White
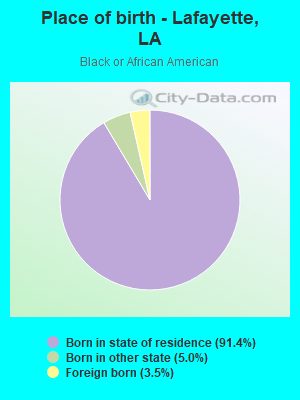
Place of birth - Born in state of residence (%) - Black or African American
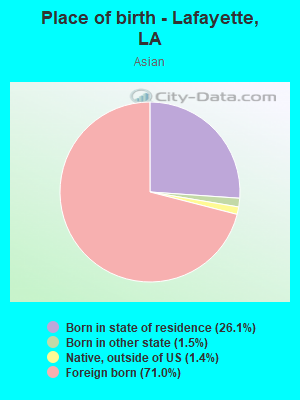
Place of birth - Born in state of residence (%) - Asian
Place of birth - Born in state of residence (%) - Hispanic or Latino
Place of birth - Born in state of residence (%) - American Indian and Alaska Native
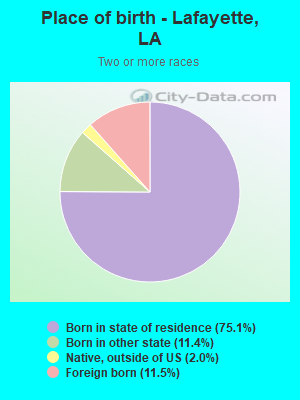
Place of birth - Born in state of residence (%) - Multirace
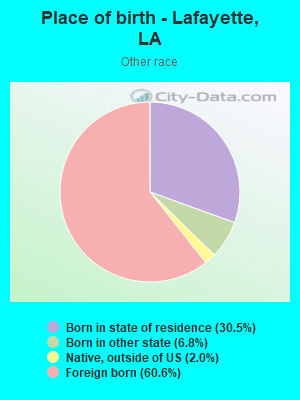
Place of birth - Born in state of residence (%) - Other Race
Place of birth - Born in other state (%)
Place of birth - Born in other state (%) - White
Place of birth - Born in other state (%) - Black or African American
Place of birth - Born in other state (%) - Asian
Place of birth - Born in other state (%) - Hispanic or Latino
Place of birth - Born in other state (%) - American Indian and Alaska Native
Place of birth - Born in other state (%) - Multirace
Place of birth - Born in other state (%) - Other Race
Place of birth - Native, outside of US (%)
Place of birth - Native, outside of US (%) - White
Place of birth - Native, outside of US (%) - Black or African American
Place of birth - Native, outside of US (%) - Asian
Place of birth - Native, outside of US (%) - Hispanic or Latino
Place of birth - Native, outside of US (%) - American Indian and Alaska Native
Place of birth - Native, outside of US (%) - Multirace
Place of birth - Native, outside of US (%) - Other Race
Place of birth - Foreign born (%)
Place of birth - Foreign born (%) - White
Place of birth - Foreign born (%) - Black or African American
Place of birth - Foreign born (%) - Asian
Place of birth - Foreign born (%) - Hispanic or Latino
Place of birth - Foreign born (%) - American Indian and Alaska Native
Place of birth - Foreign born (%) - Multirace
Place of birth - Foreign born (%) - Other Race
Residents speaking English at home (%)
Residents speaking English at home - Born in the United States (%)
Residents speaking English at home - Native, born elsewhere (%)
Residents speaking English at home - Foreign born (%)
Residents speaking Spanish at home (%)
Residents speaking Spanish at home - Born in the United States (%)
Residents speaking Spanish at home - Native, born elsewhere (%)
Residents speaking Spanish at home - Foreign born (%)
Residents speaking other language at home (%)
Residents speaking other language at home - Born in the United States (%)
Residents speaking other language at home - Native, born elsewhere (%)
Residents speaking other language at home - Foreign born (%)
Marital status - Never married (%)
Marital status - Now married (%)
Marital status - Separated (%)
Marital status - Widowed (%)
Marital status - Divorced (%)
Ancestries Reported - Arab (%)
Ancestries Reported - Czech (%)
Ancestries Reported - Danish (%)
Ancestries Reported - Dutch (%)
Ancestries Reported - English (%)
Ancestries Reported - French (%)
Ancestries Reported - French Canadian (%)
Ancestries Reported - German (%)
Ancestries Reported - Greek (%)
Ancestries Reported - Hungarian (%)
Ancestries Reported - Irish (%)
Ancestries Reported - Italian (%)
Ancestries Reported - Lithuanian (%)
Ancestries Reported - Norwegian (%)
Ancestries Reported - Polish (%)
Ancestries Reported - Portuguese (%)
Ancestries Reported - Russian (%)
Ancestries Reported - Scotch-Irish (%)
Ancestries Reported - Scottish (%)
Ancestries Reported - Slovak (%)
Ancestries Reported - Subsaharan African (%)
Ancestries Reported - Swedish (%)
Ancestries Reported - Swiss (%)
Ancestries Reported - Ukrainian (%)
Ancestries Reported - United States (%)
Ancestries Reported - Welsh (%)
Ancestries Reported - West Indian (%)
Ancestries Reported - Other (%)
Geographical mobility - Same house 1 year ago (%)
Geographical mobility - Same house 1 year ago (%) - White
Geographical mobility - Same house 1 year ago (%) - Black or African American
Geographical mobility - Same house 1 year ago (%) - Asian
Geographical mobility - Same house 1 year ago (%) - Hispanic or Latino
Geographical mobility - Same house 1 year ago (%) - American Indian and Alaska Native
Geographical mobility - Same house 1 year ago (%) - Multirace
Geographical mobility - Same house 1 year ago (%) - Other Race
Geographical mobility - Moved within same county (%)
Geographical mobility - Moved within same county (%) - White
Geographical mobility - Moved within same county (%) - Black or African American
Geographical mobility - Moved within same county (%) - Asian
Geographical mobility - Moved within same county (%) - Hispanic or Latino
Geographical mobility - Moved within same county (%) - American Indian and Alaska Native
Geographical mobility - Moved within same county (%) - Multirace
Geographical mobility - Moved within same county (%) - Other Race
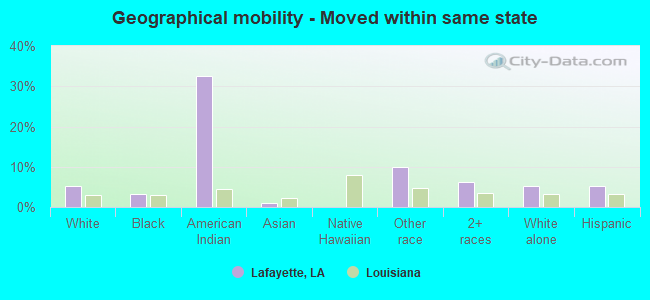
Geographical mobility - Moved from different county within same state (%)
Geographical mobility - Moved from different county within same state (%) - White
Geographical mobility - Moved from different county within same state (%) - Black or African American
Geographical mobility - Moved from different county within same state (%) - Asian
Geographical mobility - Moved from different county within same state (%) - Hispanic or Latino
Geographical mobility - Moved from different county within same state (%) - American Indian and Alaska Native
Geographical mobility - Moved from different county within same state (%) - Multirace
Geographical mobility - Moved from different county within same state (%) - Other Race
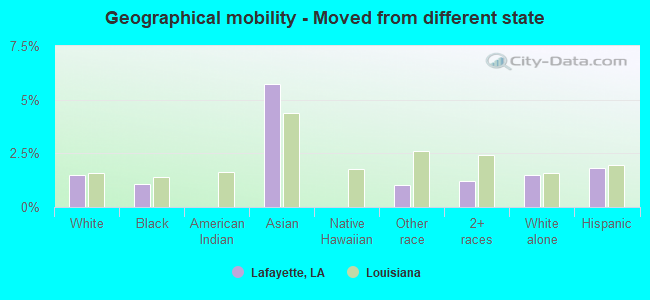
Geographical mobility - Moved from different state (%)
Geographical mobility - Moved from different state (%) - White
Geographical mobility - Moved from different state (%) - Black or African American
Geographical mobility - Moved from different state (%) - Asian
Geographical mobility - Moved from different state (%) - Hispanic or Latino
Geographical mobility - Moved from different state (%) - American Indian and Alaska Native
Geographical mobility - Moved from different state (%) - Multirace
Geographical mobility - Moved from different state (%) - Other Race
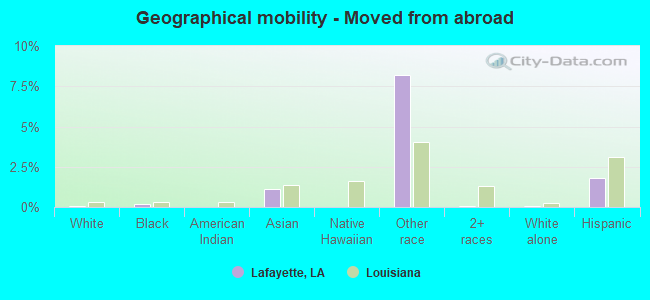
Geographical mobility - Moved from abroad (%)
Geographical mobility - Moved from abroad (%) - White
Geographical mobility - Moved from abroad (%) - Black or African American
Geographical mobility - Moved from abroad (%) - Asian
Geographical mobility - Moved from abroad (%) - Hispanic or Latino
Geographical mobility - Moved from abroad (%) - American Indian and Alaska Native
Geographical mobility - Moved from abroad (%) - Multirace
Geographical mobility - Moved from abroad (%) - Other Race
Place of birth for the foreign-born population - Ireland (%)
Place of birth for the foreign-born population - Denmark (%)
Place of birth for the foreign-born population - Norway (%)
Place of birth for the foreign-born population - Sweden (%)
Place of birth for the foreign-born population - United Kingdom (%)
Place of birth for the foreign-born population - England (%)
Place of birth for the foreign-born population - Scotland (%)
Place of birth for the foreign-born population - Other Northern Europe (%)
Place of birth for the foreign-born population - Austria (%)
Place of birth for the foreign-born population - Belgium (%)
Place of birth for the foreign-born population - France (%)
Place of birth for the foreign-born population - Germany (%)
Place of birth for the foreign-born population - Netherlands (%)
Place of birth for the foreign-born population - Switzerland (%)
Place of birth for the foreign-born population - Other Western Europe (%)
Place of birth for the foreign-born population - Greece (%)
Place of birth for the foreign-born population - Italy (%)
Place of birth for the foreign-born population - Portugal (%)
Place of birth for the foreign-born population - Spain (%)
Place of birth for the foreign-born population - Other Southern Europe (%)
Place of birth for the foreign-born population - Albania (%)
Place of birth for the foreign-born population - Belarus (%)
Place of birth for the foreign-born population - Bosnia and Herzegovina (%)
Place of birth for the foreign-born population - Bulgaria (%)
Place of birth for the foreign-born population - Croatia (%)
Place of birth for the foreign-born population - Czechoslovakia (%)
Place of birth for the foreign-born population - Hungary (%)
Place of birth for the foreign-born population - Latvia (%)
Place of birth for the foreign-born population - Lithuania (%)
Place of birth for the foreign-born population - North Macedonia (Macedonia) (%)
Place of birth for the foreign-born population - Moldova (%)
Place of birth for the foreign-born population - Poland (%)
Place of birth for the foreign-born population - Romania (%)
Place of birth for the foreign-born population - Russia (%)
Place of birth for the foreign-born population - Serbia (%)
Place of birth for the foreign-born population - Ukraine (%)
Place of birth for the foreign-born population - Other Eastern Europe (%)
Place of birth for the foreign-born population - China (%)
Place of birth for the foreign-born population - Hong Kong (%)
Place of birth for the foreign-born population - Taiwan (%)
Place of birth for the foreign-born population - Japan (%)
Place of birth for the foreign-born population - Korea (%)
Place of birth for the foreign-born population - Other Eastern Asia (%)
Place of birth for the foreign-born population - Afghanistan (%)
Place of birth for the foreign-born population - Bangladesh (%)
Place of birth for the foreign-born population - India (%)
Place of birth for the foreign-born population - Iran (%)
Place of birth for the foreign-born population - Kazakhstan (%)
Place of birth for the foreign-born population - Nepal (%)
Place of birth for the foreign-born population - Pakistan (%)
Place of birth for the foreign-born population - Sri Lanka (%)
Place of birth for the foreign-born population - Uzbekistan (%)
Place of birth for the foreign-born population - Other South Central Asia (%)
Place of birth for the foreign-born population - Burma (%)
Place of birth for the foreign-born population - Cambodia (%)
Place of birth for the foreign-born population - Indonesia (%)
Place of birth for the foreign-born population - Laos (%)
Place of birth for the foreign-born population - Malaysia (%)
Place of birth for the foreign-born population - Philippines (%)
Place of birth for the foreign-born population - Singapore (%)
Place of birth for the foreign-born population - Thailand (%)
Place of birth for the foreign-born population - Vietnam (%)
Place of birth for the foreign-born population - Other South Eastern Asia (%)
Place of birth for the foreign-born population - Armenia (%)
Place of birth for the foreign-born population - Iraq (%)
Place of birth for the foreign-born population - Israel (%)
Place of birth for the foreign-born population - Jordan (%)
Place of birth for the foreign-born population - Kuwait (%)
Place of birth for the foreign-born population - Lebanon (%)
Place of birth for the foreign-born population - Saudi Arabia (%)
Place of birth for the foreign-born population - Syria (%)
Place of birth for the foreign-born population - Turkey (%)
Place of birth for the foreign-born population - Yemen (%)
Place of birth for the foreign-born population - Other Western Asia (%)
Place of birth for the foreign-born population - Eritrea (%)
Place of birth for the foreign-born population - Ethiopia (%)
Place of birth for the foreign-born population - Kenya (%)
Place of birth for the foreign-born population - Somalia (%)
Place of birth for the foreign-born population - Uganda (%)
Place of birth for the foreign-born population - Zimbabwe (%)
Place of birth for the foreign-born population - Other Eastern Africa (%)
Place of birth for the foreign-born population - Cameroon (%)
Place of birth for the foreign-born population - Congo (%)
Place of birth for the foreign-born population - Democratic Republic of Congo (Zaire) (%)
Place of birth for the foreign-born population - Other Middle Africa (%)
Place of birth for the foreign-born population - Egypt (%)
Place of birth for the foreign-born population - Morocco (%)
Place of birth for the foreign-born population - Sudan (%)
Place of birth for the foreign-born population - Other Northern Africa (%)
Place of birth for the foreign-born population - South Africa (%)
Place of birth for the foreign-born population - Other Southern Africa (%)
Place of birth for the foreign-born population - Cabo Verde (%)
Place of birth for the foreign-born population - Ghana (%)
Place of birth for the foreign-born population - Liberia (%)
Place of birth for the foreign-born population - Nigeria (%)
Place of birth for the foreign-born population - Senegal (%)
Place of birth for the foreign-born population - Sierra Leone (%)
Place of birth for the foreign-born population - Other Western Africa (%)
Place of birth for the foreign-born population - Australia (%)
Place of birth for the foreign-born population - New Zealand (%)
Place of birth for the foreign-born population - Fiji (%)
Place of birth for the foreign-born population - Micronesia (%)
Place of birth for the foreign-born population - Bahamas (%)
Place of birth for the foreign-born population - Barbados (%)
Place of birth for the foreign-born population - Cuba (%)
Place of birth for the foreign-born population - Dominica (%)
Place of birth for the foreign-born population - Dominican Republic (%)
Place of birth for the foreign-born population - Grenada (%)
Place of birth for the foreign-born population - Haiti (%)
Place of birth for the foreign-born population - Jamaica (%)
Place of birth for the foreign-born population - St. Vincent and the Grenadines (%)
Place of birth for the foreign-born population - Trinidad and Tobago (%)
Place of birth for the foreign-born population - West Indies (%)
Place of birth for the foreign-born population - Other Caribbean (%)
Place of birth for the foreign-born population - Belize (%)
Place of birth for the foreign-born population - Costa Rica (%)
Place of birth for the foreign-born population - El Salvador (%)
Place of birth for the foreign-born population - Guatemala (%)
Place of birth for the foreign-born population - Honduras (%)
Place of birth for the foreign-born population - Mexico (%)
Place of birth for the foreign-born population - Nicaragua (%)
Place of birth for the foreign-born population - Panama (%)
Place of birth for the foreign-born population - Other Central America (%)
Place of birth for the foreign-born population - Argentina (%)
Place of birth for the foreign-born population - Bolivia (%)
Place of birth for the foreign-born population - Brazil (%)
Place of birth for the foreign-born population - Chile (%)
Place of birth for the foreign-born population - Colombia (%)
Place of birth for the foreign-born population - Ecuador (%)
Place of birth for the foreign-born population - Guyana (%)
Place of birth for the foreign-born population - Peru (%)
Place of birth for the foreign-born population - Uruguay (%)
Place of birth for the foreign-born population - Venezuela (%)
Place of birth for the foreign-born population - Other South America (%)
Place of birth for the foreign-born population - Canada (%)
Place of birth for the foreign-born population - Other Northern America (%)
Place of birth for the foreign-born population - Other (%)
Latest news about races in Lafayette, LA collected exclusively by city-data.com from local newspapers, TV, and radio stations
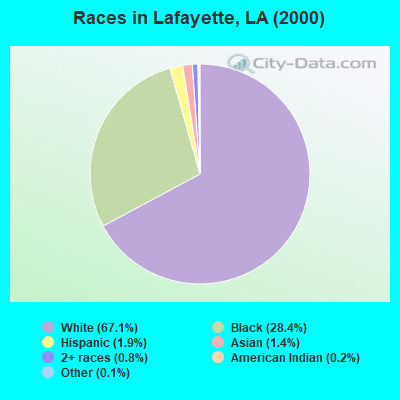
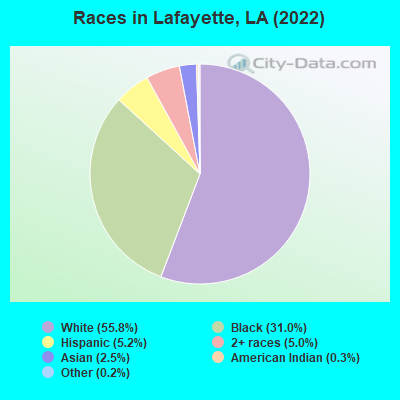
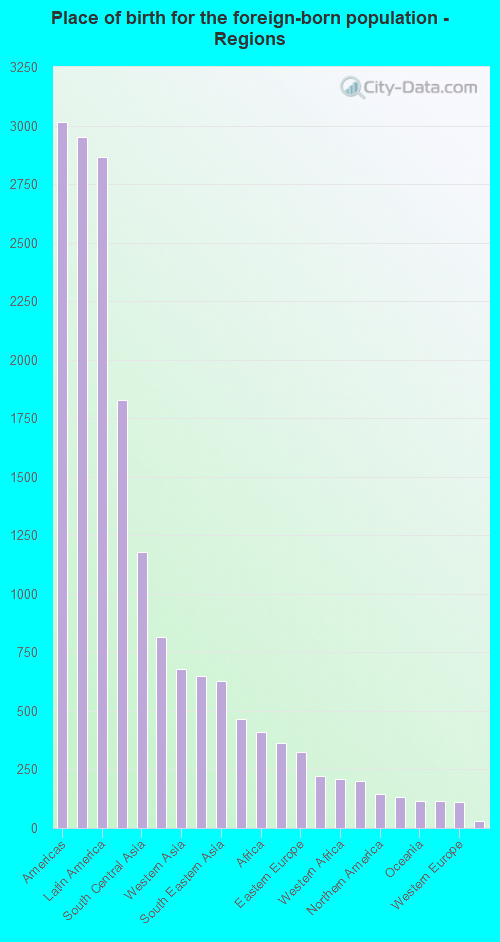
According to 2022 data, the most numerous races in Lafayette, LA are White alone (67,773 residents), Black alone (37,672 residents), and Hispanic (6,271 residents). 91.4% of Lafayette residents speak English at home. 5.8% of Lafayette, LA residents are foreign-born (2.4% born in Asia, 2.3% born in Latin America), which is 30.5% greater than the foreign-born rate of 4.0% across the entire state of Louisiana.
Race distribution in Lafayette
2000 2022
2,794,391 62.5% White alone 1,443,390 32.3% Black alone 107,738 2.4% Hispanic 54,256 1.2% Asian alone 39,260 0.9% Two or more races 24,129 0.5% American Indian alone 4,736 0.1% Other race alone 1,076 0.02% Native Hawaiian and Other
2,603,221 56.7% White alone 1,420,055 30.9% Black alone 262,213 5.7% Hispanic 183,270 4.0% Two or more races 81,169 1.8% Asian alone 19,991 0.4% American Indian alone 18,043 0.4% Other race alone 2,279 0.05% Native Hawaiian and Other
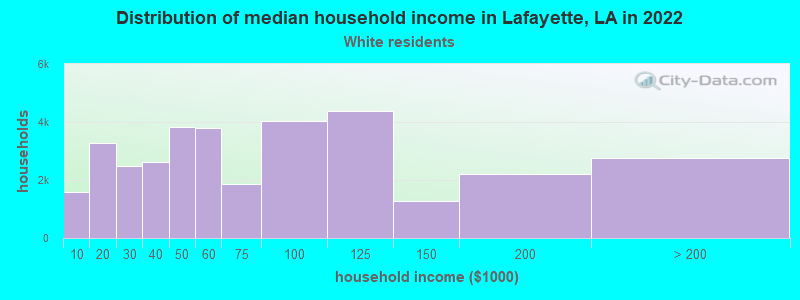
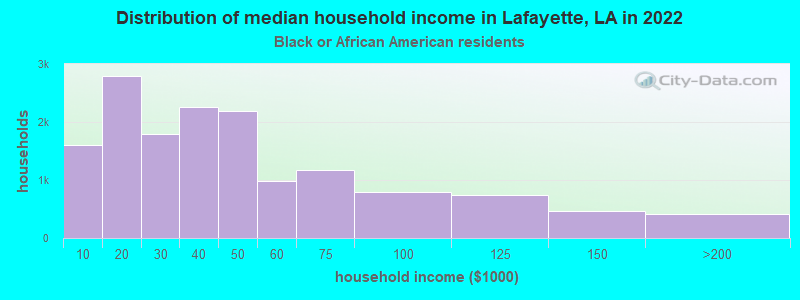
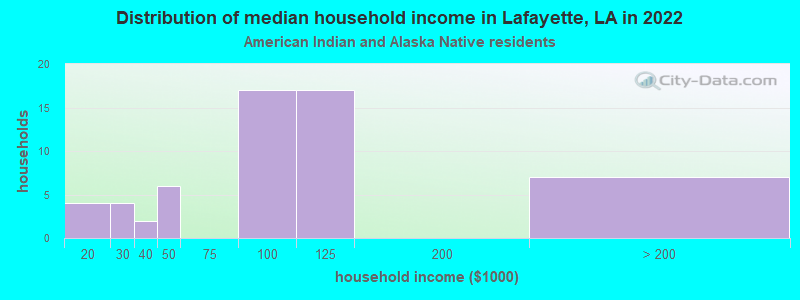
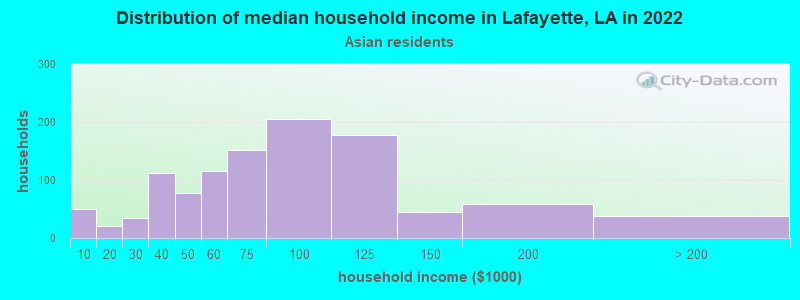
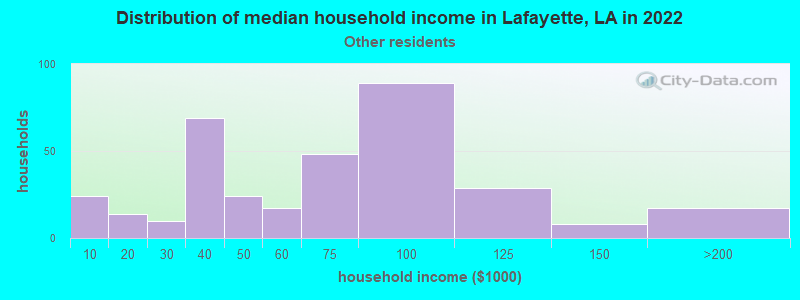
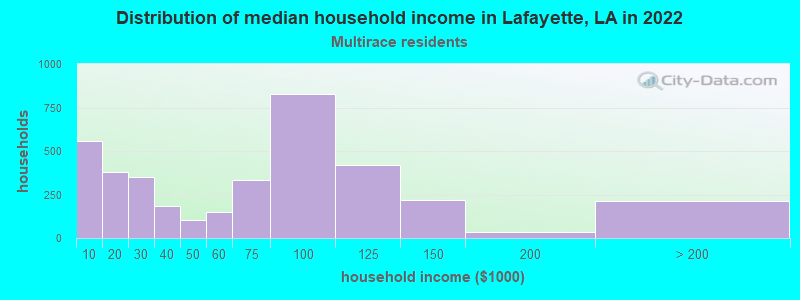
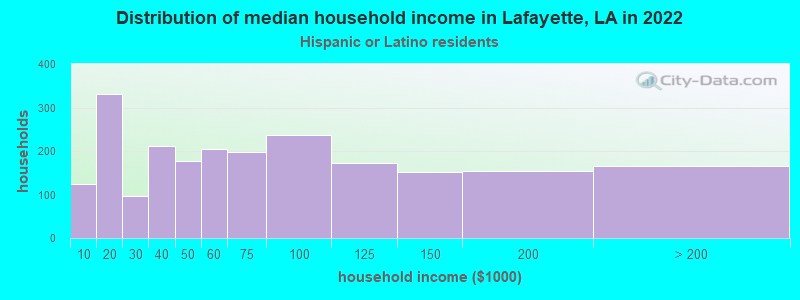
Income and house value in Lafayette Median household income in 2022 $57,985 White non-Hispanic householders$32,234 Black householders$103,449 American Indian and Alaska Native householders$109,160 Asian householders$66,721 Some other race householders$48,323 Two or more races householders$58,537 Hispanic or Latino race householdersMedian 2022 house value $273,389 White Non-Hispanic householders$133,057 Black or African American householders$198,060 American Indian or Alaska Native householders $259,309 Asian householders$248,045 Some other race householders$224,578 Two or more races householders$286,061 Hispanic or Latino householders
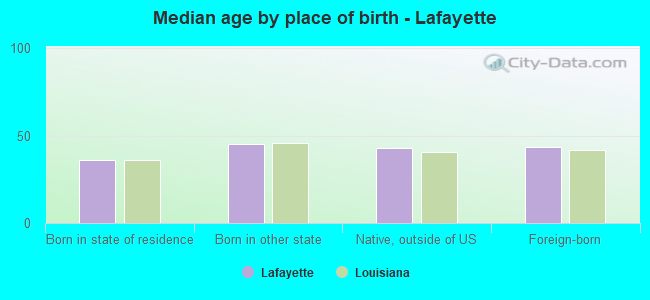
Median age by race in Lafayette
42.5 Median age for White residents40.7 44.8 33.2 Median age for Black or African American residents30.8 35.7 62.3 Median age for American Indian / Alaska Native residents62.1 -666,666,666.0 39.9 Median age for Asian residents45.6 39.2 -666,666,666.0 Median age for Native Hawaiian / Pacific Islander residents-666,666,666.0 -666,666,666.0 16.1 Median age for Other race residents27.4 21.7 25.8 Median age for Two or more races residents32.0 23.4 42.7 Median age for White alone residents40.8 45.1 30.4 Median age for Hispanic or Latino residents31.1 26.5
Owner/renter occupied households by race in Lafayette
House owners and renters - White residents 20,889 61.3% Owner occupied13,201 38.7% Renter occupiedHouse owners and renters - Black or African American residents 5,545 36.4% Owner occupied9,687 63.6% Renter occupiedHouse owners and renters - American Indian / Alaska Native residents 53 66.4% Owner occupied27 33.6% Renter occupiedHouse owners and renters - Asian residents 690 69.0% Owner occupied310 31.0% Renter occupiedHouse owners and renters - Native Hawaiian / Pacific Islander residents 105 100.0% Renter occupiedHouse owners and renters - Other race residents 88 28.4% Owner occupied222 71.6% Renter occupiedHouse owners and renters - Two or more races residents 1,411 39.6% Owner occupied2,153 60.4% Renter occupiedHouse owners and renters - White alone residents 20,750 61.8% Owner occupied12,816 38.2% Renter occupiedHouse owners and renters - Hispanic or Latino residents 934 43.0% Owner occupied1,238 57.0% Renter occupied
Language usage in Lafayette
English speakers - Total 91.4% of residents of Lafayette speak English at home.
2.7% of residents speak Spanish at home 1,892 59.6% Speak English very well1,284 40.4% Speak English less than very well5.8% of residents speak other language at home 4,499 66.7% Speak English very well2,248 33.3% Speak English less than very well
English speakers - Born in the United States 95.4% of residents of Lafayette speak English at home.
2.8% of residents speak Spanish at home 298 66.5% Speak English very well150 33.5% Speak English less than very well1.8% of residents speak other language at home 184 61.7% Speak English very well114 38.3% Speak English less than very well
English speakers - Native, born elsewhere 89.9% of residents of Lafayette speak English at home.
5.2% of residents speak Spanish at home 44 100.0% Speak English very well4.9% of residents speak other language at home 41 100.0% Speak English less than very well
English speakers - Foreign-born 21.9% of residents of Lafayette speak English at home.
28.1% of residents speak Spanish at home 735 43.1% Speak English very well969 56.9% Speak English less than very well50.0% of residents speak other language at home 1,355 44.7% Speak English very well1,679 55.3% Speak English less than very well
White (Caucasian) - Speak only English Native:
94.1% (61,895)Foreign-born:
43.8% (454)
White (Caucasian) - Speak another language Native:
5.9% (3,881)Foreign-born:
56.2% (583)
Black or African American - Speak only English Native:
97.9% (30,836)Foreign-born:
48.2% (244)
Black or African American - Speak another language Native:
2.1% (673)Foreign-born:
51.5% (261)
Asian - Speak only English Native:
80.2% (669)Foreign-born:
8.9% (192)
Asian - Speak another language Native:
19.8% (165)Foreign-born:
91.1% (1,963)
Other race - Speak only English Native:
58.8% (186)Foreign-born:
0.6% (4)
Other race - Speak another language Native:
39.7% (126)Foreign-born:
99.7% (661)
Two or more races - Speak only English Native:
93.2% (7,762)Foreign-born:
7.0% (82)
Two or more races - Speak another language Native:
6.8% (568)Foreign-born:
93.0% (1,086)
White alone - Speak only English Native:
94.7% (61,465)Foreign-born:
57.7% (454)
White alone - Speak another language Native:
5.3% (3,451)Foreign-born:
42.3% (333)
Hispanic or Latino - Speak only English Native:
76.1% (2,981)Foreign-born:
4.6% (82)
Hispanic or Latino - Speak another language Native:
23.9% (936)Foreign-born:
95.4% (1,704)
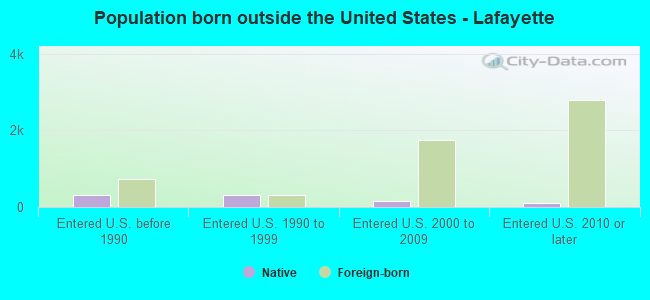
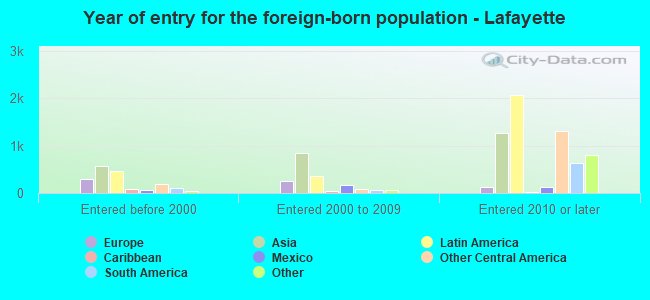
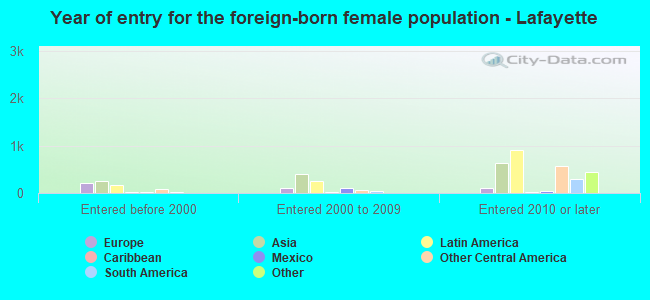
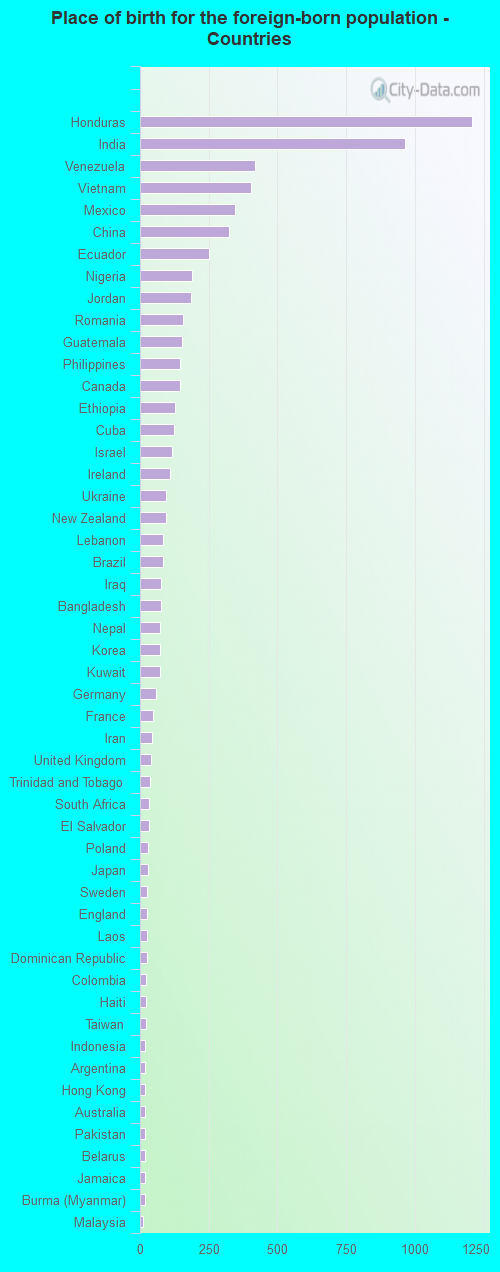
Foreign-born residents in Lafayette 7,139 residents are foreign born (2.4% Asia , 2.3% Latin America ).
This city:
5.8%Louisiana:
4.2%
Marital status for residents in Lafayette Marital status - White (Caucasian) population 15 years and over
Males 41.1% Never married47.1% Now married2.1% Separated2.6% Widowed7.1% DivorcedFemales 30.7% Never married45.2% Now married2.7% Separated8.3% Widowed13.1% DivorcedWomen who gave birth in the past 12 months Now married:
78.4% (775)Unmarried:
21.6% (214)
Women who did not give birth in the past 12 months Now married:
34.3% (5,188)Unmarried:
65.7% (9,930)
Marital status - Black or African American population 15 years and over
Males 50.0% Never married38.0% Now married3.0% Separated3.8% Widowed5.3% DivorcedFemales 49.0% Never married35.3% Now married1.1% Separated6.7% Widowed7.9% DivorcedWomen who gave birth in the past 12 months Now married:
27.7% (107)Unmarried:
72.3% (278)
Women who did not give birth in the past 12 months Now married:
23.6% (2,161)Unmarried:
76.4% (6,992)
Marital status - American Indian / Alaska Native population 15 years and over
Males 19.4% Never married80.6% Now married0.0% Separated0.0% Widowed0.0% DivorcedFemales 76.6% Never married21.9% Now married0.0% Separated1.6% Widowed0.0% DivorcedWomen who did not give birth in the past 12 months Now married:
14.0% (7)Unmarried:
86.0% (41)
Marital status - Asian population 15 years and over
Males 33.4% Never married64.7% Now married0.0% Separated0.0% Widowed1.9% DivorcedFemales 32.1% Never married63.2% Now married0.0% Separated4.0% Widowed0.7% DivorcedWomen who gave birth in the past 12 months Now married:
100.0% (21)Unmarried:
0.0% (0)
Women who did not give birth in the past 12 months Now married:
58.8% (536)Unmarried:
41.2% (376)
Marital status - Other race population 15 years and over
Males 46.3% Never married52.0% Now married1.7% Separated0.0% Widowed0.0% DivorcedFemales 45.9% Never married53.0% Now married1.1% Separated0.0% Widowed0.0% DivorcedWomen who gave birth in the past 12 months Now married:
100.0% (34)Unmarried:
0.0% (0)
Women who did not give birth in the past 12 months Now married:
49.4% (169)Unmarried:
50.6% (174)
Marital status - Two or more races population 15 years and over
Males 66.2% Never married27.0% Now married0.0% Separated0.0% Widowed6.8% DivorcedFemales 51.8% Never married21.9% Now married9.2% Separated4.6% Widowed12.5% DivorcedWomen who gave birth in the past 12 months Now married:
65.6% (72)Unmarried:
34.4% (38)
Women who did not give birth in the past 12 months Now married:
46.0% (1,234)Unmarried:
54.0% (1,449)
Marital status - White alone, not Hispanic / Latino population 15 years and over
Males 41.6% Never married46.3% Now married2.2% Separated2.6% Widowed7.2% DivorcedFemales 30.9% Never married45.0% Now married2.7% Separated8.3% Widowed13.0% DivorcedWomen who gave birth in the past 12 months Now married:
78.4% (775)Unmarried:
21.6% (214)
Women who did not give birth in the past 12 months Now married:
33.6% (5,023)Unmarried:
66.4% (9,930)
Marital status - Hispanic or Latino population 15 years and over
Males 38.5% Never married58.0% Now married0.4% Separated1.1% Widowed2.0% DivorcedFemales 33.2% Never married50.1% Now married0.2% Separated7.3% Widowed9.3% DivorcedWomen who gave birth in the past 12 months Now married:
32.2% (67)Unmarried:
67.8% (141)
Women who did not give birth in the past 12 months Now married:
59.2% (640)Unmarried:
40.8% (441)
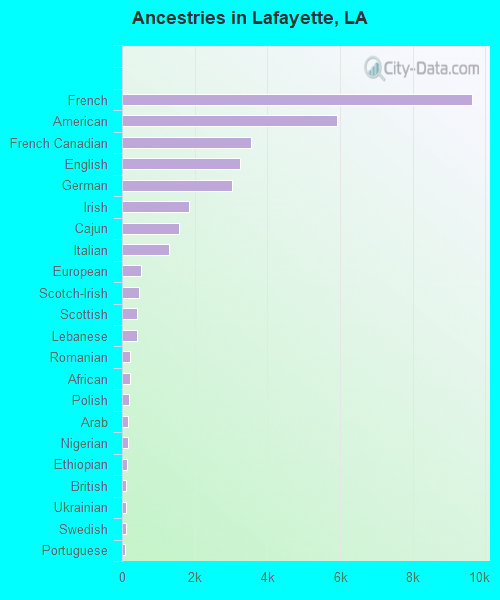
Ancestries in Lafayette
9,616 13.4% French5,921 8.2% American3,559 5.0% French Canadian3,255 4.5% English3,028 4.2% German1,849 2.6% Irish1,560 2.2% Cajun1,288 1.8% Italian533 0.7% European475 0.7% Scotch-Irish404 0.6% Scottish399 0.6% Lebanese226 0.3% Romanian209 0.3% African182 0.3% Polish169 0.2% Arab167 0.2% Nigerian135 0.2% Ethiopian117 0.2% British105 0.1% Ukrainian101 0.1% Swedish93 0.1% Portuguese78 0.1% Canadian77 0.1% Dutch65 0.09% Scandinavian49 0.07% Eastern European45 0.06% Haitian43 0.06% Iraqi41 0.06% Swiss38 0.05% Norwegian38 0.05% Iranian38 0.05% Brazilian37 0.05% Palestinian35 0.05% Jamaican30 0.04% Russian27 0.04% Northern European25 0.03% Trinidadian and Tobagonian22 0.03% Jordanian22 0.03% Maltese22 0.03% Greek19 0.03% Danish17 0.02% Slovak16 0.02% South African15 0.02% Welsh15 0.02% Australian14 0.02% Belgian8 0.01% Syrian7 0.01% Bulgarian5 0.01% Czechoslovakian5 0.01% West Indian
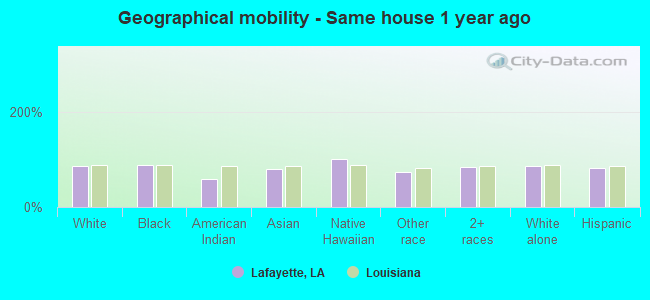
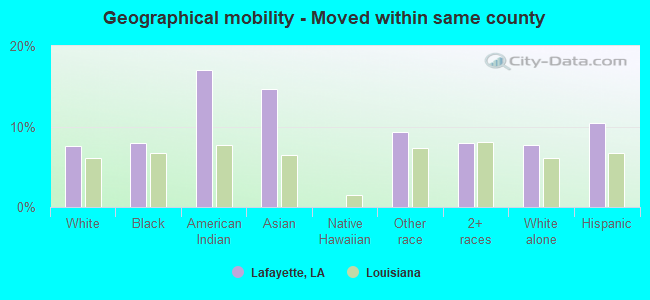
Geographical mobility in Lafayette Same house 1 year ago 58,573 85.8% White (Caucasian)29,784 87.1% Black or African American105 59.5% American Indian / Alaska Native2,325 79.4% Asian101 100.0% Native Hawaiian / Pacific Islander886 73.7% Other race10,496 83.6% Two or more races57,317 85.6% White alone, not Hispanic / Latino5,411 81.2% Hispanic or LatinoMoved within same county 5,152 7.5% White / Caucasian2,730 8.0% Black or African American30 17.0% American Indian / Alaska Native429 14.6% Asian111 9.3% Other race993 7.9% Two or more races5,152 7.7% White alone, not Hispanic / Latino696 10.4% Hispanic or LatinoMoved within same state 3,496 5.1% White / Caucasian1,145 3.3% Black or African American57 32.6% American Indian / Alaska Native27 0.9% Asian120 10.0% Other race772 6.2% Two or more races3,496 5.2% White alone, not Hispanic / Latino353 5.3% Hispanic or LatinoMoved from different state 1,017 1.5% White / Caucasian368 1.1% Black or African American168 5.7% Asian12 1.0% Other race153 1.2% Two or more races984 1.5% White alone, not Hispanic / Latino120 1.8% Hispanic or LatinoMoved from abroad 43 0.1% White56 0.2% Black or African American33 1.1% Asian98 8.2% Other race7 0.1% Two or more races43 0.1% White alone, not Hispanic / Latino119 1.8% Hispanic or Latino
Children Nativity (place of birth) in Lafayette
Children under 6 years - Living with two parents Both parents native 4,323 100.0% NativeBoth parents foreign-born 504 87.8% Native70 12.2% Foreign-bornOne native, one foreign-born parent 208 100.0% NativeChildren under 6 years - Living with one parent Native parent 3,110 100.0% NativeForeign-born parent 32 100.0% NativeChildren 6 to 17 years - Living with two parents Both parents native 8,157 98.5% Native120 1.5% Foreign-bornBoth parents foreign-born 271 55.7% Native215 44.3% Foreign-bornOne native, one foreign-born parent 1,063 99.1% Native10 0.9% Foreign-bornChildren 6 to 17 years - Living with one parent Native parent 6,312 100.0% NativeForeign-born parent 352 64.9% Native190 35.1% Foreign-born
Grandparents responsible for own grandchildren in Lafayette
Grandparents (30 to 59 years) White / Caucasian 158 58.3% Responsible for grandchildren113 41.7% Not responsible for grandchildrenBlack or African American 91 45.2% Responsible for grandchildren111 54.8% Not responsible for grandchildrenAmerican Indian / Alaska Native 7 100.0% Responsible for grandchildrenTwo or more races 43 100.0% Not responsible for grandchildrenWhite alone, not Hispanic / Latino 158 58.3% Responsible for grandchildren113 41.7% Not responsible for grandchildrenHispanic or Latino 7 100.0% Not responsible for grandchildrenGrandparents (60 years and over) White / Caucasian 53 17.4% Responsible for grandchildren252 82.6% Not responsible for grandchildrenBlack or African American 139 38.3% Responsible for grandchildren224 61.7% Not responsible for grandchildrenWhite alone, not Hispanic / Latino 55 18.5% Responsible for grandchildren243 81.5% Not responsible for grandchildrenHispanic or Latino 40 100.0% Not responsible for grandchildren