Races in Lake City, Florida (FL) Detailed Stats
Data:
Races - White alone (%)
Races - White alone (% change since 2000)
Races - Black alone (%)
Races - Black alone (% change since 2000)
Races - American Indian alone (%)
Races - American Indian alone (% change since 2000)
Races - Asian alone (%)
Races - Asian alone (% change since 2000)
Races - Hispanic (%)
Races - Hispanic (% change since 2000)
Races - Native Hawaiian and Other Pacific Islander alone (%)
Races - Native Hawaiian and Other Pacific Islander alone (% change since 2000)
Races - Two or more races(%)
Races - Two or more races(% change since 2000)
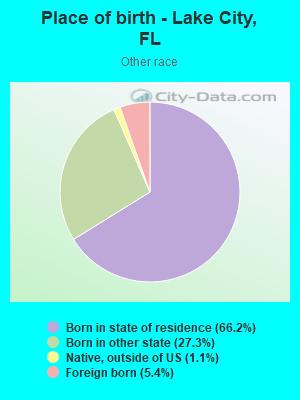
Races - Other race alone (%)
Races - Other race alone (% change since 2000)
Racial diversity
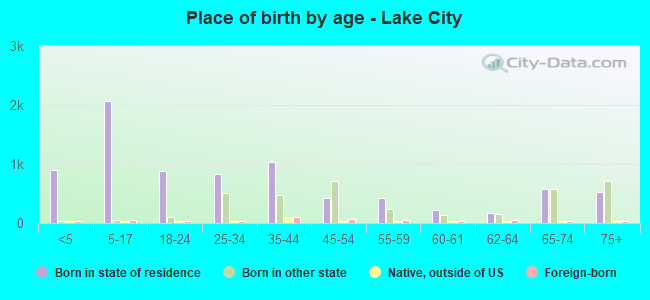
Place of birth - Born in state of residence (%)
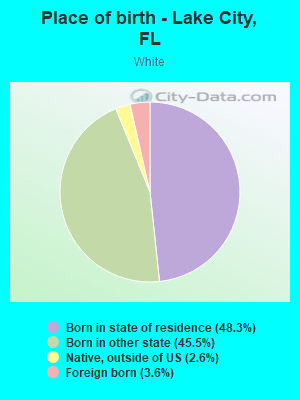
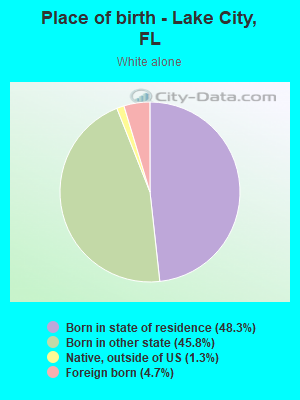
Place of birth - Born in state of residence (%) - White
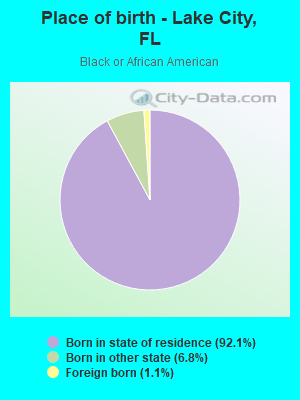
Place of birth - Born in state of residence (%) - Black or African American
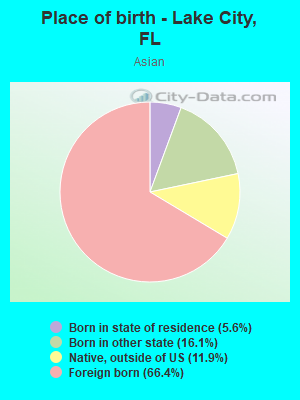
Place of birth - Born in state of residence (%) - Asian
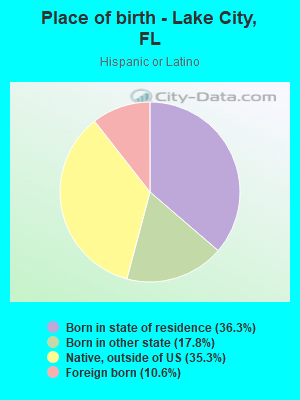
Place of birth - Born in state of residence (%) - Hispanic or Latino
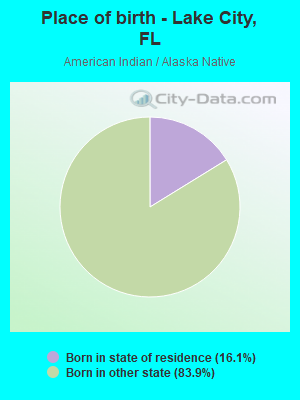
Place of birth - Born in state of residence (%) - American Indian and Alaska Native
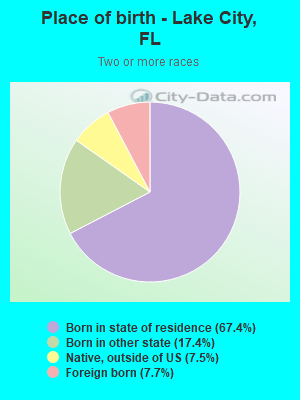
Place of birth - Born in state of residence (%) - Multirace
Place of birth - Born in state of residence (%) - Other Race
Place of birth - Born in other state (%)
Place of birth - Born in other state (%) - White
Place of birth - Born in other state (%) - Black or African American
Place of birth - Born in other state (%) - Asian
Place of birth - Born in other state (%) - Hispanic or Latino
Place of birth - Born in other state (%) - American Indian and Alaska Native
Place of birth - Born in other state (%) - Multirace
Place of birth - Born in other state (%) - Other Race
Place of birth - Native, outside of US (%)
Place of birth - Native, outside of US (%) - White
Place of birth - Native, outside of US (%) - Black or African American
Place of birth - Native, outside of US (%) - Asian
Place of birth - Native, outside of US (%) - Hispanic or Latino
Place of birth - Native, outside of US (%) - American Indian and Alaska Native
Place of birth - Native, outside of US (%) - Multirace
Place of birth - Native, outside of US (%) - Other Race
Place of birth - Foreign born (%)
Place of birth - Foreign born (%) - White
Place of birth - Foreign born (%) - Black or African American
Place of birth - Foreign born (%) - Asian
Place of birth - Foreign born (%) - Hispanic or Latino
Place of birth - Foreign born (%) - American Indian and Alaska Native
Place of birth - Foreign born (%) - Multirace
Place of birth - Foreign born (%) - Other Race
Residents speaking English at home (%)
Residents speaking English at home - Born in the United States (%)
Residents speaking English at home - Native, born elsewhere (%)
Residents speaking English at home - Foreign born (%)
Residents speaking Spanish at home (%)
Residents speaking Spanish at home - Born in the United States (%)
Residents speaking Spanish at home - Native, born elsewhere (%)
Residents speaking Spanish at home - Foreign born (%)
Residents speaking other language at home (%)
Residents speaking other language at home - Born in the United States (%)
Residents speaking other language at home - Native, born elsewhere (%)
Residents speaking other language at home - Foreign born (%)
Marital status - Never married (%)
Marital status - Now married (%)
Marital status - Separated (%)
Marital status - Widowed (%)
Marital status - Divorced (%)
Ancestries Reported - Arab (%)
Ancestries Reported - Czech (%)
Ancestries Reported - Danish (%)
Ancestries Reported - Dutch (%)
Ancestries Reported - English (%)
Ancestries Reported - French (%)
Ancestries Reported - French Canadian (%)
Ancestries Reported - German (%)
Ancestries Reported - Greek (%)
Ancestries Reported - Hungarian (%)
Ancestries Reported - Irish (%)
Ancestries Reported - Italian (%)
Ancestries Reported - Lithuanian (%)
Ancestries Reported - Norwegian (%)
Ancestries Reported - Polish (%)
Ancestries Reported - Portuguese (%)
Ancestries Reported - Russian (%)
Ancestries Reported - Scotch-Irish (%)
Ancestries Reported - Scottish (%)
Ancestries Reported - Slovak (%)
Ancestries Reported - Subsaharan African (%)
Ancestries Reported - Swedish (%)
Ancestries Reported - Swiss (%)
Ancestries Reported - Ukrainian (%)
Ancestries Reported - United States (%)
Ancestries Reported - Welsh (%)
Ancestries Reported - West Indian (%)
Ancestries Reported - Other (%)
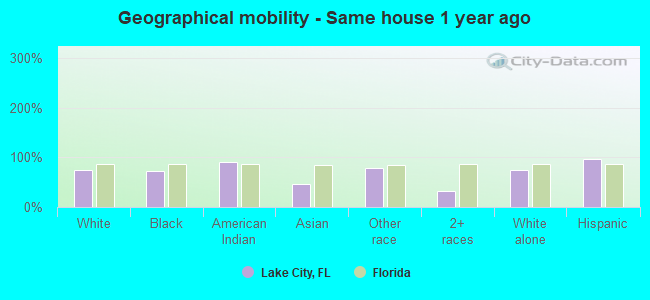
Geographical mobility - Same house 1 year ago (%)
Geographical mobility - Same house 1 year ago (%) - White
Geographical mobility - Same house 1 year ago (%) - Black or African American
Geographical mobility - Same house 1 year ago (%) - Asian
Geographical mobility - Same house 1 year ago (%) - Hispanic or Latino
Geographical mobility - Same house 1 year ago (%) - American Indian and Alaska Native
Geographical mobility - Same house 1 year ago (%) - Multirace
Geographical mobility - Same house 1 year ago (%) - Other Race
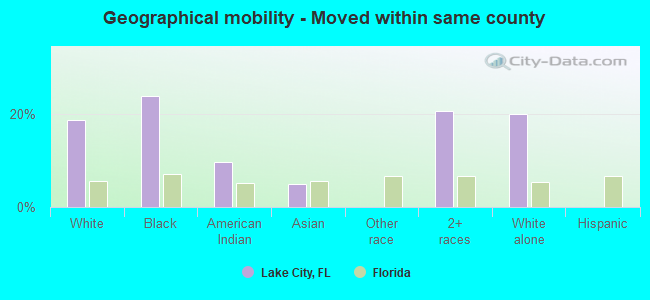
Geographical mobility - Moved within same county (%)
Geographical mobility - Moved within same county (%) - White
Geographical mobility - Moved within same county (%) - Black or African American
Geographical mobility - Moved within same county (%) - Asian
Geographical mobility - Moved within same county (%) - Hispanic or Latino
Geographical mobility - Moved within same county (%) - American Indian and Alaska Native
Geographical mobility - Moved within same county (%) - Multirace
Geographical mobility - Moved within same county (%) - Other Race
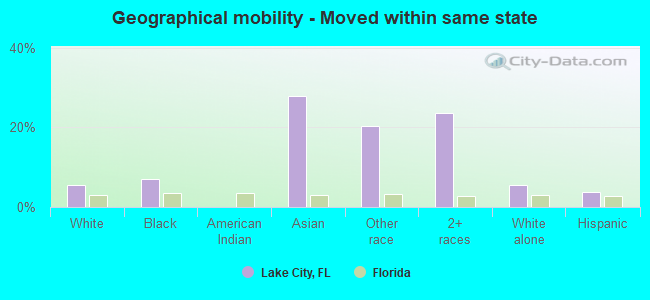
Geographical mobility - Moved from different county within same state (%)
Geographical mobility - Moved from different county within same state (%) - White
Geographical mobility - Moved from different county within same state (%) - Black or African American
Geographical mobility - Moved from different county within same state (%) - Asian
Geographical mobility - Moved from different county within same state (%) - Hispanic or Latino
Geographical mobility - Moved from different county within same state (%) - American Indian and Alaska Native
Geographical mobility - Moved from different county within same state (%) - Multirace
Geographical mobility - Moved from different county within same state (%) - Other Race
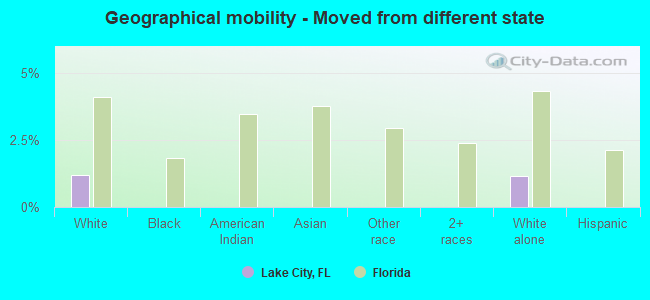
Geographical mobility - Moved from different state (%)
Geographical mobility - Moved from different state (%) - White
Geographical mobility - Moved from different state (%) - Black or African American
Geographical mobility - Moved from different state (%) - Asian
Geographical mobility - Moved from different state (%) - Hispanic or Latino
Geographical mobility - Moved from different state (%) - American Indian and Alaska Native
Geographical mobility - Moved from different state (%) - Multirace
Geographical mobility - Moved from different state (%) - Other Race
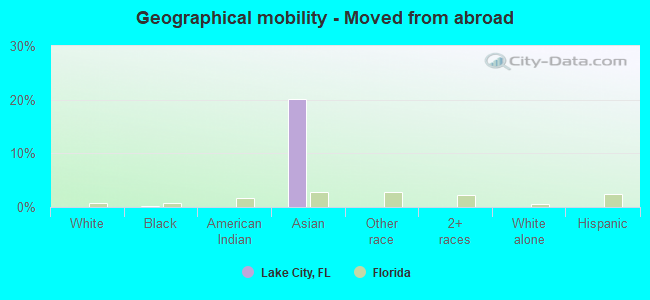
Geographical mobility - Moved from abroad (%)
Geographical mobility - Moved from abroad (%) - White
Geographical mobility - Moved from abroad (%) - Black or African American
Geographical mobility - Moved from abroad (%) - Asian
Geographical mobility - Moved from abroad (%) - Hispanic or Latino
Geographical mobility - Moved from abroad (%) - American Indian and Alaska Native
Geographical mobility - Moved from abroad (%) - Multirace
Geographical mobility - Moved from abroad (%) - Other Race
Place of birth for the foreign-born population - Ireland (%)
Place of birth for the foreign-born population - Denmark (%)
Place of birth for the foreign-born population - Norway (%)
Place of birth for the foreign-born population - Sweden (%)
Place of birth for the foreign-born population - United Kingdom (%)
Place of birth for the foreign-born population - England (%)
Place of birth for the foreign-born population - Scotland (%)
Place of birth for the foreign-born population - Other Northern Europe (%)
Place of birth for the foreign-born population - Austria (%)
Place of birth for the foreign-born population - Belgium (%)
Place of birth for the foreign-born population - France (%)
Place of birth for the foreign-born population - Germany (%)
Place of birth for the foreign-born population - Netherlands (%)
Place of birth for the foreign-born population - Switzerland (%)
Place of birth for the foreign-born population - Other Western Europe (%)
Place of birth for the foreign-born population - Greece (%)
Place of birth for the foreign-born population - Italy (%)
Place of birth for the foreign-born population - Portugal (%)
Place of birth for the foreign-born population - Spain (%)
Place of birth for the foreign-born population - Other Southern Europe (%)
Place of birth for the foreign-born population - Albania (%)
Place of birth for the foreign-born population - Belarus (%)
Place of birth for the foreign-born population - Bosnia and Herzegovina (%)
Place of birth for the foreign-born population - Bulgaria (%)
Place of birth for the foreign-born population - Croatia (%)
Place of birth for the foreign-born population - Czechoslovakia (%)
Place of birth for the foreign-born population - Hungary (%)
Place of birth for the foreign-born population - Latvia (%)
Place of birth for the foreign-born population - Lithuania (%)
Place of birth for the foreign-born population - North Macedonia (Macedonia) (%)
Place of birth for the foreign-born population - Moldova (%)
Place of birth for the foreign-born population - Poland (%)
Place of birth for the foreign-born population - Romania (%)
Place of birth for the foreign-born population - Russia (%)
Place of birth for the foreign-born population - Serbia (%)
Place of birth for the foreign-born population - Ukraine (%)
Place of birth for the foreign-born population - Other Eastern Europe (%)
Place of birth for the foreign-born population - China (%)
Place of birth for the foreign-born population - Hong Kong (%)
Place of birth for the foreign-born population - Taiwan (%)
Place of birth for the foreign-born population - Japan (%)
Place of birth for the foreign-born population - Korea (%)
Place of birth for the foreign-born population - Other Eastern Asia (%)
Place of birth for the foreign-born population - Afghanistan (%)
Place of birth for the foreign-born population - Bangladesh (%)
Place of birth for the foreign-born population - India (%)
Place of birth for the foreign-born population - Iran (%)
Place of birth for the foreign-born population - Kazakhstan (%)
Place of birth for the foreign-born population - Nepal (%)
Place of birth for the foreign-born population - Pakistan (%)
Place of birth for the foreign-born population - Sri Lanka (%)
Place of birth for the foreign-born population - Uzbekistan (%)
Place of birth for the foreign-born population - Other South Central Asia (%)
Place of birth for the foreign-born population - Burma (%)
Place of birth for the foreign-born population - Cambodia (%)
Place of birth for the foreign-born population - Indonesia (%)
Place of birth for the foreign-born population - Laos (%)
Place of birth for the foreign-born population - Malaysia (%)
Place of birth for the foreign-born population - Philippines (%)
Place of birth for the foreign-born population - Singapore (%)
Place of birth for the foreign-born population - Thailand (%)
Place of birth for the foreign-born population - Vietnam (%)
Place of birth for the foreign-born population - Other South Eastern Asia (%)
Place of birth for the foreign-born population - Armenia (%)
Place of birth for the foreign-born population - Iraq (%)
Place of birth for the foreign-born population - Israel (%)
Place of birth for the foreign-born population - Jordan (%)
Place of birth for the foreign-born population - Kuwait (%)
Place of birth for the foreign-born population - Lebanon (%)
Place of birth for the foreign-born population - Saudi Arabia (%)
Place of birth for the foreign-born population - Syria (%)
Place of birth for the foreign-born population - Turkey (%)
Place of birth for the foreign-born population - Yemen (%)
Place of birth for the foreign-born population - Other Western Asia (%)
Place of birth for the foreign-born population - Eritrea (%)
Place of birth for the foreign-born population - Ethiopia (%)
Place of birth for the foreign-born population - Kenya (%)
Place of birth for the foreign-born population - Somalia (%)
Place of birth for the foreign-born population - Uganda (%)
Place of birth for the foreign-born population - Zimbabwe (%)
Place of birth for the foreign-born population - Other Eastern Africa (%)
Place of birth for the foreign-born population - Cameroon (%)
Place of birth for the foreign-born population - Congo (%)
Place of birth for the foreign-born population - Democratic Republic of Congo (Zaire) (%)
Place of birth for the foreign-born population - Other Middle Africa (%)
Place of birth for the foreign-born population - Egypt (%)
Place of birth for the foreign-born population - Morocco (%)
Place of birth for the foreign-born population - Sudan (%)
Place of birth for the foreign-born population - Other Northern Africa (%)
Place of birth for the foreign-born population - South Africa (%)
Place of birth for the foreign-born population - Other Southern Africa (%)
Place of birth for the foreign-born population - Cabo Verde (%)
Place of birth for the foreign-born population - Ghana (%)
Place of birth for the foreign-born population - Liberia (%)
Place of birth for the foreign-born population - Nigeria (%)
Place of birth for the foreign-born population - Senegal (%)
Place of birth for the foreign-born population - Sierra Leone (%)
Place of birth for the foreign-born population - Other Western Africa (%)
Place of birth for the foreign-born population - Australia (%)
Place of birth for the foreign-born population - New Zealand (%)
Place of birth for the foreign-born population - Fiji (%)
Place of birth for the foreign-born population - Micronesia (%)
Place of birth for the foreign-born population - Bahamas (%)
Place of birth for the foreign-born population - Barbados (%)
Place of birth for the foreign-born population - Cuba (%)
Place of birth for the foreign-born population - Dominica (%)
Place of birth for the foreign-born population - Dominican Republic (%)
Place of birth for the foreign-born population - Grenada (%)
Place of birth for the foreign-born population - Haiti (%)
Place of birth for the foreign-born population - Jamaica (%)
Place of birth for the foreign-born population - St. Vincent and the Grenadines (%)
Place of birth for the foreign-born population - Trinidad and Tobago (%)
Place of birth for the foreign-born population - West Indies (%)
Place of birth for the foreign-born population - Other Caribbean (%)
Place of birth for the foreign-born population - Belize (%)
Place of birth for the foreign-born population - Costa Rica (%)
Place of birth for the foreign-born population - El Salvador (%)
Place of birth for the foreign-born population - Guatemala (%)
Place of birth for the foreign-born population - Honduras (%)
Place of birth for the foreign-born population - Mexico (%)
Place of birth for the foreign-born population - Nicaragua (%)
Place of birth for the foreign-born population - Panama (%)
Place of birth for the foreign-born population - Other Central America (%)
Place of birth for the foreign-born population - Argentina (%)
Place of birth for the foreign-born population - Bolivia (%)
Place of birth for the foreign-born population - Brazil (%)
Place of birth for the foreign-born population - Chile (%)
Place of birth for the foreign-born population - Colombia (%)
Place of birth for the foreign-born population - Ecuador (%)
Place of birth for the foreign-born population - Guyana (%)
Place of birth for the foreign-born population - Peru (%)
Place of birth for the foreign-born population - Uruguay (%)
Place of birth for the foreign-born population - Venezuela (%)
Place of birth for the foreign-born population - Other South America (%)
Place of birth for the foreign-born population - Canada (%)
Place of birth for the foreign-born population - Other Northern America (%)
Place of birth for the foreign-born population - Other (%)
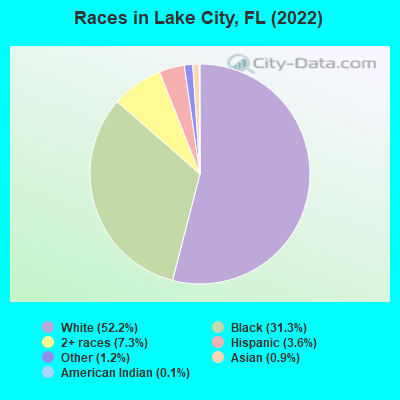
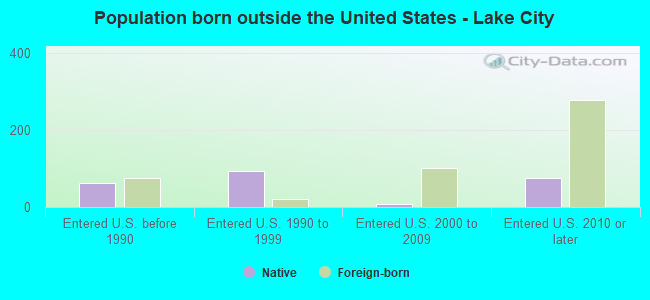
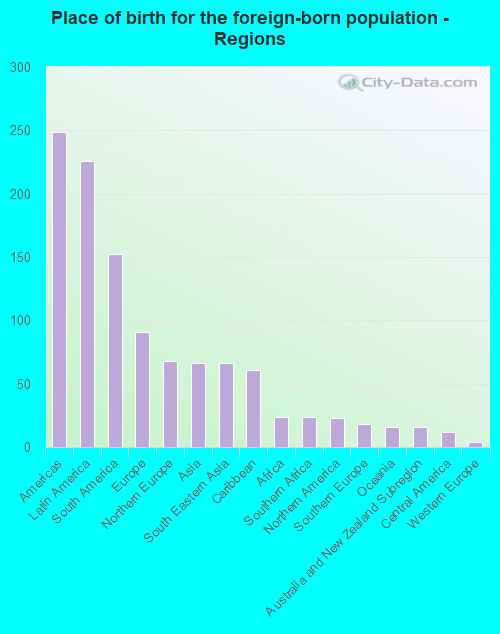
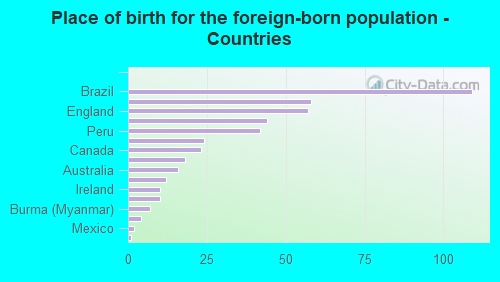
According to 2022 data, the most numerous races in Lake City, FL are White alone (6,619 residents), Hispanic (461 residents), and Black alone (3,970 residents). 94.4% of Lake City residents speak English at home. 3.5% of Lake City, FL residents are foreign-born (1.7% born in Latin America, 0.7% born in Europe, 0.5% born in Asia), which is 494.0% less than the foreign-born rate of 21.0% across the entire state of Florida.
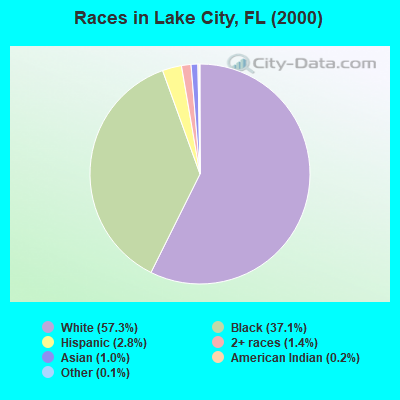
Race distribution in Lake City
2000 2022
10,458,509 65.4% White alone 2,682,715 16.8% Hispanic 2,264,268 14.2% Black alone 261,693 1.6% Asian alone 236,954 1.5% Two or more races 42,358 0.3% American Indian alone 28,994 0.2% Other race alone 6,887 0.04% Native Hawaiian and Other
11,309,403 50.8% White alone 6,025,039 27.1% Hispanic 3,241,015 14.6% Black alone 861,630 3.9% Two or more races 623,692 2.8% Asian alone 152,054 0.7% Other race alone 22,504 0.1% American Indian alone 9,486 0.04% Native Hawaiian and Other
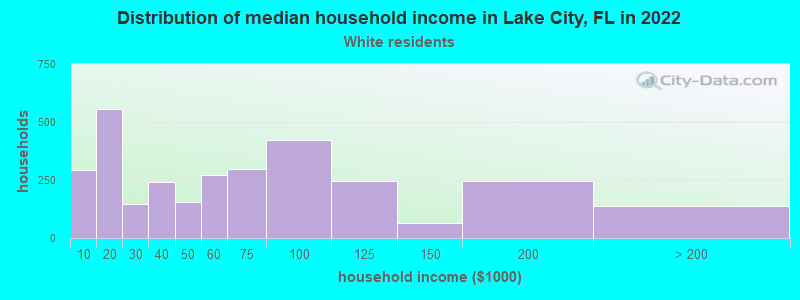
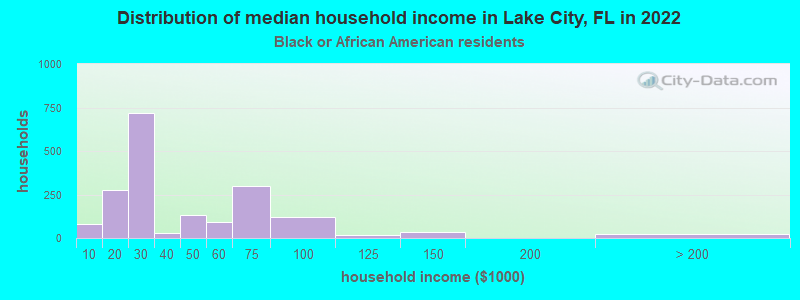
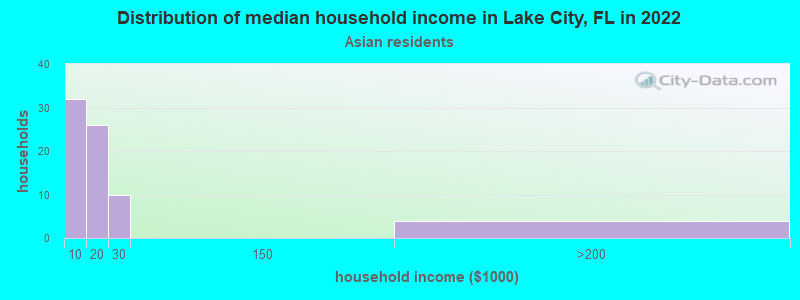
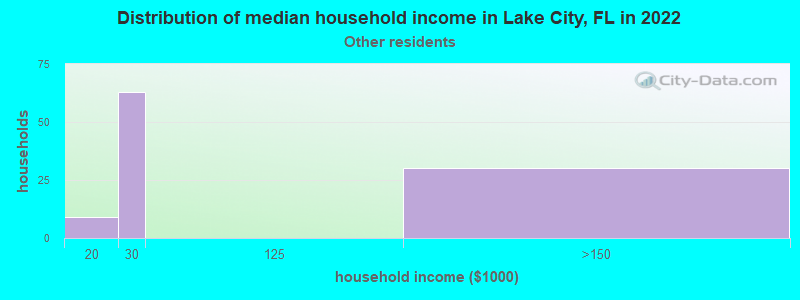
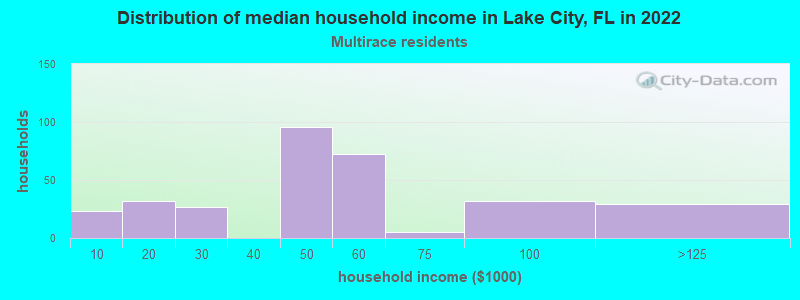
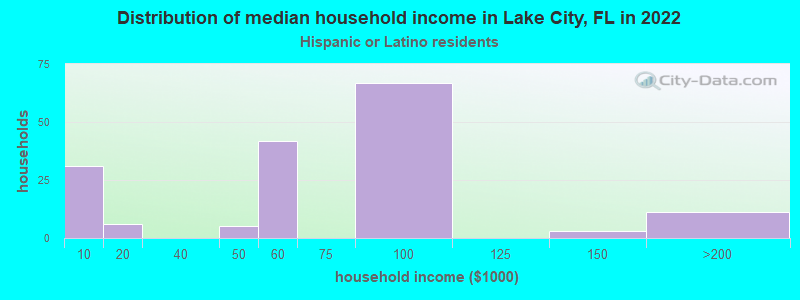
Income and house value in Lake City Median household income in 2022 $58,787 White non-Hispanic householders$19,079 Black householders$77,337 Two or more races householdersMedian 2022 house value $218,341 White Non-Hispanic householders$149,194 Black or African American householders $83,112 Asian householders$289,531 Some other race householders$383,204 Two or more races householders$289,531 Hispanic or Latino householders
Median age by race in Lake City
43.9 Median age for White residents44.0 44.2 31.3 Median age for Black or African American residents29.1 32.5 124.2 Median age for American Indian / Alaska Native residents66.3 -1,317,006,801.4 53.0 Median age for Asian residents40.5 45.2 -666,666,666.0 Median age for Native Hawaiian / Pacific Islander residents-666,666,666.0 -666,666,666.0 19.2 Median age for Other race residents17.1 26.2 13.5 Median age for Two or more races residents12.8 31.2 43.6 Median age for White alone residents44.1 44.3 31.2 Median age for Hispanic or Latino residents33.2 17.3
Owner/renter occupied households by race in Lake City
House owners and renters - White residents 1,333 46.1% Owner occupied1,558 53.9% Renter occupiedHouse owners and renters - Black or African American residents 418 22.1% Owner occupied1,473 77.9% Renter occupiedHouse owners and renters - American Indian / Alaska Native residents 4 38.6% Owner occupied6 61.4% Renter occupiedHouse owners and renters - Asian residents 3 4.8% Owner occupied66 95.2% Renter occupiedHouse owners and renters - Other race residents 119 100.0% Renter occupiedHouse owners and renters - Two or more races residents 40 20.8% Owner occupied152 79.2% Renter occupiedHouse owners and renters - White alone residents 1,267 44.6% Owner occupied1,576 55.4% Renter occupiedHouse owners and renters - Hispanic or Latino residents 106 70.7% Owner occupied44 29.3% Renter occupied
Language usage in Lake City
English speakers - Total 94.4% of residents of Lake City speak English at home.
2.8% of residents speak Spanish at home 120 36.4% Speak English very well210 63.6% Speak English less than very well2.5% of residents speak other language at home 222 76.3% Speak English very well69 23.7% Speak English less than very well
English speakers - Born in the United States 99.0% of residents of Lake City speak English at home.
1.1% of residents speak other language at home 37 100.0% Speak English very well
English speakers - Native, born elsewhere 40.1% of residents of Lake City speak English at home.
39.2% of residents speak Spanish at home 41 44.1% Speak English very well52 55.9% Speak English less than very well20.7% of residents speak other language at home 49 100.0% Speak English very well
English speakers - Foreign-born 30.1% of residents of Lake City speak English at home.
47.1% of residents speak Spanish at home 74 35.1% Speak English very well137 64.9% Speak English less than very well22.1% of residents speak other language at home 38 38.4% Speak English very well61 61.6% Speak English less than very well
White (Caucasian) - Speak only English Native:
100.0% (5,823)Foreign-born:
81.3% (116)
White (Caucasian) - Speak another language Native:
1.7% (99)Foreign-born:
41.3% (59)
Black or African American - Speak another language Native:
0.9% (34)Foreign-born:
100.0% (43)
Asian - Speak another language Native:
52.3% (22)Foreign-born:
100.0% (85)
Other race - Speak another language Native:
3.3% (10)Foreign-born:
100.0% (20)
Two or more races - Speak another language Native:
9.7% (109)Foreign-born:
100.0% (72)
White alone - Speak only English Native:
98.5% (5,897)Foreign-born:
57.4% (133)
White alone - Speak another language Native:
1.6% (96)Foreign-born:
43.5% (101)
Hispanic or Latino - Speak only English Native:
60.1% (190)Foreign-born:
3.5% (2)
Hispanic or Latino - Speak another language Native:
39.9% (126)Foreign-born:
85.8% (46)
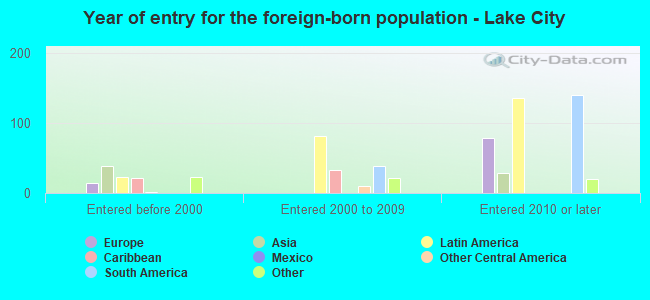
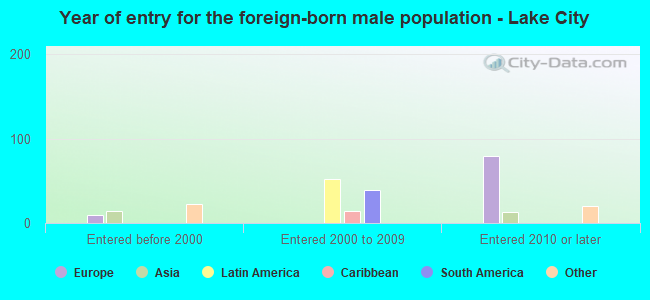
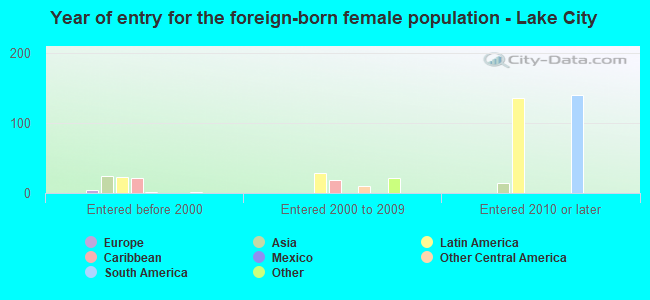
Foreign-born residents in Lake City 448 residents are foreign born (1.7% Latin America , 0.7% Europe , 0.5% Asia ).
This city:
3.5%Florida:
21.1%
Marital status for residents in Lake City Marital status - White (Caucasian) population 15 years and over
Males 33.0% Never married46.3% Now married1.0% Separated6.2% Widowed13.6% DivorcedFemales 21.8% Never married42.2% Now married1.5% Separated12.3% Widowed22.1% DivorcedWomen who gave birth in the past 12 months Now married:
100.0% (63)Unmarried:
0.0% (0)
Women who did not give birth in the past 12 months Now married:
38.8% (616)Unmarried:
61.2% (969)
Marital status - Black or African American population 15 years and over
Males 61.2% Never married14.7% Now married1.0% Separated4.8% Widowed18.3% DivorcedFemales 49.3% Never married14.7% Now married0.0% Separated12.8% Widowed23.2% DivorcedWomen who gave birth in the past 12 months Now married:
0.0% (0)Unmarried:
100.0% (103)
Women who did not give birth in the past 12 months Now married:
17.5% (144)Unmarried:
82.5% (676)
Marital status - American Indian / Alaska Native population 15 years and over
Males 46.2% Never married0.0% Now married0.0% Separated53.8% Widowed0.0% DivorcedFemales 0.0% Never married100.0% Now married0.0% Separated0.0% Widowed0.0% DivorcedMarital status - Asian population 15 years and over
Males 30.5% Never married69.5% Now married0.0% Separated0.0% Widowed0.0% DivorcedFemales 0.0% Never married66.1% Now married0.0% Separated0.0% Widowed33.9% DivorcedWomen who did not give birth in the past 12 months Now married:
38.7% (12)Unmarried:
61.3% (20)
Marital status - Other race population 15 years and over
Males 45.7% Never married41.3% Now married0.0% Separated0.0% Widowed13.0% DivorcedFemales 30.4% Never married69.6% Now married0.0% Separated0.0% Widowed0.0% DivorcedWomen who did not give birth in the past 12 months Now married:
69.6% (148)Unmarried:
30.4% (64)
Marital status - Two or more races population 15 years and over
Males 34.7% Never married48.0% Now married0.0% Separated0.0% Widowed17.3% DivorcedFemales 70.7% Never married12.6% Now married0.0% Separated0.0% Widowed16.7% DivorcedWomen who did not give birth in the past 12 months Now married:
10.5% (29)Unmarried:
89.5% (244)
Marital status - White alone, not Hispanic / Latino population 15 years and over
Males 32.8% Never married45.9% Now married1.0% Separated6.3% Widowed13.9% DivorcedFemales 21.5% Never married42.5% Now married1.6% Separated12.0% Widowed22.5% DivorcedWomen who gave birth in the past 12 months Now married:
100.0% (63)Unmarried:
0.0% (0)
Women who did not give birth in the past 12 months Now married:
39.2% (614)Unmarried:
60.8% (954)
Marital status - Hispanic or Latino population 15 years and over
Males 26.2% Never married70.1% Now married0.0% Separated0.0% Widowed3.7% DivorcedFemales 22.7% Never married53.4% Now married0.0% Separated20.5% Widowed3.4% DivorcedWomen who did not give birth in the past 12 months Now married:
65.5% (43)Unmarried:
34.5% (23)
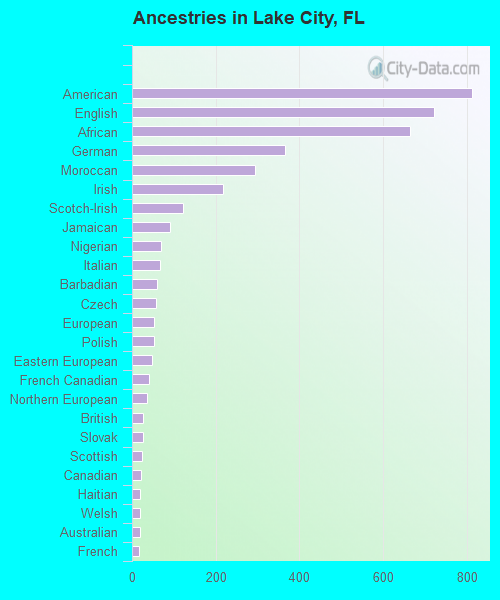
Ancestries in Lake City
812 12.0% American721 10.6% English665 9.8% African365 5.4% German294 4.3% Moroccan218 3.2% Irish122 1.8% Scotch-Irish90 1.3% Jamaican69 1.0% Nigerian67 1.0% Italian60 0.9% Barbadian57 0.8% Czech53 0.8% European53 0.8% Polish48 0.7% Eastern European40 0.6% French Canadian35 0.5% Northern European26 0.4% British26 0.4% Slovak23 0.3% Scottish22 0.3% Canadian20 0.3% Haitian19 0.3% Welsh18 0.3% Australian17 0.3% French15 0.2% Dutch12 0.2% Swiss10 0.1% Celtic10 0.1% Swedish3 0.04% Trinidadian and Tobagonian
Children Nativity (place of birth) in Lake City
Children under 6 years - Living with two parents Both parents native 248 100.0% NativeBoth parents foreign-born 34 100.0% NativeOne native, one foreign-born parent 45 100.0% NativeChildren under 6 years - Living with one parent Native parent 647 100.0% NativeChildren 6 to 17 years - Living with two parents Both parents native 538 100.0% NativeBoth parents foreign-born 7 11.1% Native57 88.9% Foreign-bornOne native, one foreign-born parent 116 100.0% NativeChildren 6 to 17 years - Living with one parent Native parent 1,144 100.0% Native
Grandparents responsible for own grandchildren in Lake City
Grandparents (30 to 59 years) White / Caucasian 4 100.0% Responsible for grandchildrenBlack or African American 109 76.1% Responsible for grandchildren34 23.9% Not responsible for grandchildrenWhite alone, not Hispanic / Latino 5 100.0% Responsible for grandchildrenGrandparents (60 years and over) White / Caucasian 132 81.9% Responsible for grandchildren29 18.1% Not responsible for grandchildrenBlack or African American 6 36.0% Responsible for grandchildren11 64.0% Not responsible for grandchildrenWhite alone, not Hispanic / Latino 143 79.4% Responsible for grandchildren37 20.6% Not responsible for grandchildren