Races in Lake Elmo, Minnesota (MN) Detailed Stats
Data:
Races - White alone (%)
Races - White alone (% change since 2000)
Races - Black alone (%)
Races - Black alone (% change since 2000)
Races - American Indian alone (%)
Races - American Indian alone (% change since 2000)
Races - Asian alone (%)
Races - Asian alone (% change since 2000)
Races - Hispanic (%)
Races - Hispanic (% change since 2000)
Races - Native Hawaiian and Other Pacific Islander alone (%)
Races - Native Hawaiian and Other Pacific Islander alone (% change since 2000)
Races - Two or more races(%)
Races - Two or more races(% change since 2000)
Races - Other race alone (%)
Races - Other race alone (% change since 2000)
Racial diversity
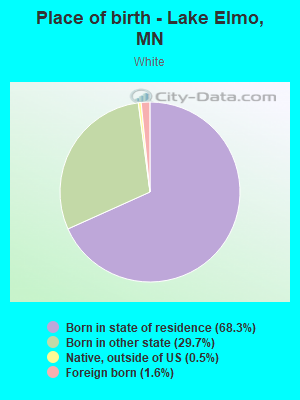
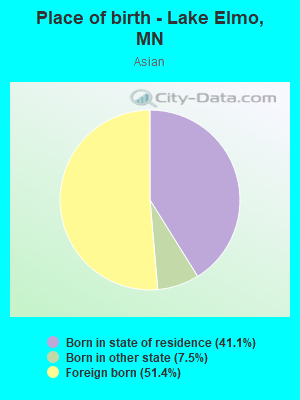
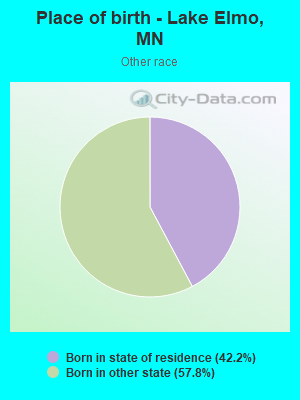
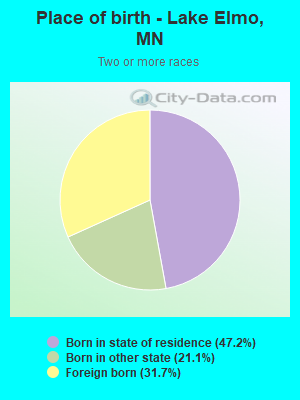
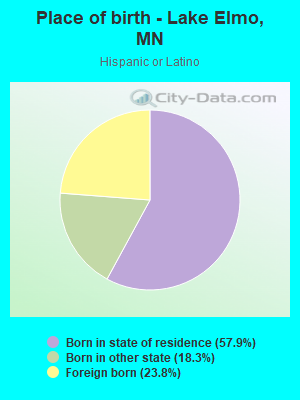
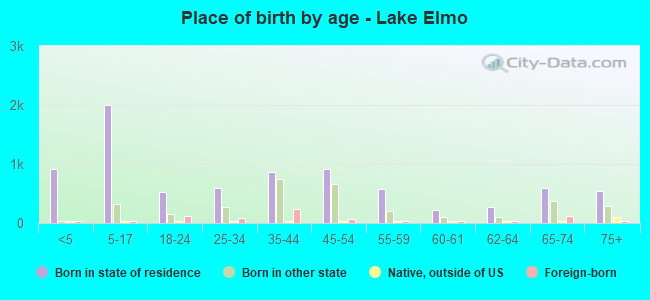
Place of birth - Born in state of residence (%)
Place of birth - Born in state of residence (%) - White
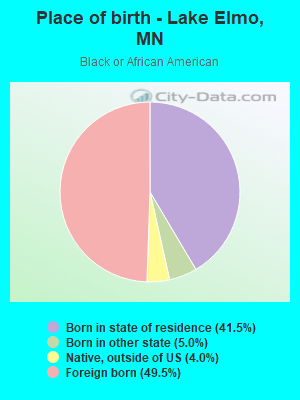
Place of birth - Born in state of residence (%) - Black or African American
Place of birth - Born in state of residence (%) - Asian
Place of birth - Born in state of residence (%) - Hispanic or Latino
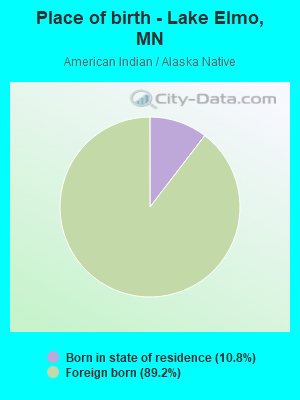
Place of birth - Born in state of residence (%) - American Indian and Alaska Native
Place of birth - Born in state of residence (%) - Multirace
Place of birth - Born in state of residence (%) - Other Race
Place of birth - Born in other state (%)
Place of birth - Born in other state (%) - White
Place of birth - Born in other state (%) - Black or African American
Place of birth - Born in other state (%) - Asian
Place of birth - Born in other state (%) - Hispanic or Latino
Place of birth - Born in other state (%) - American Indian and Alaska Native
Place of birth - Born in other state (%) - Multirace
Place of birth - Born in other state (%) - Other Race
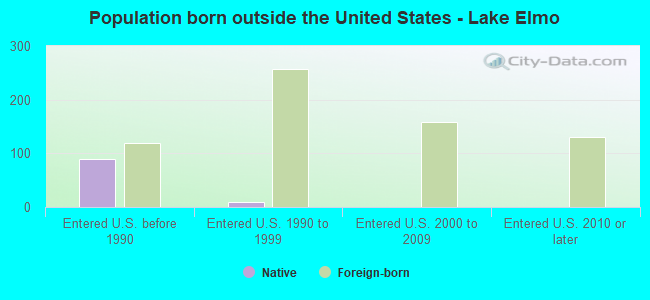
Place of birth - Native, outside of US (%)
Place of birth - Native, outside of US (%) - White
Place of birth - Native, outside of US (%) - Black or African American
Place of birth - Native, outside of US (%) - Asian
Place of birth - Native, outside of US (%) - Hispanic or Latino
Place of birth - Native, outside of US (%) - American Indian and Alaska Native
Place of birth - Native, outside of US (%) - Multirace
Place of birth - Native, outside of US (%) - Other Race
Place of birth - Foreign born (%)
Place of birth - Foreign born (%) - White
Place of birth - Foreign born (%) - Black or African American
Place of birth - Foreign born (%) - Asian
Place of birth - Foreign born (%) - Hispanic or Latino
Place of birth - Foreign born (%) - American Indian and Alaska Native
Place of birth - Foreign born (%) - Multirace
Place of birth - Foreign born (%) - Other Race
Residents speaking English at home (%)
Residents speaking English at home - Born in the United States (%)
Residents speaking English at home - Native, born elsewhere (%)
Residents speaking English at home - Foreign born (%)
Residents speaking Spanish at home (%)
Residents speaking Spanish at home - Born in the United States (%)
Residents speaking Spanish at home - Native, born elsewhere (%)
Residents speaking Spanish at home - Foreign born (%)
Residents speaking other language at home (%)
Residents speaking other language at home - Born in the United States (%)
Residents speaking other language at home - Native, born elsewhere (%)
Residents speaking other language at home - Foreign born (%)
Marital status - Never married (%)
Marital status - Now married (%)
Marital status - Separated (%)
Marital status - Widowed (%)
Marital status - Divorced (%)
Ancestries Reported - Arab (%)
Ancestries Reported - Czech (%)
Ancestries Reported - Danish (%)
Ancestries Reported - Dutch (%)
Ancestries Reported - English (%)
Ancestries Reported - French (%)
Ancestries Reported - French Canadian (%)
Ancestries Reported - German (%)
Ancestries Reported - Greek (%)
Ancestries Reported - Hungarian (%)
Ancestries Reported - Irish (%)
Ancestries Reported - Italian (%)
Ancestries Reported - Lithuanian (%)
Ancestries Reported - Norwegian (%)
Ancestries Reported - Polish (%)
Ancestries Reported - Portuguese (%)
Ancestries Reported - Russian (%)
Ancestries Reported - Scotch-Irish (%)
Ancestries Reported - Scottish (%)
Ancestries Reported - Slovak (%)
Ancestries Reported - Subsaharan African (%)
Ancestries Reported - Swedish (%)
Ancestries Reported - Swiss (%)
Ancestries Reported - Ukrainian (%)
Ancestries Reported - United States (%)
Ancestries Reported - Welsh (%)
Ancestries Reported - West Indian (%)
Ancestries Reported - Other (%)
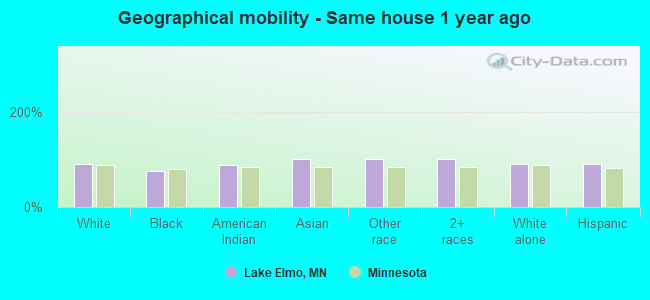
Geographical mobility - Same house 1 year ago (%)
Geographical mobility - Same house 1 year ago (%) - White
Geographical mobility - Same house 1 year ago (%) - Black or African American
Geographical mobility - Same house 1 year ago (%) - Asian
Geographical mobility - Same house 1 year ago (%) - Hispanic or Latino
Geographical mobility - Same house 1 year ago (%) - American Indian and Alaska Native
Geographical mobility - Same house 1 year ago (%) - Multirace
Geographical mobility - Same house 1 year ago (%) - Other Race
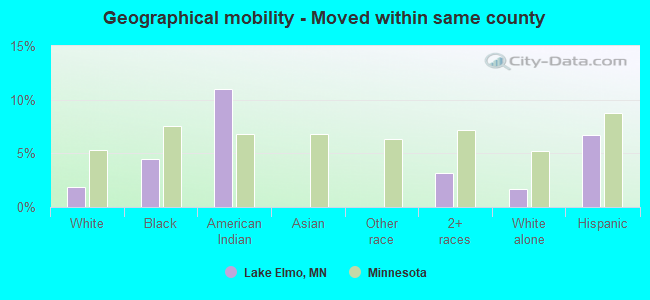
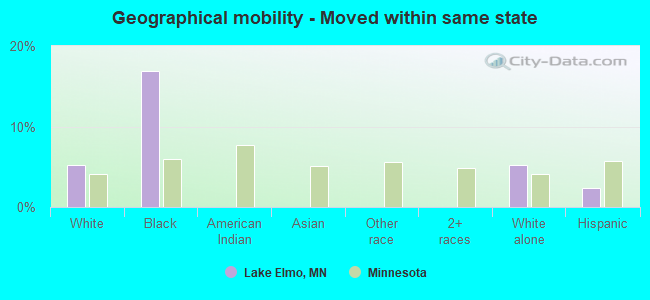
Geographical mobility - Moved within same county (%)
Geographical mobility - Moved within same county (%) - White
Geographical mobility - Moved within same county (%) - Black or African American
Geographical mobility - Moved within same county (%) - Asian
Geographical mobility - Moved within same county (%) - Hispanic or Latino
Geographical mobility - Moved within same county (%) - American Indian and Alaska Native
Geographical mobility - Moved within same county (%) - Multirace
Geographical mobility - Moved within same county (%) - Other Race
Geographical mobility - Moved from different county within same state (%)
Geographical mobility - Moved from different county within same state (%) - White
Geographical mobility - Moved from different county within same state (%) - Black or African American
Geographical mobility - Moved from different county within same state (%) - Asian
Geographical mobility - Moved from different county within same state (%) - Hispanic or Latino
Geographical mobility - Moved from different county within same state (%) - American Indian and Alaska Native
Geographical mobility - Moved from different county within same state (%) - Multirace
Geographical mobility - Moved from different county within same state (%) - Other Race
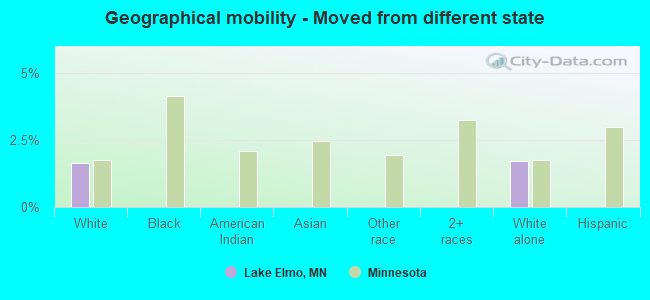
Geographical mobility - Moved from different state (%)
Geographical mobility - Moved from different state (%) - White
Geographical mobility - Moved from different state (%) - Black or African American
Geographical mobility - Moved from different state (%) - Asian
Geographical mobility - Moved from different state (%) - Hispanic or Latino
Geographical mobility - Moved from different state (%) - American Indian and Alaska Native
Geographical mobility - Moved from different state (%) - Multirace
Geographical mobility - Moved from different state (%) - Other Race
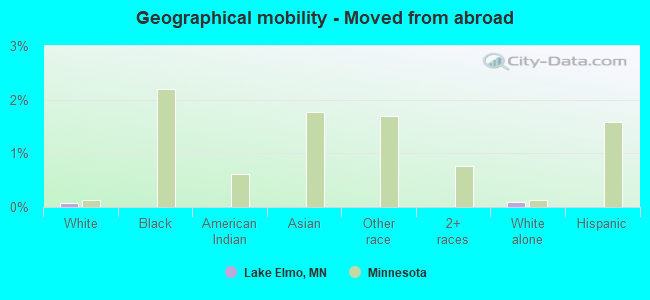
Geographical mobility - Moved from abroad (%)
Geographical mobility - Moved from abroad (%) - White
Geographical mobility - Moved from abroad (%) - Black or African American
Geographical mobility - Moved from abroad (%) - Asian
Geographical mobility - Moved from abroad (%) - Hispanic or Latino
Geographical mobility - Moved from abroad (%) - American Indian and Alaska Native
Geographical mobility - Moved from abroad (%) - Multirace
Geographical mobility - Moved from abroad (%) - Other Race
Place of birth for the foreign-born population - Ireland (%)
Place of birth for the foreign-born population - Denmark (%)
Place of birth for the foreign-born population - Norway (%)
Place of birth for the foreign-born population - Sweden (%)
Place of birth for the foreign-born population - United Kingdom (%)
Place of birth for the foreign-born population - England (%)
Place of birth for the foreign-born population - Scotland (%)
Place of birth for the foreign-born population - Other Northern Europe (%)
Place of birth for the foreign-born population - Austria (%)
Place of birth for the foreign-born population - Belgium (%)
Place of birth for the foreign-born population - France (%)
Place of birth for the foreign-born population - Germany (%)
Place of birth for the foreign-born population - Netherlands (%)
Place of birth for the foreign-born population - Switzerland (%)
Place of birth for the foreign-born population - Other Western Europe (%)
Place of birth for the foreign-born population - Greece (%)
Place of birth for the foreign-born population - Italy (%)
Place of birth for the foreign-born population - Portugal (%)
Place of birth for the foreign-born population - Spain (%)
Place of birth for the foreign-born population - Other Southern Europe (%)
Place of birth for the foreign-born population - Albania (%)
Place of birth for the foreign-born population - Belarus (%)
Place of birth for the foreign-born population - Bosnia and Herzegovina (%)
Place of birth for the foreign-born population - Bulgaria (%)
Place of birth for the foreign-born population - Croatia (%)
Place of birth for the foreign-born population - Czechoslovakia (%)
Place of birth for the foreign-born population - Hungary (%)
Place of birth for the foreign-born population - Latvia (%)
Place of birth for the foreign-born population - Lithuania (%)
Place of birth for the foreign-born population - North Macedonia (Macedonia) (%)
Place of birth for the foreign-born population - Moldova (%)
Place of birth for the foreign-born population - Poland (%)
Place of birth for the foreign-born population - Romania (%)
Place of birth for the foreign-born population - Russia (%)
Place of birth for the foreign-born population - Serbia (%)
Place of birth for the foreign-born population - Ukraine (%)
Place of birth for the foreign-born population - Other Eastern Europe (%)
Place of birth for the foreign-born population - China (%)
Place of birth for the foreign-born population - Hong Kong (%)
Place of birth for the foreign-born population - Taiwan (%)
Place of birth for the foreign-born population - Japan (%)
Place of birth for the foreign-born population - Korea (%)
Place of birth for the foreign-born population - Other Eastern Asia (%)
Place of birth for the foreign-born population - Afghanistan (%)
Place of birth for the foreign-born population - Bangladesh (%)
Place of birth for the foreign-born population - India (%)
Place of birth for the foreign-born population - Iran (%)
Place of birth for the foreign-born population - Kazakhstan (%)
Place of birth for the foreign-born population - Nepal (%)
Place of birth for the foreign-born population - Pakistan (%)
Place of birth for the foreign-born population - Sri Lanka (%)
Place of birth for the foreign-born population - Uzbekistan (%)
Place of birth for the foreign-born population - Other South Central Asia (%)
Place of birth for the foreign-born population - Burma (%)
Place of birth for the foreign-born population - Cambodia (%)
Place of birth for the foreign-born population - Indonesia (%)
Place of birth for the foreign-born population - Laos (%)
Place of birth for the foreign-born population - Malaysia (%)
Place of birth for the foreign-born population - Philippines (%)
Place of birth for the foreign-born population - Singapore (%)
Place of birth for the foreign-born population - Thailand (%)
Place of birth for the foreign-born population - Vietnam (%)
Place of birth for the foreign-born population - Other South Eastern Asia (%)
Place of birth for the foreign-born population - Armenia (%)
Place of birth for the foreign-born population - Iraq (%)
Place of birth for the foreign-born population - Israel (%)
Place of birth for the foreign-born population - Jordan (%)
Place of birth for the foreign-born population - Kuwait (%)
Place of birth for the foreign-born population - Lebanon (%)
Place of birth for the foreign-born population - Saudi Arabia (%)
Place of birth for the foreign-born population - Syria (%)
Place of birth for the foreign-born population - Turkey (%)
Place of birth for the foreign-born population - Yemen (%)
Place of birth for the foreign-born population - Other Western Asia (%)
Place of birth for the foreign-born population - Eritrea (%)
Place of birth for the foreign-born population - Ethiopia (%)
Place of birth for the foreign-born population - Kenya (%)
Place of birth for the foreign-born population - Somalia (%)
Place of birth for the foreign-born population - Uganda (%)
Place of birth for the foreign-born population - Zimbabwe (%)
Place of birth for the foreign-born population - Other Eastern Africa (%)
Place of birth for the foreign-born population - Cameroon (%)
Place of birth for the foreign-born population - Congo (%)
Place of birth for the foreign-born population - Democratic Republic of Congo (Zaire) (%)
Place of birth for the foreign-born population - Other Middle Africa (%)
Place of birth for the foreign-born population - Egypt (%)
Place of birth for the foreign-born population - Morocco (%)
Place of birth for the foreign-born population - Sudan (%)
Place of birth for the foreign-born population - Other Northern Africa (%)
Place of birth for the foreign-born population - South Africa (%)
Place of birth for the foreign-born population - Other Southern Africa (%)
Place of birth for the foreign-born population - Cabo Verde (%)
Place of birth for the foreign-born population - Ghana (%)
Place of birth for the foreign-born population - Liberia (%)
Place of birth for the foreign-born population - Nigeria (%)
Place of birth for the foreign-born population - Senegal (%)
Place of birth for the foreign-born population - Sierra Leone (%)
Place of birth for the foreign-born population - Other Western Africa (%)
Place of birth for the foreign-born population - Australia (%)
Place of birth for the foreign-born population - New Zealand (%)
Place of birth for the foreign-born population - Fiji (%)
Place of birth for the foreign-born population - Micronesia (%)
Place of birth for the foreign-born population - Bahamas (%)
Place of birth for the foreign-born population - Barbados (%)
Place of birth for the foreign-born population - Cuba (%)
Place of birth for the foreign-born population - Dominica (%)
Place of birth for the foreign-born population - Dominican Republic (%)
Place of birth for the foreign-born population - Grenada (%)
Place of birth for the foreign-born population - Haiti (%)
Place of birth for the foreign-born population - Jamaica (%)
Place of birth for the foreign-born population - St. Vincent and the Grenadines (%)
Place of birth for the foreign-born population - Trinidad and Tobago (%)
Place of birth for the foreign-born population - West Indies (%)
Place of birth for the foreign-born population - Other Caribbean (%)
Place of birth for the foreign-born population - Belize (%)
Place of birth for the foreign-born population - Costa Rica (%)
Place of birth for the foreign-born population - El Salvador (%)
Place of birth for the foreign-born population - Guatemala (%)
Place of birth for the foreign-born population - Honduras (%)
Place of birth for the foreign-born population - Mexico (%)
Place of birth for the foreign-born population - Nicaragua (%)
Place of birth for the foreign-born population - Panama (%)
Place of birth for the foreign-born population - Other Central America (%)
Place of birth for the foreign-born population - Argentina (%)
Place of birth for the foreign-born population - Bolivia (%)
Place of birth for the foreign-born population - Brazil (%)
Place of birth for the foreign-born population - Chile (%)
Place of birth for the foreign-born population - Colombia (%)
Place of birth for the foreign-born population - Ecuador (%)
Place of birth for the foreign-born population - Guyana (%)
Place of birth for the foreign-born population - Peru (%)
Place of birth for the foreign-born population - Uruguay (%)
Place of birth for the foreign-born population - Venezuela (%)
Place of birth for the foreign-born population - Other South America (%)
Place of birth for the foreign-born population - Canada (%)
Place of birth for the foreign-born population - Other Northern America (%)
Place of birth for the foreign-born population - Other (%)
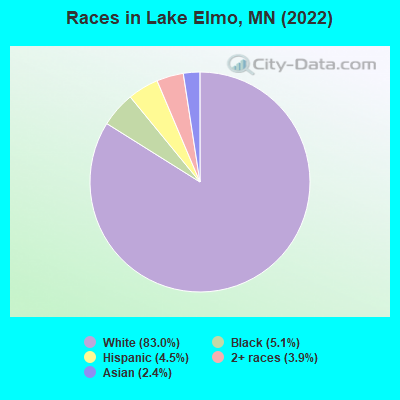
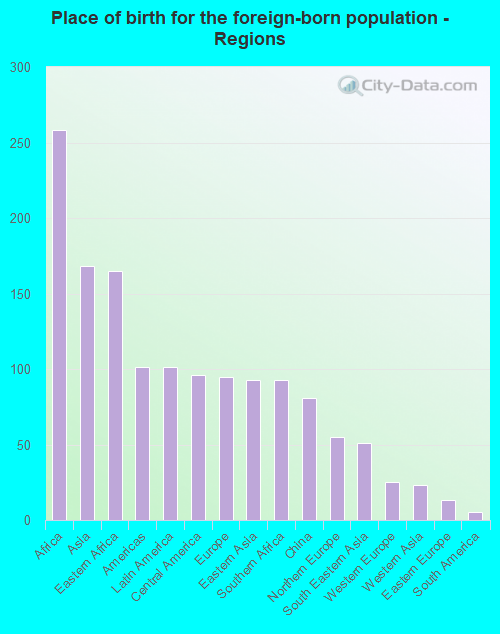
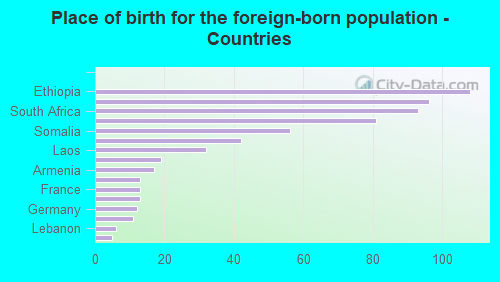
According to 2022 data, the most numerous races in Lake Elmo, MN are White alone (10,114 residents), Black alone (621 residents), and Hispanic (545 residents). 91.4% of Lake Elmo residents speak English at home. 5.1% of Lake Elmo, MN residents are foreign-born (2.1% born in Africa, 1.4% born in Asia, 0.8% born in Latin America, 0.8% born in Europe), which is 56.2% less than the foreign-born rate of 8.0% across the entire state of Minnesota.
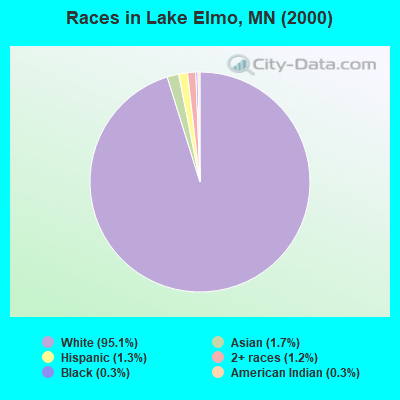
Race distribution in Lake Elmo
2000 2022
4,337,143 88.2% White alone 168,813 3.4% Black alone 143,382 2.9% Hispanic 141,083 2.9% Asian alone 70,304 1.4% Two or more races 52,009 1.1% American Indian alone 5,031 0.1% Other race alone 1,714 0.03% Native Hawaiian and Other
4,356,347 76.2% White alone 395,179 6.9% Black alone 333,830 5.8% Hispanic 294,800 5.2% Asian alone 259,649 4.5% Two or more races 42,125 0.7% American Indian alone 32,976 0.6% Other race alone 2,278 0.04% Native Hawaiian and Other
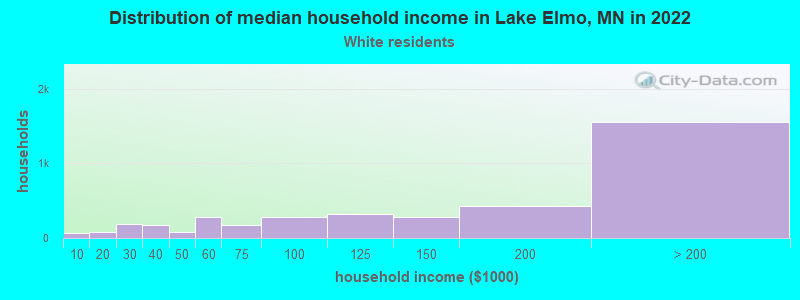
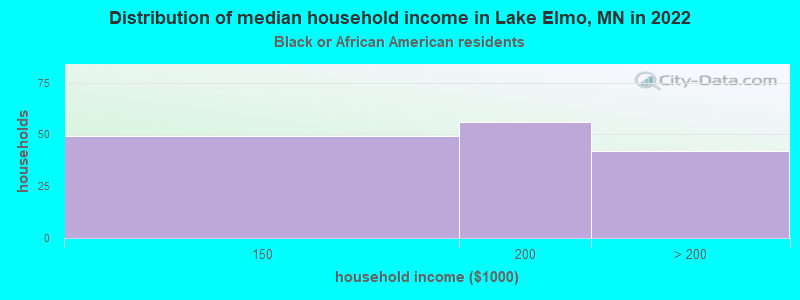
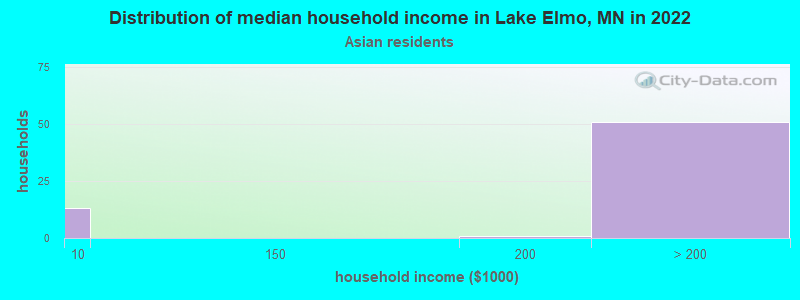
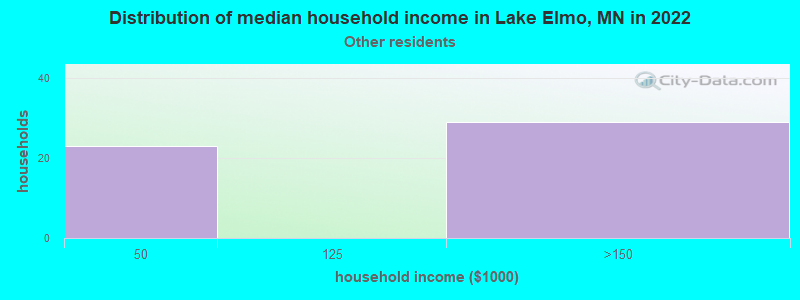
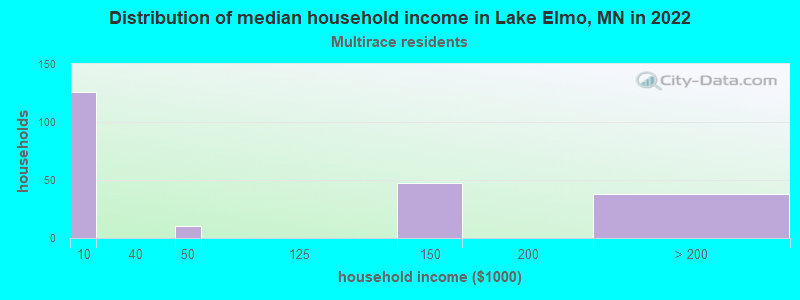
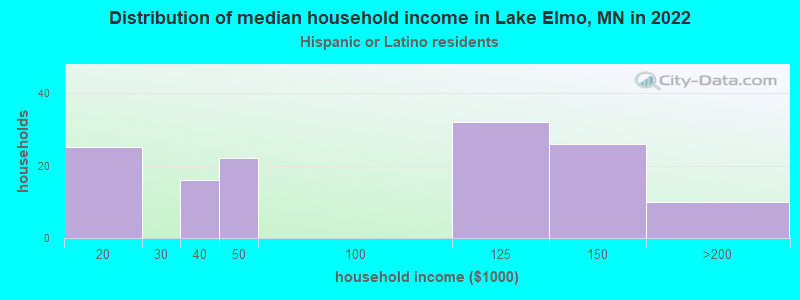
Income and house value in Lake Elmo Median household income in 2022 $159,664 White non-Hispanic householders$131,350 Black householdersover $200,000 Asian householdersMedian 2022 house value $651,706 White Non-Hispanic householders$271,782 American Indian or Alaska Native householders $582,473 Asian householders$393,369 Native Hawaiian and other Pacific Islander householdersover $1,000,000 Some other race householders$743,826 Two or more races householders$266,347 Hispanic or Latino householders
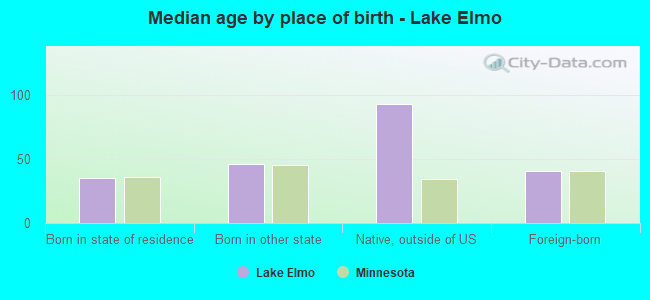
Median age by race in Lake Elmo
43.2 Median age for White residents43.8 42.7 19.0 Median age for Black or African American residents18.7 17.0 22.3 Median age for American Indian / Alaska Native residents-854,838,708.8 -539,487,178.9 30.8 Median age for Asian residents37.6 29.0 -744,336,568.8 Median age for Native Hawaiian / Pacific Islander residents-856,799,036.4 -534,959,349.1 59.0 Median age for Other race residents-704,826,037.5 -672,708,962.1 23.6 Median age for Two or more races residents19.6 22.4 43.8 Median age for White alone residents44.1 43.8 28.5 Median age for Hispanic or Latino residents27.7 26.1
Owner/renter occupied households by race in Lake Elmo
House owners and renters - White residents 3,664 92.5% Owner occupied299 7.5% Renter occupiedHouse owners and renters - Black or African American residents 107 100.0% Owner occupiedHouse owners and renters - Asian residents 71 90.2% Owner occupied8 9.8% Renter occupiedHouse owners and renters - Other race residents 27 44.2% Owner occupied34 55.8% Renter occupiedHouse owners and renters - Two or more races residents 153 100.0% Owner occupiedHouse owners and renters - White alone residents 3,654 93.3% Owner occupied262 6.7% Renter occupiedHouse owners and renters - Hispanic or Latino residents 35 21.2% Owner occupied128 78.8% Renter occupied
Language usage in Lake Elmo
English speakers - Total 91.4% of residents of Lake Elmo speak English at home.
2.5% of residents speak Spanish at home 109 38.8% Speak English very well172 61.2% Speak English less than very well5.1% of residents speak other language at home 433 74.8% Speak English very well146 25.2% Speak English less than very well
English speakers - Born in the United States 98.0% of residents of Lake Elmo speak English at home.
0.5% of residents speak Spanish at home 18 100.0% Speak English very well0.4% of residents speak other language at home 12 100.0% Speak English very well
English speakers - Native, born elsewhere 85.3% of residents of Lake Elmo speak English at home.
English speakers - Foreign-born 37.2% of residents of Lake Elmo speak English at home.
21.7% of residents speak Spanish at home 162 100.0% Speak English less than very well51.7% of residents speak other language at home 337 87.3% Speak English very well49 12.7% Speak English less than very well
White (Caucasian) - Speak only English Native:
97.9% (9,320)Foreign-born:
66.8% (109)
White (Caucasian) - Speak another language Native:
2.1% (198)Foreign-born:
38.8% (63)
Black or African American - Speak another language Native:
24.1% (48)Foreign-born:
93.9% (285)
American Indian / Alaska Native - Speak only English Native:
100.0% (1)Foreign-born:
62.1% (5)
Asian - Speak only English Native:
54.2% (77)Foreign-born:
19.0% (29)
Asian - Speak another language Native:
44.2% (62)Foreign-born:
81.0% (122)
Two or more races - Speak only English Native:
100.0% (347)Foreign-born:
69.8% (134)
White alone - Speak only English Native:
98.8% (9,208)Foreign-born:
94.3% (99)
White alone - Speak another language Native:
1.1% (104)Foreign-born:
20.5% (22)
Hispanic or Latino - Speak only English Native:
52.8% (195)Foreign-born:
15.7% (20)
Hispanic or Latino - Speak another language Native:
47.6% (176)Foreign-born:
84.1% (105)
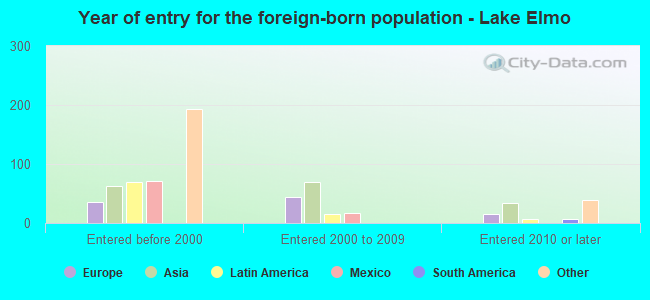
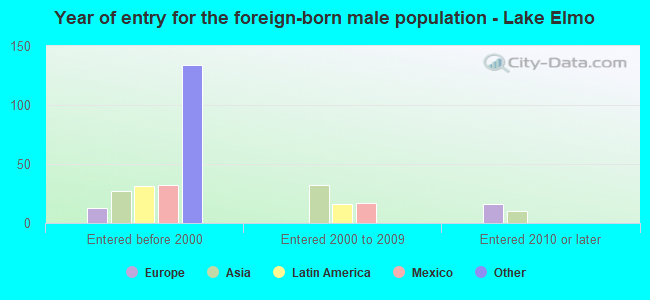
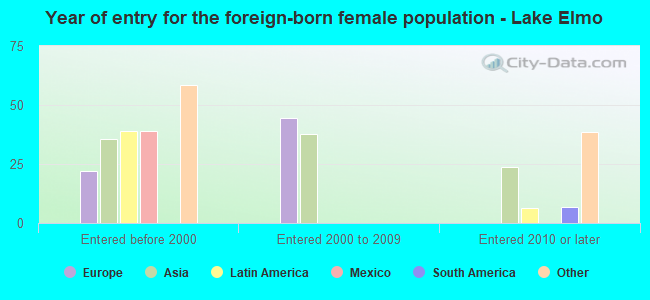
Foreign-born residents in Lake Elmo 624 residents are foreign born (2.1% Africa , 1.4% Asia , 0.8% Latin America , 0.8% Europe ).
This city:
5.1%Minnesota:
8.5%
Marital status for residents in Lake Elmo Marital status - White (Caucasian) population 15 years and over
Males 22.2% Never married70.8% Now married1.2% Separated2.5% Widowed3.4% DivorcedFemales 22.0% Never married65.9% Now married0.4% Separated5.5% Widowed6.2% DivorcedWomen who gave birth in the past 12 months Now married:
100.0% (183)Unmarried:
0.0% (0)
Women who did not give birth in the past 12 months Now married:
58.5% (1,246)Unmarried:
41.5% (883)
Marital status - Black or African American population 15 years and over
Males 45.2% Never married54.8% Now married0.0% Separated0.0% Widowed0.0% DivorcedFemales 36.0% Never married64.0% Now married0.0% Separated0.0% Widowed0.0% DivorcedWomen who did not give birth in the past 12 months Now married:
41.8% (47)Unmarried:
58.2% (66)
Marital status - American Indian / Alaska Native population 15 years and over
Males 50.0% Never married0.0% Now married0.0% Separated0.0% Widowed50.0% DivorcedFemales 100.0% Never married0.0% Now married0.0% Separated0.0% Widowed0.0% DivorcedWomen who did not give birth in the past 12 months Now married:
0.0% (0)Unmarried:
100.0% (5)
Marital status - Asian population 15 years and over
Males 56.6% Never married43.4% Now married0.0% Separated0.0% Widowed0.0% DivorcedFemales 42.6% Never married49.6% Now married0.0% Separated0.0% Widowed7.8% DivorcedWomen who gave birth in the past 12 months Now married:
100.0% (6)Unmarried:
0.0% (0)
Women who did not give birth in the past 12 months Now married:
33.0% (36)Unmarried:
67.0% (74)
Marital status - Other race population 15 years and over
Males 51.3% Never married48.7% Now married0.0% Separated0.0% Widowed0.0% DivorcedFemales 0.0% Never married100.0% Now married0.0% Separated0.0% Widowed0.0% DivorcedWomen who did not give birth in the past 12 months Now married:
100.0% (14)Unmarried:
0.0% (0)
Marital status - Two or more races population 15 years and over
Males 83.1% Never married16.9% Now married0.0% Separated0.0% Widowed0.0% DivorcedFemales 35.5% Never married38.0% Now married0.0% Separated0.0% Widowed26.4% DivorcedWomen who did not give birth in the past 12 months Now married:
57.5% (70)Unmarried:
42.5% (52)
Marital status - White alone, not Hispanic / Latino population 15 years and over
Males 21.6% Never married71.1% Now married1.2% Separated2.6% Widowed3.5% DivorcedFemales 22.0% Never married65.5% Now married0.5% Separated5.7% Widowed6.4% DivorcedWomen who gave birth in the past 12 months Now married:
100.0% (147)Unmarried:
0.0% (0)
Women who did not give birth in the past 12 months Now married:
58.5% (1,217)Unmarried:
41.5% (864)
Marital status - Hispanic or Latino population 15 years and over
Males 42.9% Never married57.1% Now married0.0% Separated0.0% Widowed0.0% DivorcedFemales 22.7% Never married77.3% Now married0.0% Separated0.0% Widowed0.0% DivorcedWomen who gave birth in the past 12 months Now married:
100.0% (41)Unmarried:
0.0% (0)
Women who did not give birth in the past 12 months Now married:
61.1% (62)Unmarried:
38.9% (39)
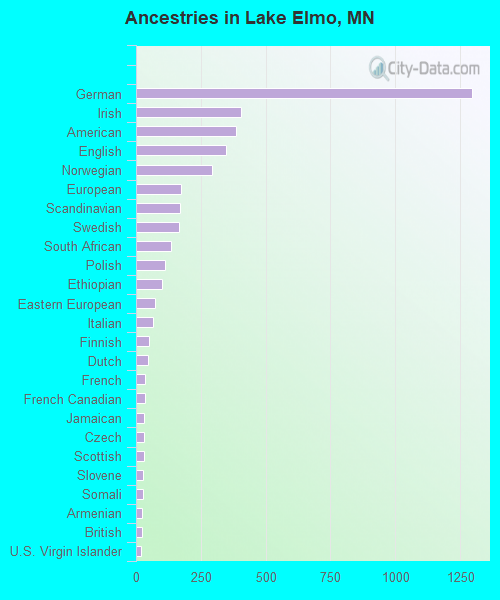
Ancestries in Lake Elmo
1,297 27.3% German407 8.6% Irish386 8.1% American346 7.3% English295 6.2% Norwegian175 3.7% European170 3.6% Scandinavian167 3.5% Swedish134 2.8% South African111 2.3% Polish100 2.1% Ethiopian73 1.5% Eastern European65 1.4% Italian52 1.1% Finnish48 1.0% Dutch36 0.8% French34 0.7% French Canadian31 0.7% Jamaican29 0.6% Czech29 0.6% Scottish27 0.6% Slovene27 0.6% Somali23 0.5% Armenian22 0.5% British18 0.4% U.S. Virgin Islander16 0.3% Luxembourger14 0.3% Danish11 0.2% Pennsylvania German9 0.2% Czechoslovakian9 0.2% Welsh
Children Nativity (place of birth) in Lake Elmo
Children under 6 years - Living with two parents Both parents native 915 100.0% NativeBoth parents foreign-born 60 100.0% NativeOne native, one foreign-born parent 40 100.0% NativeChildren under 6 years - Living with one parent Native parent 49 100.0% NativeChildren 6 to 17 years - Living with two parents Both parents native 1,723 99.1% Native16 0.9% Foreign-bornBoth parents foreign-born 253 100.0% NativeOne native, one foreign-born parent 15 100.0% NativeChildren 6 to 17 years - Living with one parent Native parent 143 100.0% NativeForeign-born parent 34 57.5% Native25 42.5% Foreign-born
Grandparents responsible for own grandchildren in Lake Elmo
Grandparents (30 to 59 years) White / Caucasian 29 100.0% Not responsible for grandchildrenWhite alone, not Hispanic / Latino 30 100.0% Not responsible for grandchildrenGrandparents (60 years and over) White / Caucasian 3 52.2% Responsible for grandchildren3 47.8% Not responsible for grandchildrenWhite alone, not Hispanic / Latino 3 52.9% Responsible for grandchildren3 47.1% Not responsible for grandchildren