Races in Lake Forest, Illinois (IL) Detailed Stats
Data:
Races - White alone (%)
Races - White alone (% change since 2000)
Races - Black alone (%)
Races - Black alone (% change since 2000)
Races - American Indian alone (%)
Races - American Indian alone (% change since 2000)
Races - Asian alone (%)
Races - Asian alone (% change since 2000)
Races - Hispanic (%)
Races - Hispanic (% change since 2000)
Races - Native Hawaiian and Other Pacific Islander alone (%)
Races - Native Hawaiian and Other Pacific Islander alone (% change since 2000)
Races - Two or more races(%)
Races - Two or more races(% change since 2000)
Races - Other race alone (%)
Races - Other race alone (% change since 2000)
Racial diversity
Place of birth - Born in state of residence (%)
Place of birth - Born in state of residence (%) - White
Place of birth - Born in state of residence (%) - Black or African American
Place of birth - Born in state of residence (%) - Asian
Place of birth - Born in state of residence (%) - Hispanic or Latino
Place of birth - Born in state of residence (%) - American Indian and Alaska Native
Place of birth - Born in state of residence (%) - Multirace
Place of birth - Born in state of residence (%) - Other Race
Place of birth - Born in other state (%)
Place of birth - Born in other state (%) - White
Place of birth - Born in other state (%) - Black or African American
Place of birth - Born in other state (%) - Asian
Place of birth - Born in other state (%) - Hispanic or Latino
Place of birth - Born in other state (%) - American Indian and Alaska Native
Place of birth - Born in other state (%) - Multirace
Place of birth - Born in other state (%) - Other Race
Place of birth - Native, outside of US (%)
Place of birth - Native, outside of US (%) - White
Place of birth - Native, outside of US (%) - Black or African American
Place of birth - Native, outside of US (%) - Asian
Place of birth - Native, outside of US (%) - Hispanic or Latino
Place of birth - Native, outside of US (%) - American Indian and Alaska Native
Place of birth - Native, outside of US (%) - Multirace
Place of birth - Native, outside of US (%) - Other Race
Place of birth - Foreign born (%)
Place of birth - Foreign born (%) - White
Place of birth - Foreign born (%) - Black or African American
Place of birth - Foreign born (%) - Asian
Place of birth - Foreign born (%) - Hispanic or Latino
Place of birth - Foreign born (%) - American Indian and Alaska Native
Place of birth - Foreign born (%) - Multirace
Place of birth - Foreign born (%) - Other Race
Residents speaking English at home (%)
Residents speaking English at home - Born in the United States (%)
Residents speaking English at home - Native, born elsewhere (%)
Residents speaking English at home - Foreign born (%)
Residents speaking Spanish at home (%)
Residents speaking Spanish at home - Born in the United States (%)
Residents speaking Spanish at home - Native, born elsewhere (%)
Residents speaking Spanish at home - Foreign born (%)
Residents speaking other language at home (%)
Residents speaking other language at home - Born in the United States (%)
Residents speaking other language at home - Native, born elsewhere (%)
Residents speaking other language at home - Foreign born (%)
Marital status - Never married (%)
Marital status - Now married (%)
Marital status - Separated (%)
Marital status - Widowed (%)
Marital status - Divorced (%)
Ancestries Reported - Arab (%)
Ancestries Reported - Czech (%)
Ancestries Reported - Danish (%)
Ancestries Reported - Dutch (%)
Ancestries Reported - English (%)
Ancestries Reported - French (%)
Ancestries Reported - French Canadian (%)
Ancestries Reported - German (%)
Ancestries Reported - Greek (%)
Ancestries Reported - Hungarian (%)
Ancestries Reported - Irish (%)
Ancestries Reported - Italian (%)
Ancestries Reported - Lithuanian (%)
Ancestries Reported - Norwegian (%)
Ancestries Reported - Polish (%)
Ancestries Reported - Portuguese (%)
Ancestries Reported - Russian (%)
Ancestries Reported - Scotch-Irish (%)
Ancestries Reported - Scottish (%)
Ancestries Reported - Slovak (%)
Ancestries Reported - Subsaharan African (%)
Ancestries Reported - Swedish (%)
Ancestries Reported - Swiss (%)
Ancestries Reported - Ukrainian (%)
Ancestries Reported - United States (%)
Ancestries Reported - Welsh (%)
Ancestries Reported - West Indian (%)
Ancestries Reported - Other (%)
Geographical mobility - Same house 1 year ago (%)
Geographical mobility - Same house 1 year ago (%) - White
Geographical mobility - Same house 1 year ago (%) - Black or African American
Geographical mobility - Same house 1 year ago (%) - Asian
Geographical mobility - Same house 1 year ago (%) - Hispanic or Latino
Geographical mobility - Same house 1 year ago (%) - American Indian and Alaska Native
Geographical mobility - Same house 1 year ago (%) - Multirace
Geographical mobility - Same house 1 year ago (%) - Other Race
Geographical mobility - Moved within same county (%)
Geographical mobility - Moved within same county (%) - White
Geographical mobility - Moved within same county (%) - Black or African American
Geographical mobility - Moved within same county (%) - Asian
Geographical mobility - Moved within same county (%) - Hispanic or Latino
Geographical mobility - Moved within same county (%) - American Indian and Alaska Native
Geographical mobility - Moved within same county (%) - Multirace
Geographical mobility - Moved within same county (%) - Other Race
Geographical mobility - Moved from different county within same state (%)
Geographical mobility - Moved from different county within same state (%) - White
Geographical mobility - Moved from different county within same state (%) - Black or African American
Geographical mobility - Moved from different county within same state (%) - Asian
Geographical mobility - Moved from different county within same state (%) - Hispanic or Latino
Geographical mobility - Moved from different county within same state (%) - American Indian and Alaska Native
Geographical mobility - Moved from different county within same state (%) - Multirace
Geographical mobility - Moved from different county within same state (%) - Other Race
Geographical mobility - Moved from different state (%)
Geographical mobility - Moved from different state (%) - White
Geographical mobility - Moved from different state (%) - Black or African American
Geographical mobility - Moved from different state (%) - Asian
Geographical mobility - Moved from different state (%) - Hispanic or Latino
Geographical mobility - Moved from different state (%) - American Indian and Alaska Native
Geographical mobility - Moved from different state (%) - Multirace
Geographical mobility - Moved from different state (%) - Other Race
Geographical mobility - Moved from abroad (%)
Geographical mobility - Moved from abroad (%) - White
Geographical mobility - Moved from abroad (%) - Black or African American
Geographical mobility - Moved from abroad (%) - Asian
Geographical mobility - Moved from abroad (%) - Hispanic or Latino
Geographical mobility - Moved from abroad (%) - American Indian and Alaska Native
Geographical mobility - Moved from abroad (%) - Multirace
Geographical mobility - Moved from abroad (%) - Other Race
Place of birth for the foreign-born population - Ireland (%)
Place of birth for the foreign-born population - Denmark (%)
Place of birth for the foreign-born population - Norway (%)
Place of birth for the foreign-born population - Sweden (%)
Place of birth for the foreign-born population - United Kingdom (%)
Place of birth for the foreign-born population - England (%)
Place of birth for the foreign-born population - Scotland (%)
Place of birth for the foreign-born population - Other Northern Europe (%)
Place of birth for the foreign-born population - Austria (%)
Place of birth for the foreign-born population - Belgium (%)
Place of birth for the foreign-born population - France (%)
Place of birth for the foreign-born population - Germany (%)
Place of birth for the foreign-born population - Netherlands (%)
Place of birth for the foreign-born population - Switzerland (%)
Place of birth for the foreign-born population - Other Western Europe (%)
Place of birth for the foreign-born population - Greece (%)
Place of birth for the foreign-born population - Italy (%)
Place of birth for the foreign-born population - Portugal (%)
Place of birth for the foreign-born population - Spain (%)
Place of birth for the foreign-born population - Other Southern Europe (%)
Place of birth for the foreign-born population - Albania (%)
Place of birth for the foreign-born population - Belarus (%)
Place of birth for the foreign-born population - Bosnia and Herzegovina (%)
Place of birth for the foreign-born population - Bulgaria (%)
Place of birth for the foreign-born population - Croatia (%)
Place of birth for the foreign-born population - Czechoslovakia (%)
Place of birth for the foreign-born population - Hungary (%)
Place of birth for the foreign-born population - Latvia (%)
Place of birth for the foreign-born population - Lithuania (%)
Place of birth for the foreign-born population - North Macedonia (Macedonia) (%)
Place of birth for the foreign-born population - Moldova (%)
Place of birth for the foreign-born population - Poland (%)
Place of birth for the foreign-born population - Romania (%)
Place of birth for the foreign-born population - Russia (%)
Place of birth for the foreign-born population - Serbia (%)
Place of birth for the foreign-born population - Ukraine (%)
Place of birth for the foreign-born population - Other Eastern Europe (%)
Place of birth for the foreign-born population - China (%)
Place of birth for the foreign-born population - Hong Kong (%)
Place of birth for the foreign-born population - Taiwan (%)
Place of birth for the foreign-born population - Japan (%)
Place of birth for the foreign-born population - Korea (%)
Place of birth for the foreign-born population - Other Eastern Asia (%)
Place of birth for the foreign-born population - Afghanistan (%)
Place of birth for the foreign-born population - Bangladesh (%)
Place of birth for the foreign-born population - India (%)
Place of birth for the foreign-born population - Iran (%)
Place of birth for the foreign-born population - Kazakhstan (%)
Place of birth for the foreign-born population - Nepal (%)
Place of birth for the foreign-born population - Pakistan (%)
Place of birth for the foreign-born population - Sri Lanka (%)
Place of birth for the foreign-born population - Uzbekistan (%)
Place of birth for the foreign-born population - Other South Central Asia (%)
Place of birth for the foreign-born population - Burma (%)
Place of birth for the foreign-born population - Cambodia (%)
Place of birth for the foreign-born population - Indonesia (%)
Place of birth for the foreign-born population - Laos (%)
Place of birth for the foreign-born population - Malaysia (%)
Place of birth for the foreign-born population - Philippines (%)
Place of birth for the foreign-born population - Singapore (%)
Place of birth for the foreign-born population - Thailand (%)
Place of birth for the foreign-born population - Vietnam (%)
Place of birth for the foreign-born population - Other South Eastern Asia (%)
Place of birth for the foreign-born population - Armenia (%)
Place of birth for the foreign-born population - Iraq (%)
Place of birth for the foreign-born population - Israel (%)
Place of birth for the foreign-born population - Jordan (%)
Place of birth for the foreign-born population - Kuwait (%)
Place of birth for the foreign-born population - Lebanon (%)
Place of birth for the foreign-born population - Saudi Arabia (%)
Place of birth for the foreign-born population - Syria (%)
Place of birth for the foreign-born population - Turkey (%)
Place of birth for the foreign-born population - Yemen (%)
Place of birth for the foreign-born population - Other Western Asia (%)
Place of birth for the foreign-born population - Eritrea (%)
Place of birth for the foreign-born population - Ethiopia (%)
Place of birth for the foreign-born population - Kenya (%)
Place of birth for the foreign-born population - Somalia (%)
Place of birth for the foreign-born population - Uganda (%)
Place of birth for the foreign-born population - Zimbabwe (%)
Place of birth for the foreign-born population - Other Eastern Africa (%)
Place of birth for the foreign-born population - Cameroon (%)
Place of birth for the foreign-born population - Congo (%)
Place of birth for the foreign-born population - Democratic Republic of Congo (Zaire) (%)
Place of birth for the foreign-born population - Other Middle Africa (%)
Place of birth for the foreign-born population - Egypt (%)
Place of birth for the foreign-born population - Morocco (%)
Place of birth for the foreign-born population - Sudan (%)
Place of birth for the foreign-born population - Other Northern Africa (%)
Place of birth for the foreign-born population - South Africa (%)
Place of birth for the foreign-born population - Other Southern Africa (%)
Place of birth for the foreign-born population - Cabo Verde (%)
Place of birth for the foreign-born population - Ghana (%)
Place of birth for the foreign-born population - Liberia (%)
Place of birth for the foreign-born population - Nigeria (%)
Place of birth for the foreign-born population - Senegal (%)
Place of birth for the foreign-born population - Sierra Leone (%)
Place of birth for the foreign-born population - Other Western Africa (%)
Place of birth for the foreign-born population - Australia (%)
Place of birth for the foreign-born population - New Zealand (%)
Place of birth for the foreign-born population - Fiji (%)
Place of birth for the foreign-born population - Micronesia (%)
Place of birth for the foreign-born population - Bahamas (%)
Place of birth for the foreign-born population - Barbados (%)
Place of birth for the foreign-born population - Cuba (%)
Place of birth for the foreign-born population - Dominica (%)
Place of birth for the foreign-born population - Dominican Republic (%)
Place of birth for the foreign-born population - Grenada (%)
Place of birth for the foreign-born population - Haiti (%)
Place of birth for the foreign-born population - Jamaica (%)
Place of birth for the foreign-born population - St. Vincent and the Grenadines (%)
Place of birth for the foreign-born population - Trinidad and Tobago (%)
Place of birth for the foreign-born population - West Indies (%)
Place of birth for the foreign-born population - Other Caribbean (%)
Place of birth for the foreign-born population - Belize (%)
Place of birth for the foreign-born population - Costa Rica (%)
Place of birth for the foreign-born population - El Salvador (%)
Place of birth for the foreign-born population - Guatemala (%)
Place of birth for the foreign-born population - Honduras (%)
Place of birth for the foreign-born population - Mexico (%)
Place of birth for the foreign-born population - Nicaragua (%)
Place of birth for the foreign-born population - Panama (%)
Place of birth for the foreign-born population - Other Central America (%)
Place of birth for the foreign-born population - Argentina (%)
Place of birth for the foreign-born population - Bolivia (%)
Place of birth for the foreign-born population - Brazil (%)
Place of birth for the foreign-born population - Chile (%)
Place of birth for the foreign-born population - Colombia (%)
Place of birth for the foreign-born population - Ecuador (%)
Place of birth for the foreign-born population - Guyana (%)
Place of birth for the foreign-born population - Peru (%)
Place of birth for the foreign-born population - Uruguay (%)
Place of birth for the foreign-born population - Venezuela (%)
Place of birth for the foreign-born population - Other South America (%)
Place of birth for the foreign-born population - Canada (%)
Place of birth for the foreign-born population - Other Northern America (%)
Place of birth for the foreign-born population - Other (%)
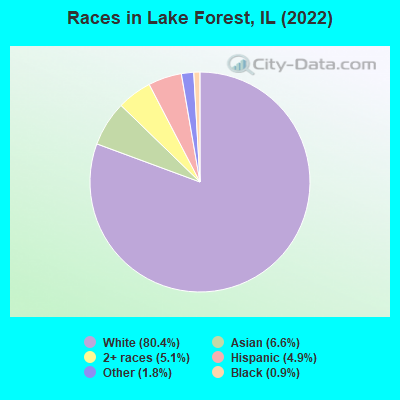
According to 2022 data, the most numerous races in Lake Forest, IL are White alone (15,542 residents), Hispanic (949 residents), and Black alone (172 residents). 86.0% of Lake Forest residents speak English at home. 11.2% of Lake Forest, IL residents are foreign-born (4.7% born in Asia, 3.5% born in Europe, 1.4% born in Latin America), which is 25.2% less than the foreign-born rate of 14.0% across the entire state of Illinois.
Race distribution in Lake Forest
2000 2022
8,424,140 67.8% White alone 1,856,152 14.9% Black alone 1,530,262 12.3% Hispanic 419,916 3.4% Asian alone 153,996 1.2% Two or more races 13,479 0.1% Other race alone 18,232 0.1% American Indian alone 3,116 0.03% Native Hawaiian and Other
7,356,301 58.5% White alone 2,299,726 18.3% Hispanic 1,660,423 13.2% Black alone 747,296 5.9% Asian alone 458,599 3.6% Two or more races 45,386 0.4% Other race alone 10,405 0.08% American Indian alone 3,896 0.03% Native Hawaiian and Other
Income and house value in Lake Forest Median household income in 2022 over $200,000 White non-Hispanic householdersover $200,000 Black householders$111,050 Asian householders$98,964 Some other race householders$192,609 Two or more races householders$121,609 Hispanic or Latino race householdersMedian 2022 house value $973,957 White Non-Hispanic householders$633,942 Black or African American householders over $1,000,000 Asian householders$329,187 Native Hawaiian and other Pacific Islander householders$356,693 Some other race householders$642,135 Two or more races householders$853,401 Hispanic or Latino householders
Median age by race in Lake Forest
50.8 Median age for White residents48.0 53.7 21.4 Median age for Black or African American residents20.7 44.7 8.8 Median age for American Indian / Alaska Native residents5.5 10.0 39.2 Median age for Asian residents38.9 40.3 -593,236,714.4 Median age for Native Hawaiian / Pacific Islander residents-658,536,584.7 -576,015,108.0 32.8 Median age for Other race residents18.5 34.2 21.3 Median age for Two or more races residents19.0 28.0 50.3 Median age for White alone residents47.3 53.7 23.1 Median age for Hispanic or Latino residents23.6 22.9
Owner/renter occupied households by race in Lake Forest
House owners and renters - White residents 5,292 88.7% Owner occupied677 11.3% Renter occupiedHouse owners and renters - Black or African American residents 3 16.9% Owner occupied17 83.1% Renter occupiedHouse owners and renters - American Indian / Alaska Native residents 17 100.0% Owner occupiedHouse owners and renters - Asian residents 314 73.0% Owner occupied116 27.0% Renter occupiedHouse owners and renters - Other race residents 64 84.8% Owner occupied12 15.2% Renter occupiedHouse owners and renters - Two or more races residents 324 88.0% Owner occupied44 12.0% Renter occupiedHouse owners and renters - White alone residents 5,440 88.4% Owner occupied717 11.6% Renter occupiedHouse owners and renters - Hispanic or Latino residents 122 76.9% Owner occupied37 23.1% Renter occupied
Language usage in Lake Forest
English speakers - Total 86.0% of residents of Lake Forest speak English at home.
3.6% of residents speak Spanish at home 591 89.3% Speak English very well71 10.7% Speak English less than very well9.7% of residents speak other language at home 1,490 83.3% Speak English very well299 16.7% Speak English less than very well
English speakers - Born in the United States 95.4% of residents of Lake Forest speak English at home.
1.6% of residents speak Spanish at home 73 73.0% Speak English very well27 27.0% Speak English less than very well2.4% of residents speak other language at home 140 92.7% Speak English very well11 7.3% Speak English less than very well
English speakers - Native, born elsewhere 58.2% of residents of Lake Forest speak English at home.
22.0% of residents speak Spanish at home 27 69.2% Speak English very well12 30.8% Speak English less than very well18.6% of residents speak other language at home 33 100.0% Speak English very well
English speakers - Foreign-born 35.8% of residents of Lake Forest speak English at home.
9.2% of residents speak Spanish at home 177 87.2% Speak English very well26 12.8% Speak English less than very well54.7% of residents speak other language at home 919 76.0% Speak English very well291 24.0% Speak English less than very well
White (Caucasian) - Speak only English Native:
100.0% (13,585)Foreign-born:
61.5% (524)
White (Caucasian) - Speak another language Native:
2.0% (277)Foreign-born:
50.3% (428)
Black or African American - Speak only English Native:
96.7% (157)Foreign-born:
34.6% (8)
Black or African American - Speak another language Native:
3.3% (5)Foreign-born:
65.4% (16)
Asian - Speak only English Native:
39.2% (148)Foreign-born:
15.6% (126)
Asian - Speak another language Native:
64.3% (243)Foreign-born:
83.5% (675)
Other race - Speak only English Native:
72.9% (153)Foreign-born:
95.2% (75)
Other race - Speak another language Native:
34.7% (73)Foreign-born:
42.1% (33)
Two or more races - Speak only English Native:
67.7% (857)Foreign-born:
14.9% (29)
Two or more races - Speak another language Native:
30.3% (383)Foreign-born:
83.6% (163)
White alone - Speak only English Native:
98.1% (13,622)Foreign-born:
51.9% (534)
White alone - Speak another language Native:
2.0% (280)Foreign-born:
49.4% (509)
Hispanic or Latino - Speak only English Native:
59.0% (358)Foreign-born:
14.8% (39)
Hispanic or Latino - Speak another language Native:
42.7% (259)Foreign-born:
87.6% (231)
Foreign-born residents in Lake Forest 2,161 residents are foreign born (4.7% Asia , 3.5% Europe , 1.4% Latin America ).
This city:
11.2%Illinois:
14.1%
Marital status for residents in Lake Forest Marital status - White (Caucasian) population 15 years and over
Males 32.1% Never married61.6% Now married0.6% Separated1.4% Widowed4.3% DivorcedFemales 24.4% Never married54.8% Now married0.0% Separated11.7% Widowed9.2% DivorcedWomen who gave birth in the past 12 months Now married:
100.0% (99)Unmarried:
0.0% (0)
Women who did not give birth in the past 12 months Now married:
37.9% (970)Unmarried:
62.1% (1,589)
Marital status - Black or African American population 15 years and over
Males 93.4% Never married2.9% Now married0.0% Separated3.7% Widowed0.0% DivorcedFemales 56.4% Never married36.4% Now married7.3% Separated0.0% Widowed0.0% DivorcedWomen who did not give birth in the past 12 months Now married:
18.4% (6)Unmarried:
81.6% (28)
Marital status - American Indian / Alaska Native population 15 years and over
Males 0.0% Never married100.0% Now married0.0% Separated0.0% Widowed0.0% DivorcedFemales 0.0% Never married100.0% Now married0.0% Separated0.0% Widowed0.0% DivorcedWomen who did not give birth in the past 12 months Now married:
100.0% (28)Unmarried:
0.0% (0)
Marital status - Asian population 15 years and over
Males 36.9% Never married63.1% Now married0.0% Separated0.0% Widowed0.0% DivorcedFemales 33.6% Never married43.1% Now married2.1% Separated12.0% Widowed9.2% DivorcedWomen who did not give birth in the past 12 months Now married:
41.4% (143)Unmarried:
58.6% (203)
Marital status - Other race population 15 years and over
Males 19.2% Never married75.6% Now married0.0% Separated0.0% Widowed5.1% DivorcedFemales 17.5% Never married67.0% Now married0.0% Separated15.5% Widowed0.0% DivorcedWomen who did not give birth in the past 12 months Now married:
79.3% (70)Unmarried:
20.7% (18)
Marital status - Two or more races population 15 years and over
Males 59.3% Never married35.2% Now married0.0% Separated0.0% Widowed5.5% DivorcedFemales 45.0% Never married40.4% Now married0.0% Separated1.1% Widowed13.5% DivorcedWomen who did not give birth in the past 12 months Now married:
41.2% (202)Unmarried:
58.8% (289)
Marital status - White alone, not Hispanic / Latino population 15 years and over
Males 31.9% Never married61.8% Now married0.5% Separated1.4% Widowed4.4% DivorcedFemales 23.4% Never married55.6% Now married0.0% Separated11.8% Widowed9.1% DivorcedWomen who gave birth in the past 12 months Now married:
100.0% (100)Unmarried:
0.0% (0)
Women who did not give birth in the past 12 months Now married:
39.4% (1,027)Unmarried:
60.6% (1,577)
Marital status - Hispanic or Latino population 15 years and over
Males 30.4% Never married66.4% Now married3.2% Separated0.0% Widowed0.0% DivorcedFemales 48.2% Never married30.7% Now married0.0% Separated2.5% Widowed18.5% DivorcedWomen who gave birth in the past 12 months Now married:
100.0% (6)Unmarried:
0.0% (0)
Women who did not give birth in the past 12 months Now married:
30.0% (87)Unmarried:
70.0% (203)
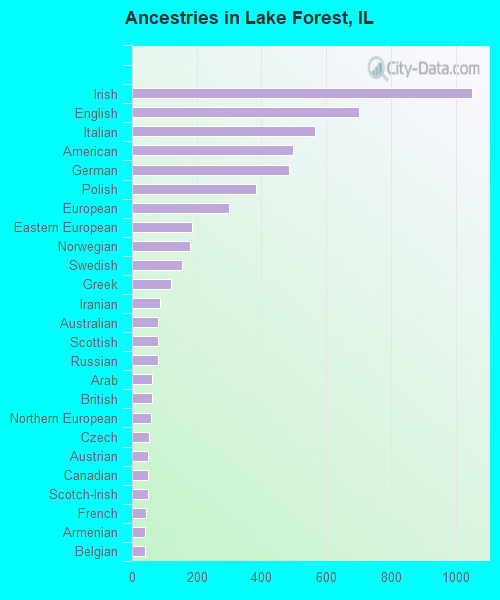
Ancestries in Lake Forest
1,051 13.8% Irish702 9.2% English566 7.4% Italian497 6.5% American486 6.4% German382 5.0% Polish300 3.9% European187 2.5% Eastern European178 2.3% Norwegian154 2.0% Swedish121 1.6% Greek86 1.1% Iranian81 1.1% Australian81 1.1% Scottish81 1.1% Russian63 0.8% Arab62 0.8% British59 0.8% Northern European53 0.7% Czech50 0.7% Austrian49 0.6% Canadian49 0.6% Scotch-Irish42 0.6% French39 0.5% Armenian39 0.5% Belgian37 0.5% Dutch31 0.4% Brazilian28 0.4% Lithuanian27 0.4% Danish25 0.3% French Canadian20 0.3% Serbian18 0.2% Haitian17 0.2% Soviet Union17 0.2% Ukrainian13 0.2% Scandinavian12 0.2% Slovak11 0.1% Croatian9 0.1% Welsh8 0.1% Hungarian8 0.1% Estonian8 0.1% Slavic4 0.05% Egyptian4 0.05% African3 0.04% Czechoslovakian3 0.04% Ugandan3 0.04% Swiss3 0.04% Jamaican2 0.03% Barbadian1 0.01% Celtic1 0.01% Kenyan
Geographical mobility in Lake Forest Same house 1 year ago 12,173 81.7% White (Caucasian)149 81.5% Black or African American164 99.7% American Indian / Alaska Native858 67.2% Asian275 91.0% Other race1,435 91.9% Two or more races12,654 81.7% White alone, not Hispanic / Latino762 83.0% Hispanic or LatinoMoved within same county 970 6.5% White / Caucasian7 3.6% Black or African American23 1.8% Asian13 4.3% Other race104 6.7% Two or more races1,031 6.7% White alone, not Hispanic / Latino39 4.3% Hispanic or LatinoMoved within same state 1,094 7.3% White / Caucasian430 33.7% Asian32 2.1% Two or more races1,065 6.9% White alone, not Hispanic / Latino70 7.6% Hispanic or LatinoMoved from different state 502 3.4% White / Caucasian17 9.2% Black or African American76 5.9% Asian7 2.2% Other race535 3.5% White alone, not Hispanic / Latino29 3.2% Hispanic or LatinoMoved from abroad 317 2.1% White9 4.7% Black or African American31 2.4% Asian8 0.5% Two or more races372 2.4% White alone, not Hispanic / Latino23 2.5% Hispanic or Latino
Children Nativity (place of birth) in Lake Forest
Children under 6 years - Living with two parents Both parents native 694 100.0% NativeBoth parents foreign-born 58 58.4% Native41 41.6% Foreign-bornOne native, one foreign-born parent 67 100.0% NativeChildren under 6 years - Living with one parent Native parent 108 100.0% NativeChildren 6 to 17 years - Living with two parents Both parents native 1,879 98.6% Native27 1.4% Foreign-bornBoth parents foreign-born 198 66.4% Native100 33.6% Foreign-bornOne native, one foreign-born parent 301 92.6% Native24 7.4% Foreign-bornChildren 6 to 17 years - Living with one parent Native parent 216 100.0% NativeForeign-born parent 72 51.8% Native67 48.2% Foreign-born