Races in Lake Mohegan, New York (NY) Detailed Stats
Data:
Races - White alone (%)
Races - White alone (% change since 2000)
Races - Black alone (%)
Races - Black alone (% change since 2000)
Races - American Indian alone (%)
Races - American Indian alone (% change since 2000)
Races - Asian alone (%)
Races - Asian alone (% change since 2000)
Races - Hispanic (%)
Races - Hispanic (% change since 2000)
Races - Native Hawaiian and Other Pacific Islander alone (%)
Races - Native Hawaiian and Other Pacific Islander alone (% change since 2000)
Races - Two or more races(%)
Races - Two or more races(% change since 2000)
Races - Other race alone (%)
Races - Other race alone (% change since 2000)
Racial diversity
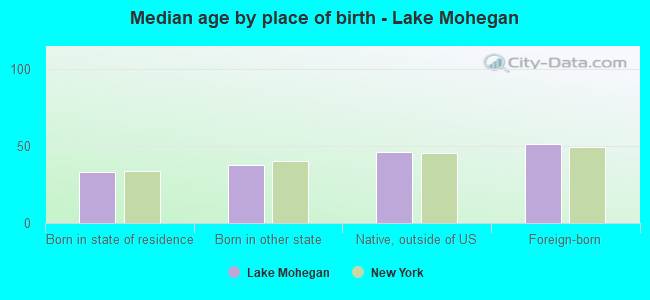
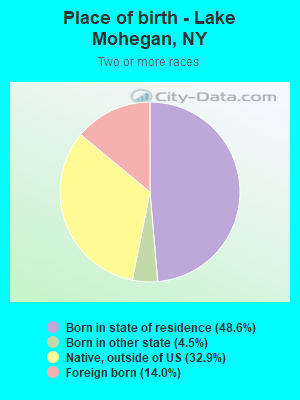
Place of birth - Born in state of residence (%)
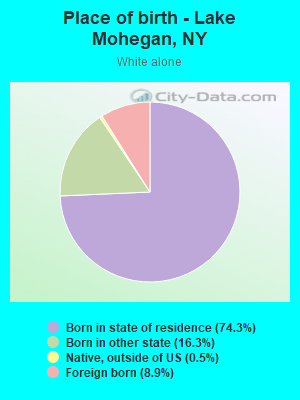
Place of birth - Born in state of residence (%) - White
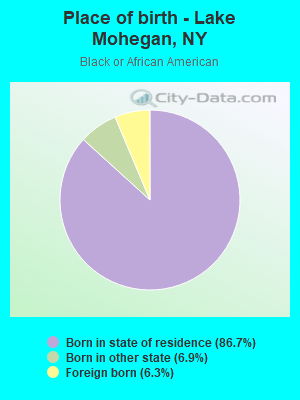
Place of birth - Born in state of residence (%) - Black or African American
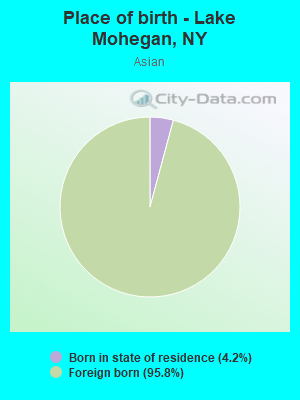
Place of birth - Born in state of residence (%) - Asian
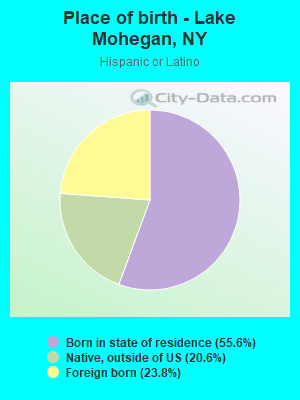
Place of birth - Born in state of residence (%) - Hispanic or Latino
Place of birth - Born in state of residence (%) - American Indian and Alaska Native
Place of birth - Born in state of residence (%) - Multirace
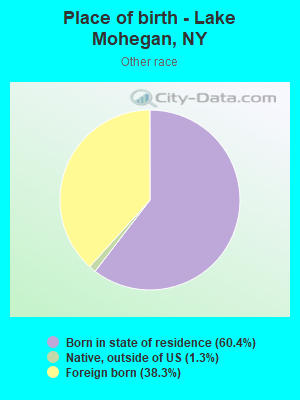
Place of birth - Born in state of residence (%) - Other Race
Place of birth - Born in other state (%)
Place of birth - Born in other state (%) - White
Place of birth - Born in other state (%) - Black or African American
Place of birth - Born in other state (%) - Asian
Place of birth - Born in other state (%) - Hispanic or Latino
Place of birth - Born in other state (%) - American Indian and Alaska Native
Place of birth - Born in other state (%) - Multirace
Place of birth - Born in other state (%) - Other Race
Place of birth - Native, outside of US (%)
Place of birth - Native, outside of US (%) - White
Place of birth - Native, outside of US (%) - Black or African American
Place of birth - Native, outside of US (%) - Asian
Place of birth - Native, outside of US (%) - Hispanic or Latino
Place of birth - Native, outside of US (%) - American Indian and Alaska Native
Place of birth - Native, outside of US (%) - Multirace
Place of birth - Native, outside of US (%) - Other Race
Place of birth - Foreign born (%)
Place of birth - Foreign born (%) - White
Place of birth - Foreign born (%) - Black or African American
Place of birth - Foreign born (%) - Asian
Place of birth - Foreign born (%) - Hispanic or Latino
Place of birth - Foreign born (%) - American Indian and Alaska Native
Place of birth - Foreign born (%) - Multirace
Place of birth - Foreign born (%) - Other Race
Residents speaking English at home (%)
Residents speaking English at home - Born in the United States (%)
Residents speaking English at home - Native, born elsewhere (%)
Residents speaking English at home - Foreign born (%)
Residents speaking Spanish at home (%)
Residents speaking Spanish at home - Born in the United States (%)
Residents speaking Spanish at home - Native, born elsewhere (%)
Residents speaking Spanish at home - Foreign born (%)
Residents speaking other language at home (%)
Residents speaking other language at home - Born in the United States (%)
Residents speaking other language at home - Native, born elsewhere (%)
Residents speaking other language at home - Foreign born (%)
Marital status - Never married (%)
Marital status - Now married (%)
Marital status - Separated (%)
Marital status - Widowed (%)
Marital status - Divorced (%)
Ancestries Reported - Arab (%)
Ancestries Reported - Czech (%)
Ancestries Reported - Danish (%)
Ancestries Reported - Dutch (%)
Ancestries Reported - English (%)
Ancestries Reported - French (%)
Ancestries Reported - French Canadian (%)
Ancestries Reported - German (%)
Ancestries Reported - Greek (%)
Ancestries Reported - Hungarian (%)
Ancestries Reported - Irish (%)
Ancestries Reported - Italian (%)
Ancestries Reported - Lithuanian (%)
Ancestries Reported - Norwegian (%)
Ancestries Reported - Polish (%)
Ancestries Reported - Portuguese (%)
Ancestries Reported - Russian (%)
Ancestries Reported - Scotch-Irish (%)
Ancestries Reported - Scottish (%)
Ancestries Reported - Slovak (%)
Ancestries Reported - Subsaharan African (%)
Ancestries Reported - Swedish (%)
Ancestries Reported - Swiss (%)
Ancestries Reported - Ukrainian (%)
Ancestries Reported - United States (%)
Ancestries Reported - Welsh (%)
Ancestries Reported - West Indian (%)
Ancestries Reported - Other (%)
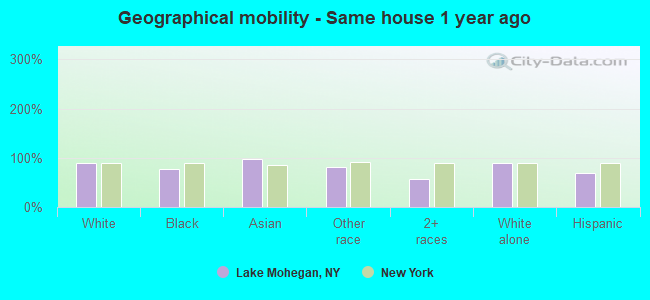
Geographical mobility - Same house 1 year ago (%)
Geographical mobility - Same house 1 year ago (%) - White
Geographical mobility - Same house 1 year ago (%) - Black or African American
Geographical mobility - Same house 1 year ago (%) - Asian
Geographical mobility - Same house 1 year ago (%) - Hispanic or Latino
Geographical mobility - Same house 1 year ago (%) - American Indian and Alaska Native
Geographical mobility - Same house 1 year ago (%) - Multirace
Geographical mobility - Same house 1 year ago (%) - Other Race
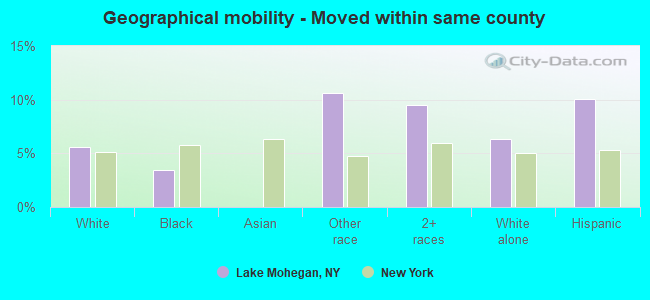
Geographical mobility - Moved within same county (%)
Geographical mobility - Moved within same county (%) - White
Geographical mobility - Moved within same county (%) - Black or African American
Geographical mobility - Moved within same county (%) - Asian
Geographical mobility - Moved within same county (%) - Hispanic or Latino
Geographical mobility - Moved within same county (%) - American Indian and Alaska Native
Geographical mobility - Moved within same county (%) - Multirace
Geographical mobility - Moved within same county (%) - Other Race
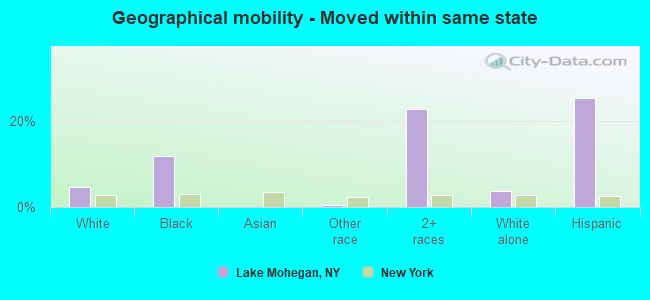
Geographical mobility - Moved from different county within same state (%)
Geographical mobility - Moved from different county within same state (%) - White
Geographical mobility - Moved from different county within same state (%) - Black or African American
Geographical mobility - Moved from different county within same state (%) - Asian
Geographical mobility - Moved from different county within same state (%) - Hispanic or Latino
Geographical mobility - Moved from different county within same state (%) - American Indian and Alaska Native
Geographical mobility - Moved from different county within same state (%) - Multirace
Geographical mobility - Moved from different county within same state (%) - Other Race
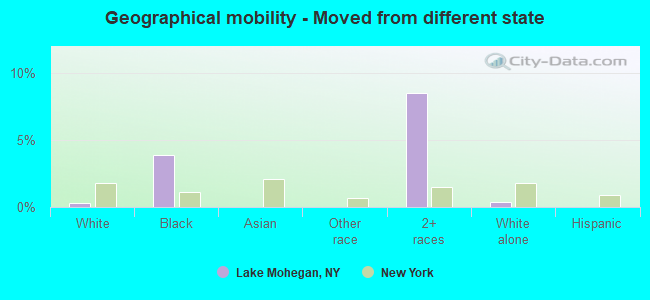
Geographical mobility - Moved from different state (%)
Geographical mobility - Moved from different state (%) - White
Geographical mobility - Moved from different state (%) - Black or African American
Geographical mobility - Moved from different state (%) - Asian
Geographical mobility - Moved from different state (%) - Hispanic or Latino
Geographical mobility - Moved from different state (%) - American Indian and Alaska Native
Geographical mobility - Moved from different state (%) - Multirace
Geographical mobility - Moved from different state (%) - Other Race
Geographical mobility - Moved from abroad (%)
Geographical mobility - Moved from abroad (%) - White
Geographical mobility - Moved from abroad (%) - Black or African American
Geographical mobility - Moved from abroad (%) - Asian
Geographical mobility - Moved from abroad (%) - Hispanic or Latino
Geographical mobility - Moved from abroad (%) - American Indian and Alaska Native
Geographical mobility - Moved from abroad (%) - Multirace
Geographical mobility - Moved from abroad (%) - Other Race
Place of birth for the foreign-born population - Ireland (%)
Place of birth for the foreign-born population - Denmark (%)
Place of birth for the foreign-born population - Norway (%)
Place of birth for the foreign-born population - Sweden (%)
Place of birth for the foreign-born population - United Kingdom (%)
Place of birth for the foreign-born population - England (%)
Place of birth for the foreign-born population - Scotland (%)
Place of birth for the foreign-born population - Other Northern Europe (%)
Place of birth for the foreign-born population - Austria (%)
Place of birth for the foreign-born population - Belgium (%)
Place of birth for the foreign-born population - France (%)
Place of birth for the foreign-born population - Germany (%)
Place of birth for the foreign-born population - Netherlands (%)
Place of birth for the foreign-born population - Switzerland (%)
Place of birth for the foreign-born population - Other Western Europe (%)
Place of birth for the foreign-born population - Greece (%)
Place of birth for the foreign-born population - Italy (%)
Place of birth for the foreign-born population - Portugal (%)
Place of birth for the foreign-born population - Spain (%)
Place of birth for the foreign-born population - Other Southern Europe (%)
Place of birth for the foreign-born population - Albania (%)
Place of birth for the foreign-born population - Belarus (%)
Place of birth for the foreign-born population - Bosnia and Herzegovina (%)
Place of birth for the foreign-born population - Bulgaria (%)
Place of birth for the foreign-born population - Croatia (%)
Place of birth for the foreign-born population - Czechoslovakia (%)
Place of birth for the foreign-born population - Hungary (%)
Place of birth for the foreign-born population - Latvia (%)
Place of birth for the foreign-born population - Lithuania (%)
Place of birth for the foreign-born population - North Macedonia (Macedonia) (%)
Place of birth for the foreign-born population - Moldova (%)
Place of birth for the foreign-born population - Poland (%)
Place of birth for the foreign-born population - Romania (%)
Place of birth for the foreign-born population - Russia (%)
Place of birth for the foreign-born population - Serbia (%)
Place of birth for the foreign-born population - Ukraine (%)
Place of birth for the foreign-born population - Other Eastern Europe (%)
Place of birth for the foreign-born population - China (%)
Place of birth for the foreign-born population - Hong Kong (%)
Place of birth for the foreign-born population - Taiwan (%)
Place of birth for the foreign-born population - Japan (%)
Place of birth for the foreign-born population - Korea (%)
Place of birth for the foreign-born population - Other Eastern Asia (%)
Place of birth for the foreign-born population - Afghanistan (%)
Place of birth for the foreign-born population - Bangladesh (%)
Place of birth for the foreign-born population - India (%)
Place of birth for the foreign-born population - Iran (%)
Place of birth for the foreign-born population - Kazakhstan (%)
Place of birth for the foreign-born population - Nepal (%)
Place of birth for the foreign-born population - Pakistan (%)
Place of birth for the foreign-born population - Sri Lanka (%)
Place of birth for the foreign-born population - Uzbekistan (%)
Place of birth for the foreign-born population - Other South Central Asia (%)
Place of birth for the foreign-born population - Burma (%)
Place of birth for the foreign-born population - Cambodia (%)
Place of birth for the foreign-born population - Indonesia (%)
Place of birth for the foreign-born population - Laos (%)
Place of birth for the foreign-born population - Malaysia (%)
Place of birth for the foreign-born population - Philippines (%)
Place of birth for the foreign-born population - Singapore (%)
Place of birth for the foreign-born population - Thailand (%)
Place of birth for the foreign-born population - Vietnam (%)
Place of birth for the foreign-born population - Other South Eastern Asia (%)
Place of birth for the foreign-born population - Armenia (%)
Place of birth for the foreign-born population - Iraq (%)
Place of birth for the foreign-born population - Israel (%)
Place of birth for the foreign-born population - Jordan (%)
Place of birth for the foreign-born population - Kuwait (%)
Place of birth for the foreign-born population - Lebanon (%)
Place of birth for the foreign-born population - Saudi Arabia (%)
Place of birth for the foreign-born population - Syria (%)
Place of birth for the foreign-born population - Turkey (%)
Place of birth for the foreign-born population - Yemen (%)
Place of birth for the foreign-born population - Other Western Asia (%)
Place of birth for the foreign-born population - Eritrea (%)
Place of birth for the foreign-born population - Ethiopia (%)
Place of birth for the foreign-born population - Kenya (%)
Place of birth for the foreign-born population - Somalia (%)
Place of birth for the foreign-born population - Uganda (%)
Place of birth for the foreign-born population - Zimbabwe (%)
Place of birth for the foreign-born population - Other Eastern Africa (%)
Place of birth for the foreign-born population - Cameroon (%)
Place of birth for the foreign-born population - Congo (%)
Place of birth for the foreign-born population - Democratic Republic of Congo (Zaire) (%)
Place of birth for the foreign-born population - Other Middle Africa (%)
Place of birth for the foreign-born population - Egypt (%)
Place of birth for the foreign-born population - Morocco (%)
Place of birth for the foreign-born population - Sudan (%)
Place of birth for the foreign-born population - Other Northern Africa (%)
Place of birth for the foreign-born population - South Africa (%)
Place of birth for the foreign-born population - Other Southern Africa (%)
Place of birth for the foreign-born population - Cabo Verde (%)
Place of birth for the foreign-born population - Ghana (%)
Place of birth for the foreign-born population - Liberia (%)
Place of birth for the foreign-born population - Nigeria (%)
Place of birth for the foreign-born population - Senegal (%)
Place of birth for the foreign-born population - Sierra Leone (%)
Place of birth for the foreign-born population - Other Western Africa (%)
Place of birth for the foreign-born population - Australia (%)
Place of birth for the foreign-born population - New Zealand (%)
Place of birth for the foreign-born population - Fiji (%)
Place of birth for the foreign-born population - Micronesia (%)
Place of birth for the foreign-born population - Bahamas (%)
Place of birth for the foreign-born population - Barbados (%)
Place of birth for the foreign-born population - Cuba (%)
Place of birth for the foreign-born population - Dominica (%)
Place of birth for the foreign-born population - Dominican Republic (%)
Place of birth for the foreign-born population - Grenada (%)
Place of birth for the foreign-born population - Haiti (%)
Place of birth for the foreign-born population - Jamaica (%)
Place of birth for the foreign-born population - St. Vincent and the Grenadines (%)
Place of birth for the foreign-born population - Trinidad and Tobago (%)
Place of birth for the foreign-born population - West Indies (%)
Place of birth for the foreign-born population - Other Caribbean (%)
Place of birth for the foreign-born population - Belize (%)
Place of birth for the foreign-born population - Costa Rica (%)
Place of birth for the foreign-born population - El Salvador (%)
Place of birth for the foreign-born population - Guatemala (%)
Place of birth for the foreign-born population - Honduras (%)
Place of birth for the foreign-born population - Mexico (%)
Place of birth for the foreign-born population - Nicaragua (%)
Place of birth for the foreign-born population - Panama (%)
Place of birth for the foreign-born population - Other Central America (%)
Place of birth for the foreign-born population - Argentina (%)
Place of birth for the foreign-born population - Bolivia (%)
Place of birth for the foreign-born population - Brazil (%)
Place of birth for the foreign-born population - Chile (%)
Place of birth for the foreign-born population - Colombia (%)
Place of birth for the foreign-born population - Ecuador (%)
Place of birth for the foreign-born population - Guyana (%)
Place of birth for the foreign-born population - Peru (%)
Place of birth for the foreign-born population - Uruguay (%)
Place of birth for the foreign-born population - Venezuela (%)
Place of birth for the foreign-born population - Other South America (%)
Place of birth for the foreign-born population - Canada (%)
Place of birth for the foreign-born population - Other Northern America (%)
Place of birth for the foreign-born population - Other (%)
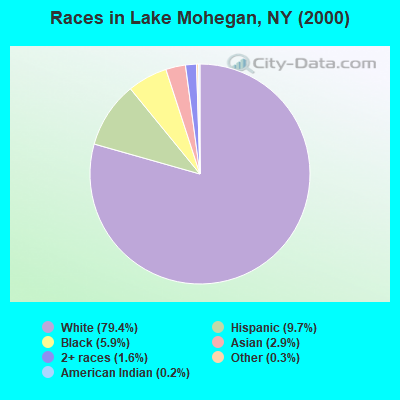
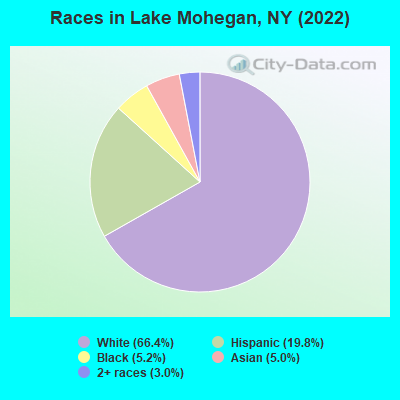
According to 2022 data, the most numerous races in Lake Mohegan, NY are White alone (3,912 residents), Hispanic (1,165 residents), and Black alone (304 residents). 74.4% of Lake Mohegan residents speak English at home. 16.7% of Lake Mohegan, NY residents are foreign-born (5.6% born in Europe, 5.0% born in Asia, 4.9% born in Latin America), which is 31.4% less than the foreign-born rate of 22.0% across the entire state of New York.
Race distribution in Lake Mohegan
2000 2022
11,760,981 62.0% White alone 2,867,583 15.1% Hispanic 2,812,623 14.8% Black alone 1,035,926 5.5% Asian alone 366,116 1.9% Two or more races 75,499 0.4% Other race alone 52,499 0.3% American Indian alone 5,230 0.03% Native Hawaiian and Other
10,408,933 52.9% White alone 3,867,299 19.7% Hispanic 2,633,840 13.4% Black alone 1,776,286 9.0% Asian alone 732,670 3.7% Two or more races 216,110 1.1% Other race alone 35,082 0.2% American Indian alone 6,931 0.04% Native Hawaiian and Other
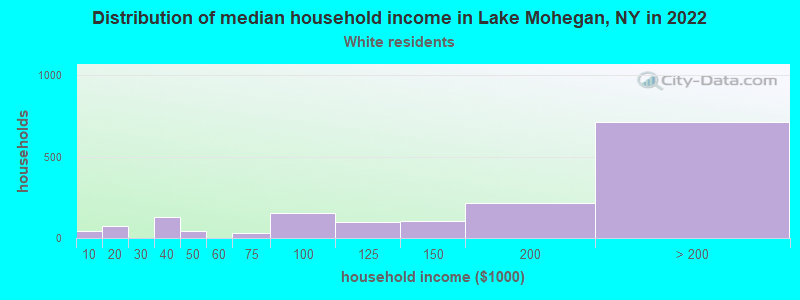
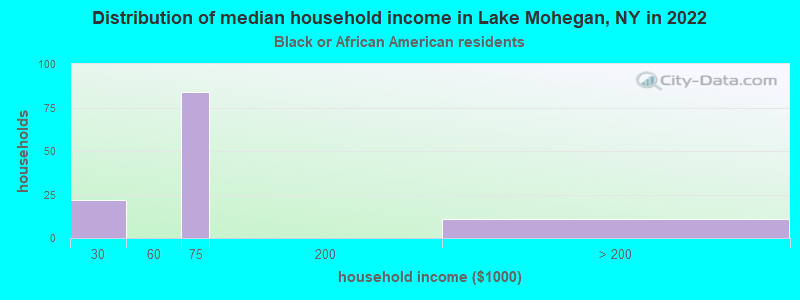
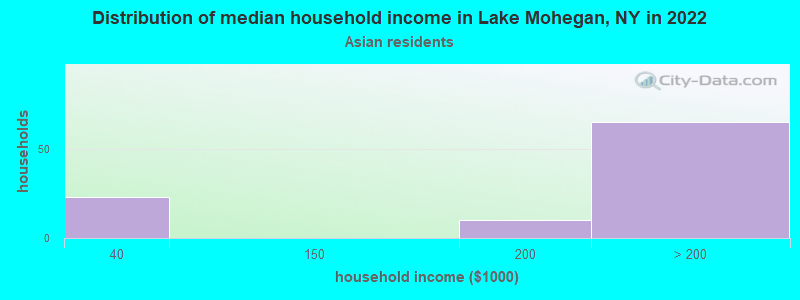
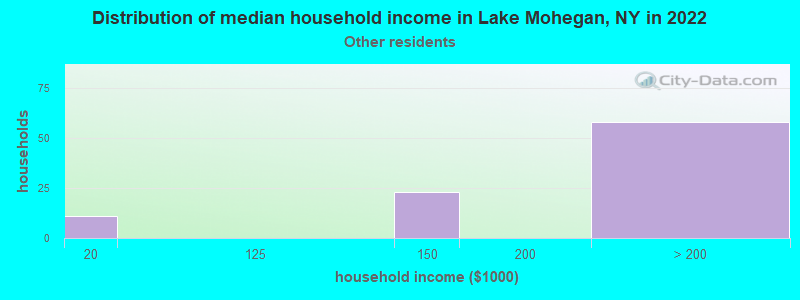
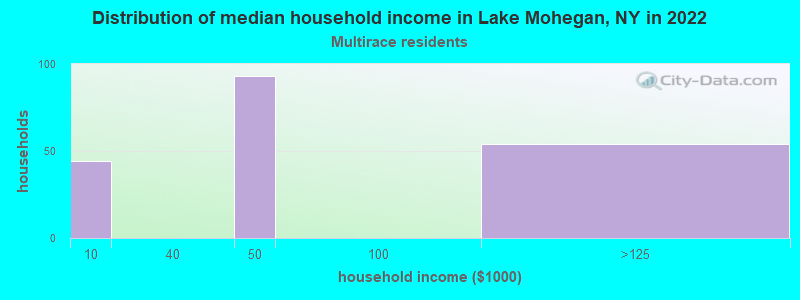
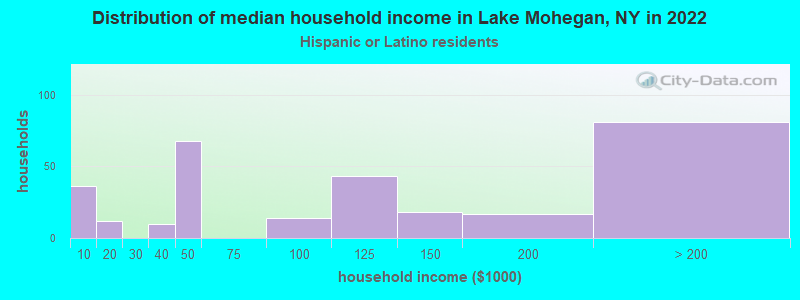
Income and house value in Lake Mohegan Median household income in 2022 $163,488 White non-Hispanic householders$53,458 Black householdersover $200,000 Asian householdersover $200,000 Some other race householders$90,563 Hispanic or Latino race householdersMedian 2022 house value $514,021 White Non-Hispanic householders$573,969 Black or African American householders over $1,000,000 Asian householders$469,124 Some other race householders$570,142 Hispanic or Latino householders
Median age by race in Lake Mohegan
38.8 Median age for White residents38.0 49.8 33.4 Median age for Black or African American residents22.8 42.8 -641,441,440.8 Median age for American Indian / Alaska Native residents-664,804,468.6 -554,999,999.4 49.0 Median age for Asian residents27.0 49.6 -487,992,314.6 Median age for Native Hawaiian / Pacific Islander residents-477,502,295.2 -666,666,666.0 44.9 Median age for Other race residents27.3 44.5 48.8 Median age for Two or more races residents50.3 17.7 38.1 Median age for White alone residents37.5 47.8 45.5 Median age for Hispanic or Latino residents33.3 45.8
Owner/renter occupied households by race in Lake Mohegan
House owners and renters - White residents 1,309 81.3% Owner occupied301 18.7% Renter occupiedHouse owners and renters - Black or African American residents 32 25.2% Owner occupied96 74.8% Renter occupiedHouse owners and renters - Asian residents 109 100.0% Owner occupiedHouse owners and renters - Other race residents 77 83.2% Owner occupied16 16.8% Renter occupiedHouse owners and renters - Two or more races residents 88 53.5% Owner occupied77 46.5% Renter occupiedHouse owners and renters - White alone residents 1,236 78.9% Owner occupied331 21.1% Renter occupiedHouse owners and renters - Hispanic or Latino residents 270 89.7% Owner occupied31 10.3% Renter occupied
Language usage in Lake Mohegan
English speakers - Total 74.4% of residents of Lake Mohegan speak English at home.
17.5% of residents speak Spanish at home 808 83.0% Speak English very well165 17.0% Speak English less than very well8.3% of residents speak other language at home 458 99.6% Speak English very well2 0.4% Speak English less than very well
English speakers - Born in the United States 93.5% of residents of Lake Mohegan speak English at home.
7.7% of residents speak other language at home 53 100.0% Speak English very well
English speakers - Native, born elsewhere 14.4% of residents of Lake Mohegan speak English at home.
101.3% of residents speak Spanish at home 183 78.9% Speak English very well49 21.1% Speak English less than very well
English speakers - Foreign-born 42.4% of residents of Lake Mohegan speak English at home.
26.9% of residents speak Spanish at home 175 65.1% Speak English very well94 34.9% Speak English less than very well32.4% of residents speak other language at home 322 99.4% Speak English very well2 0.6% Speak English less than very well
White (Caucasian) - Speak only English Native:
93.2% (3,173)Foreign-born:
100.0% (354)
White (Caucasian) - Speak another language Native:
7.2% (247)Foreign-born:
20.3% (72)
Black or African American - Speak another language Native:
7.7% (24)Foreign-born:
92.9% (19)
Asian - Speak another language Native:
100.0% (12)Foreign-born:
98.8% (291)
Other race - Speak only English Native:
22.0% (52)Foreign-born:
17.6% (25)
Other race - Speak another language Native:
78.8% (186)Foreign-born:
85.1% (119)
Two or more races - Speak another language Native:
66.8% (402)Foreign-born:
100.0% (112)
White alone - Speak only English Native:
96.7% (3,178)Foreign-born:
100.0% (351)
White alone - Speak another language Native:
3.7% (121)Foreign-born:
7.1% (25)
Hispanic or Latino - Speak only English Native:
20.8% (184)Foreign-born:
7.0% (20)
Hispanic or Latino - Speak another language Native:
81.3% (720)Foreign-born:
92.9% (269)
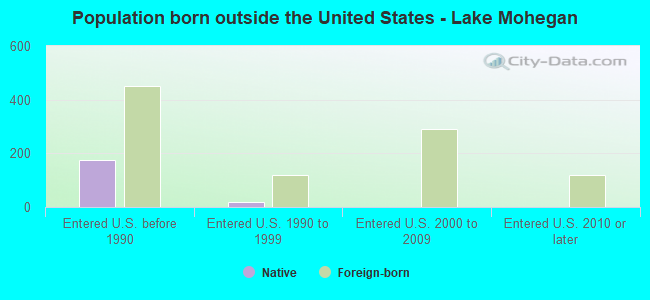
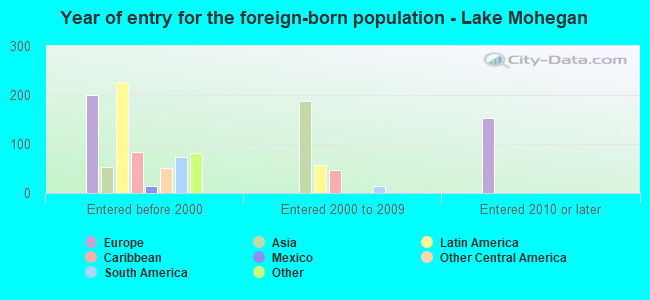
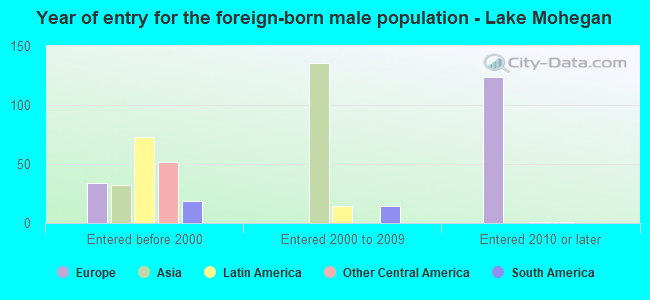
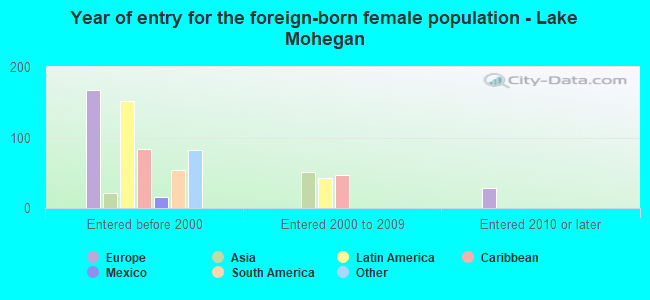
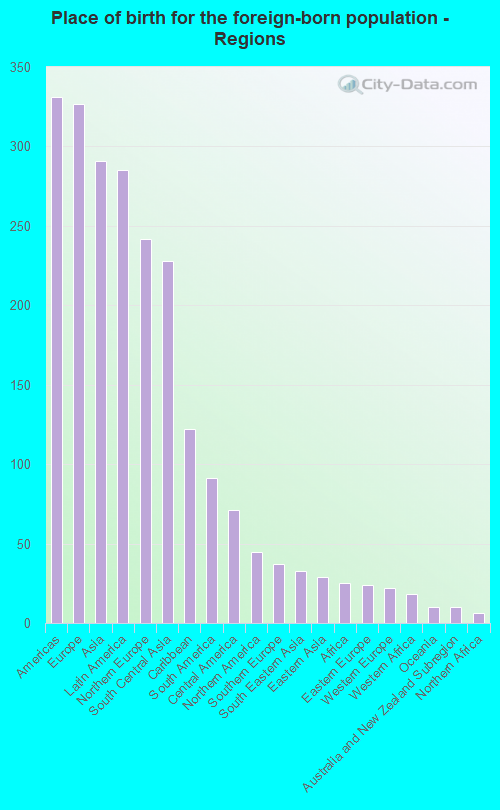
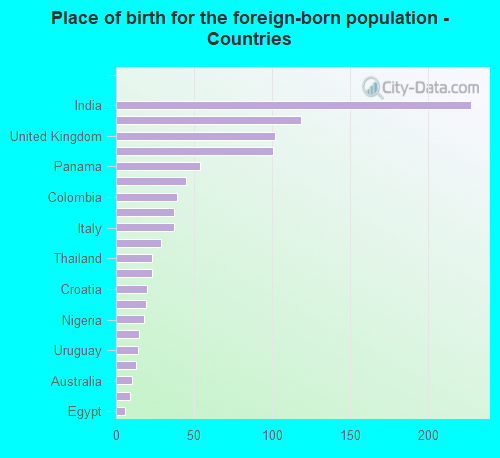
Foreign-born residents in Lake Mohegan 987 residents are foreign born (5.6% Europe , 5.0% Asia , 4.9% Latin America ).
This city:
16.7%New York:
22.6%
Marital status for residents in Lake Mohegan Marital status - White (Caucasian) population 15 years and over
Males 36.3% Never married56.5% Now married0.0% Separated2.3% Widowed4.9% DivorcedFemales 23.6% Never married52.2% Now married0.6% Separated11.7% Widowed11.9% DivorcedWomen who gave birth in the past 12 months Now married:
100.0% (63)Unmarried:
0.0% (0)
Women who did not give birth in the past 12 months Now married:
39.2% (323)Unmarried:
60.8% (501)
Marital status - Black or African American population 15 years and over
Males 67.4% Never married32.6% Now married0.0% Separated0.0% Widowed0.0% DivorcedFemales 37.9% Never married6.3% Now married0.0% Separated46.6% Widowed9.2% DivorcedWomen who did not give birth in the past 12 months Now married:
7.1% (13)Unmarried:
92.9% (166)
Marital status - Asian population 15 years and over
Males 63.4% Never married36.6% Now married0.0% Separated0.0% Widowed0.0% DivorcedFemales 0.0% Never married76.9% Now married13.2% Separated9.9% Widowed0.0% DivorcedWomen who did not give birth in the past 12 months Now married:
86.4% (56)Unmarried:
13.6% (9)
Marital status - Other race population 15 years and over
Males 43.6% Never married56.4% Now married0.0% Separated0.0% Widowed0.0% DivorcedFemales 3.1% Never married79.4% Now married0.0% Separated3.1% Widowed14.4% DivorcedWomen who did not give birth in the past 12 months Now married:
100.0% (50)Unmarried:
0.0% (0)
Marital status - Two or more races population 15 years and over
Males 82.1% Never married1.3% Now married0.0% Separated0.0% Widowed16.6% DivorcedFemales 57.0% Never married20.6% Now married0.0% Separated0.0% Widowed22.4% DivorcedWomen who did not give birth in the past 12 months Now married:
16.8% (24)Unmarried:
83.2% (119)
Marital status - White alone, not Hispanic / Latino population 15 years and over
Males 35.1% Never married57.1% Now married0.0% Separated2.4% Widowed5.3% DivorcedFemales 23.6% Never married53.2% Now married0.7% Separated11.9% Widowed10.6% DivorcedWomen who gave birth in the past 12 months Now married:
100.0% (67)Unmarried:
0.0% (0)
Women who did not give birth in the past 12 months Now married:
39.1% (322)Unmarried:
60.9% (502)
Marital status - Hispanic or Latino population 15 years and over
Males 59.6% Never married32.4% Now married0.0% Separated0.0% Widowed8.0% DivorcedFemales 33.1% Never married45.5% Now married3.0% Separated3.8% Widowed14.6% DivorcedWomen who did not give birth in the past 12 months Now married:
43.6% (99)Unmarried:
56.4% (128)
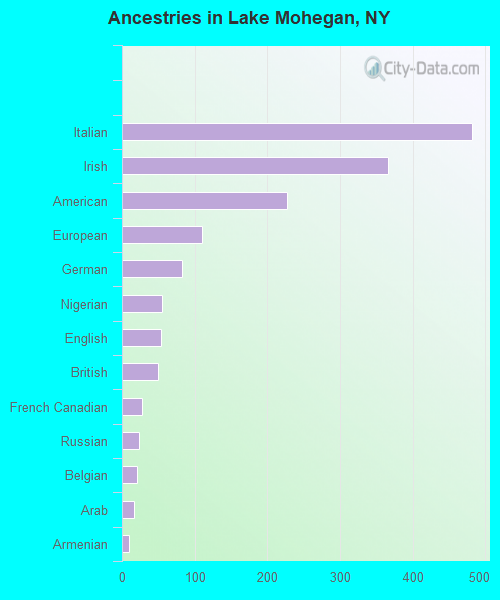
Ancestries in Lake Mohegan
481 18.2% Italian366 13.8% Irish227 8.6% American110 4.2% European82 3.1% German55 2.1% Nigerian53 2.0% English49 1.9% British27 1.0% French Canadian23 0.9% Russian20 0.8% Belgian16 0.6% Arab9 0.3% Armenian
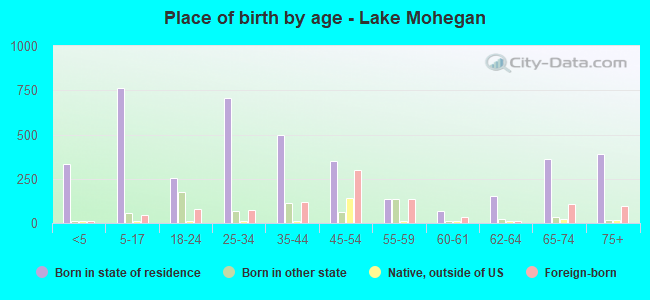
Children Nativity (place of birth) in Lake Mohegan
Children under 6 years - Living with two parents Both parents native 319 100.0% NativeChildren under 6 years - Living with one parent Native parent 30 100.0% NativeChildren 6 to 17 years - Living with two parents Both parents native 278 100.0% NativeBoth parents foreign-born 101 75.0% Native34 25.0% Foreign-bornOne native, one foreign-born parent 109 100.0% NativeChildren 6 to 17 years - Living with one parent Native parent 188 100.0% NativeForeign-born parent 119 51.2% Native113 48.8% Foreign-born
Grandparents responsible for own grandchildren in Lake Mohegan
Grandparents (30 to 59 years) White / Caucasian 13 100.0% Not responsible for grandchildrenWhite alone, not Hispanic / Latino 22 100.0% Not responsible for grandchildren
Grandparents (60 years and over) White / Caucasian 14 100.0% Not responsible for grandchildrenWhite alone, not Hispanic / Latino 15 100.0% Not responsible for grandchildren