Races in Lake Monticello, Virginia (VA) Detailed Stats
Data:
Races - White alone (%)
Races - White alone (% change since 2000)
Races - Black alone (%)
Races - Black alone (% change since 2000)
Races - American Indian alone (%)
Races - American Indian alone (% change since 2000)
Races - Asian alone (%)
Races - Asian alone (% change since 2000)
Races - Hispanic (%)
Races - Hispanic (% change since 2000)
Races - Native Hawaiian and Other Pacific Islander alone (%)
Races - Native Hawaiian and Other Pacific Islander alone (% change since 2000)
Races - Two or more races(%)
Races - Two or more races(% change since 2000)
Races - Other race alone (%)
Races - Other race alone (% change since 2000)
Racial diversity
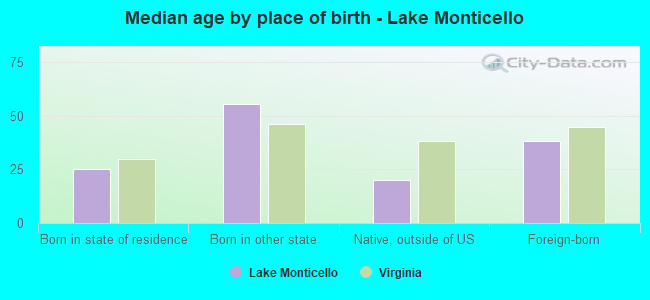
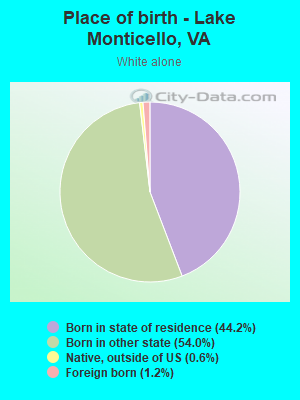
Place of birth - Born in state of residence (%)
Place of birth - Born in state of residence (%) - White
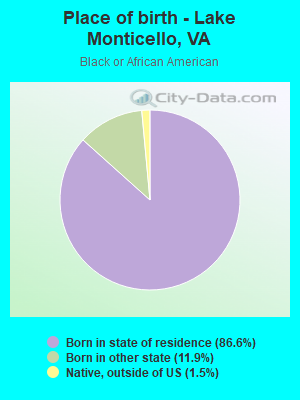
Place of birth - Born in state of residence (%) - Black or African American
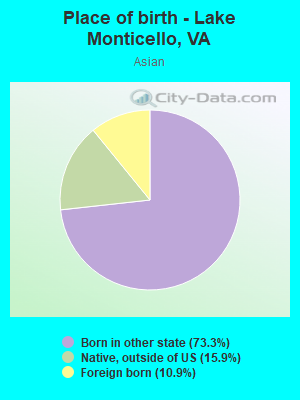
Place of birth - Born in state of residence (%) - Asian
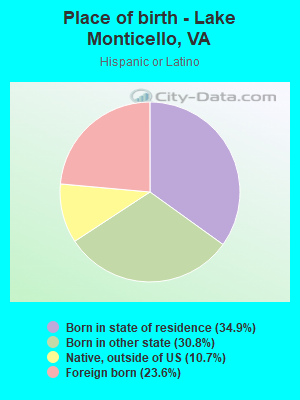
Place of birth - Born in state of residence (%) - Hispanic or Latino
Place of birth - Born in state of residence (%) - American Indian and Alaska Native
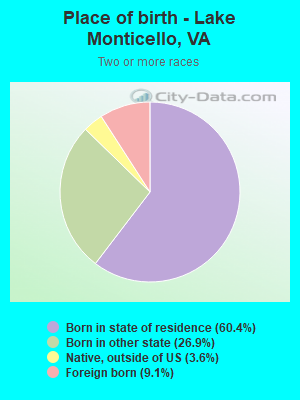
Place of birth - Born in state of residence (%) - Multirace
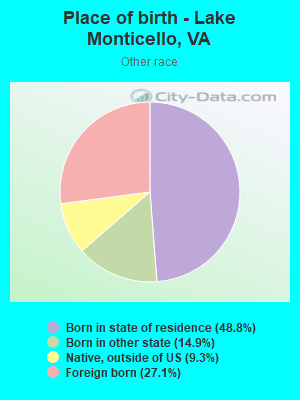
Place of birth - Born in state of residence (%) - Other Race
Place of birth - Born in other state (%)
Place of birth - Born in other state (%) - White
Place of birth - Born in other state (%) - Black or African American
Place of birth - Born in other state (%) - Asian
Place of birth - Born in other state (%) - Hispanic or Latino
Place of birth - Born in other state (%) - American Indian and Alaska Native
Place of birth - Born in other state (%) - Multirace
Place of birth - Born in other state (%) - Other Race
Place of birth - Native, outside of US (%)
Place of birth - Native, outside of US (%) - White
Place of birth - Native, outside of US (%) - Black or African American
Place of birth - Native, outside of US (%) - Asian
Place of birth - Native, outside of US (%) - Hispanic or Latino
Place of birth - Native, outside of US (%) - American Indian and Alaska Native
Place of birth - Native, outside of US (%) - Multirace
Place of birth - Native, outside of US (%) - Other Race
Place of birth - Foreign born (%)
Place of birth - Foreign born (%) - White
Place of birth - Foreign born (%) - Black or African American
Place of birth - Foreign born (%) - Asian
Place of birth - Foreign born (%) - Hispanic or Latino
Place of birth - Foreign born (%) - American Indian and Alaska Native
Place of birth - Foreign born (%) - Multirace
Place of birth - Foreign born (%) - Other Race
Residents speaking English at home (%)
Residents speaking English at home - Born in the United States (%)
Residents speaking English at home - Native, born elsewhere (%)
Residents speaking English at home - Foreign born (%)
Residents speaking Spanish at home (%)
Residents speaking Spanish at home - Born in the United States (%)
Residents speaking Spanish at home - Native, born elsewhere (%)
Residents speaking Spanish at home - Foreign born (%)
Residents speaking other language at home (%)
Residents speaking other language at home - Born in the United States (%)
Residents speaking other language at home - Native, born elsewhere (%)
Residents speaking other language at home - Foreign born (%)
Marital status - Never married (%)
Marital status - Now married (%)
Marital status - Separated (%)
Marital status - Widowed (%)
Marital status - Divorced (%)
Ancestries Reported - Arab (%)
Ancestries Reported - Czech (%)
Ancestries Reported - Danish (%)
Ancestries Reported - Dutch (%)
Ancestries Reported - English (%)
Ancestries Reported - French (%)
Ancestries Reported - French Canadian (%)
Ancestries Reported - German (%)
Ancestries Reported - Greek (%)
Ancestries Reported - Hungarian (%)
Ancestries Reported - Irish (%)
Ancestries Reported - Italian (%)
Ancestries Reported - Lithuanian (%)
Ancestries Reported - Norwegian (%)
Ancestries Reported - Polish (%)
Ancestries Reported - Portuguese (%)
Ancestries Reported - Russian (%)
Ancestries Reported - Scotch-Irish (%)
Ancestries Reported - Scottish (%)
Ancestries Reported - Slovak (%)
Ancestries Reported - Subsaharan African (%)
Ancestries Reported - Swedish (%)
Ancestries Reported - Swiss (%)
Ancestries Reported - Ukrainian (%)
Ancestries Reported - United States (%)
Ancestries Reported - Welsh (%)
Ancestries Reported - West Indian (%)
Ancestries Reported - Other (%)
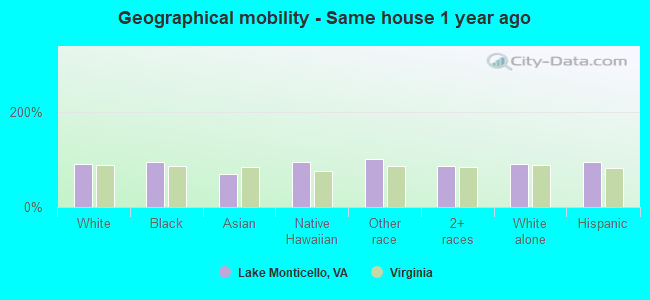
Geographical mobility - Same house 1 year ago (%)
Geographical mobility - Same house 1 year ago (%) - White
Geographical mobility - Same house 1 year ago (%) - Black or African American
Geographical mobility - Same house 1 year ago (%) - Asian
Geographical mobility - Same house 1 year ago (%) - Hispanic or Latino
Geographical mobility - Same house 1 year ago (%) - American Indian and Alaska Native
Geographical mobility - Same house 1 year ago (%) - Multirace
Geographical mobility - Same house 1 year ago (%) - Other Race
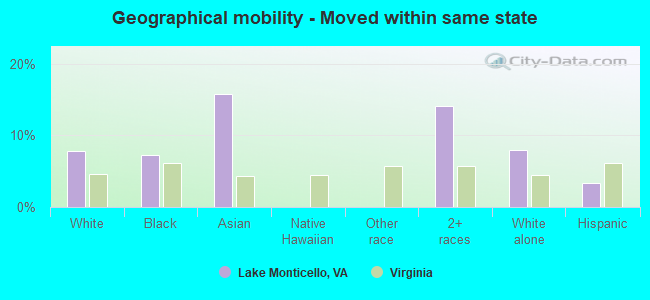
Geographical mobility - Moved within same county (%)
Geographical mobility - Moved within same county (%) - White
Geographical mobility - Moved within same county (%) - Black or African American
Geographical mobility - Moved within same county (%) - Asian
Geographical mobility - Moved within same county (%) - Hispanic or Latino
Geographical mobility - Moved within same county (%) - American Indian and Alaska Native
Geographical mobility - Moved within same county (%) - Multirace
Geographical mobility - Moved within same county (%) - Other Race
Geographical mobility - Moved from different county within same state (%)
Geographical mobility - Moved from different county within same state (%) - White
Geographical mobility - Moved from different county within same state (%) - Black or African American
Geographical mobility - Moved from different county within same state (%) - Asian
Geographical mobility - Moved from different county within same state (%) - Hispanic or Latino
Geographical mobility - Moved from different county within same state (%) - American Indian and Alaska Native
Geographical mobility - Moved from different county within same state (%) - Multirace
Geographical mobility - Moved from different county within same state (%) - Other Race
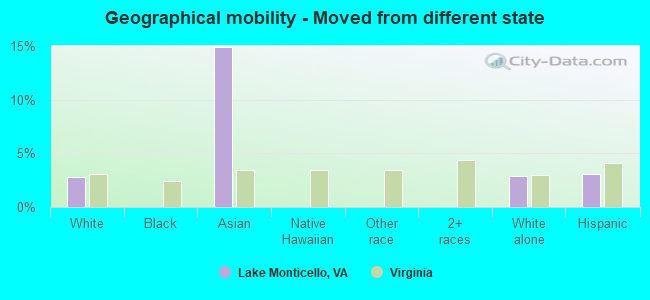
Geographical mobility - Moved from different state (%)
Geographical mobility - Moved from different state (%) - White
Geographical mobility - Moved from different state (%) - Black or African American
Geographical mobility - Moved from different state (%) - Asian
Geographical mobility - Moved from different state (%) - Hispanic or Latino
Geographical mobility - Moved from different state (%) - American Indian and Alaska Native
Geographical mobility - Moved from different state (%) - Multirace
Geographical mobility - Moved from different state (%) - Other Race
Geographical mobility - Moved from abroad (%)
Geographical mobility - Moved from abroad (%) - White
Geographical mobility - Moved from abroad (%) - Black or African American
Geographical mobility - Moved from abroad (%) - Asian
Geographical mobility - Moved from abroad (%) - Hispanic or Latino
Geographical mobility - Moved from abroad (%) - American Indian and Alaska Native
Geographical mobility - Moved from abroad (%) - Multirace
Geographical mobility - Moved from abroad (%) - Other Race
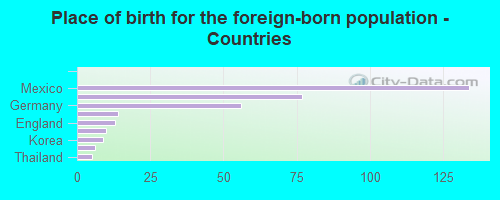
Place of birth for the foreign-born population - Ireland (%)
Place of birth for the foreign-born population - Denmark (%)
Place of birth for the foreign-born population - Norway (%)
Place of birth for the foreign-born population - Sweden (%)
Place of birth for the foreign-born population - United Kingdom (%)
Place of birth for the foreign-born population - England (%)
Place of birth for the foreign-born population - Scotland (%)
Place of birth for the foreign-born population - Other Northern Europe (%)
Place of birth for the foreign-born population - Austria (%)
Place of birth for the foreign-born population - Belgium (%)
Place of birth for the foreign-born population - France (%)
Place of birth for the foreign-born population - Germany (%)
Place of birth for the foreign-born population - Netherlands (%)
Place of birth for the foreign-born population - Switzerland (%)
Place of birth for the foreign-born population - Other Western Europe (%)
Place of birth for the foreign-born population - Greece (%)
Place of birth for the foreign-born population - Italy (%)
Place of birth for the foreign-born population - Portugal (%)
Place of birth for the foreign-born population - Spain (%)
Place of birth for the foreign-born population - Other Southern Europe (%)
Place of birth for the foreign-born population - Albania (%)
Place of birth for the foreign-born population - Belarus (%)
Place of birth for the foreign-born population - Bosnia and Herzegovina (%)
Place of birth for the foreign-born population - Bulgaria (%)
Place of birth for the foreign-born population - Croatia (%)
Place of birth for the foreign-born population - Czechoslovakia (%)
Place of birth for the foreign-born population - Hungary (%)
Place of birth for the foreign-born population - Latvia (%)
Place of birth for the foreign-born population - Lithuania (%)
Place of birth for the foreign-born population - North Macedonia (Macedonia) (%)
Place of birth for the foreign-born population - Moldova (%)
Place of birth for the foreign-born population - Poland (%)
Place of birth for the foreign-born population - Romania (%)
Place of birth for the foreign-born population - Russia (%)
Place of birth for the foreign-born population - Serbia (%)
Place of birth for the foreign-born population - Ukraine (%)
Place of birth for the foreign-born population - Other Eastern Europe (%)
Place of birth for the foreign-born population - China (%)
Place of birth for the foreign-born population - Hong Kong (%)
Place of birth for the foreign-born population - Taiwan (%)
Place of birth for the foreign-born population - Japan (%)
Place of birth for the foreign-born population - Korea (%)
Place of birth for the foreign-born population - Other Eastern Asia (%)
Place of birth for the foreign-born population - Afghanistan (%)
Place of birth for the foreign-born population - Bangladesh (%)
Place of birth for the foreign-born population - India (%)
Place of birth for the foreign-born population - Iran (%)
Place of birth for the foreign-born population - Kazakhstan (%)
Place of birth for the foreign-born population - Nepal (%)
Place of birth for the foreign-born population - Pakistan (%)
Place of birth for the foreign-born population - Sri Lanka (%)
Place of birth for the foreign-born population - Uzbekistan (%)
Place of birth for the foreign-born population - Other South Central Asia (%)
Place of birth for the foreign-born population - Burma (%)
Place of birth for the foreign-born population - Cambodia (%)
Place of birth for the foreign-born population - Indonesia (%)
Place of birth for the foreign-born population - Laos (%)
Place of birth for the foreign-born population - Malaysia (%)
Place of birth for the foreign-born population - Philippines (%)
Place of birth for the foreign-born population - Singapore (%)
Place of birth for the foreign-born population - Thailand (%)
Place of birth for the foreign-born population - Vietnam (%)
Place of birth for the foreign-born population - Other South Eastern Asia (%)
Place of birth for the foreign-born population - Armenia (%)
Place of birth for the foreign-born population - Iraq (%)
Place of birth for the foreign-born population - Israel (%)
Place of birth for the foreign-born population - Jordan (%)
Place of birth for the foreign-born population - Kuwait (%)
Place of birth for the foreign-born population - Lebanon (%)
Place of birth for the foreign-born population - Saudi Arabia (%)
Place of birth for the foreign-born population - Syria (%)
Place of birth for the foreign-born population - Turkey (%)
Place of birth for the foreign-born population - Yemen (%)
Place of birth for the foreign-born population - Other Western Asia (%)
Place of birth for the foreign-born population - Eritrea (%)
Place of birth for the foreign-born population - Ethiopia (%)
Place of birth for the foreign-born population - Kenya (%)
Place of birth for the foreign-born population - Somalia (%)
Place of birth for the foreign-born population - Uganda (%)
Place of birth for the foreign-born population - Zimbabwe (%)
Place of birth for the foreign-born population - Other Eastern Africa (%)
Place of birth for the foreign-born population - Cameroon (%)
Place of birth for the foreign-born population - Congo (%)
Place of birth for the foreign-born population - Democratic Republic of Congo (Zaire) (%)
Place of birth for the foreign-born population - Other Middle Africa (%)
Place of birth for the foreign-born population - Egypt (%)
Place of birth for the foreign-born population - Morocco (%)
Place of birth for the foreign-born population - Sudan (%)
Place of birth for the foreign-born population - Other Northern Africa (%)
Place of birth for the foreign-born population - South Africa (%)
Place of birth for the foreign-born population - Other Southern Africa (%)
Place of birth for the foreign-born population - Cabo Verde (%)
Place of birth for the foreign-born population - Ghana (%)
Place of birth for the foreign-born population - Liberia (%)
Place of birth for the foreign-born population - Nigeria (%)
Place of birth for the foreign-born population - Senegal (%)
Place of birth for the foreign-born population - Sierra Leone (%)
Place of birth for the foreign-born population - Other Western Africa (%)
Place of birth for the foreign-born population - Australia (%)
Place of birth for the foreign-born population - New Zealand (%)
Place of birth for the foreign-born population - Fiji (%)
Place of birth for the foreign-born population - Micronesia (%)
Place of birth for the foreign-born population - Bahamas (%)
Place of birth for the foreign-born population - Barbados (%)
Place of birth for the foreign-born population - Cuba (%)
Place of birth for the foreign-born population - Dominica (%)
Place of birth for the foreign-born population - Dominican Republic (%)
Place of birth for the foreign-born population - Grenada (%)
Place of birth for the foreign-born population - Haiti (%)
Place of birth for the foreign-born population - Jamaica (%)
Place of birth for the foreign-born population - St. Vincent and the Grenadines (%)
Place of birth for the foreign-born population - Trinidad and Tobago (%)
Place of birth for the foreign-born population - West Indies (%)
Place of birth for the foreign-born population - Other Caribbean (%)
Place of birth for the foreign-born population - Belize (%)
Place of birth for the foreign-born population - Costa Rica (%)
Place of birth for the foreign-born population - El Salvador (%)
Place of birth for the foreign-born population - Guatemala (%)
Place of birth for the foreign-born population - Honduras (%)
Place of birth for the foreign-born population - Mexico (%)
Place of birth for the foreign-born population - Nicaragua (%)
Place of birth for the foreign-born population - Panama (%)
Place of birth for the foreign-born population - Other Central America (%)
Place of birth for the foreign-born population - Argentina (%)
Place of birth for the foreign-born population - Bolivia (%)
Place of birth for the foreign-born population - Brazil (%)
Place of birth for the foreign-born population - Chile (%)
Place of birth for the foreign-born population - Colombia (%)
Place of birth for the foreign-born population - Ecuador (%)
Place of birth for the foreign-born population - Guyana (%)
Place of birth for the foreign-born population - Peru (%)
Place of birth for the foreign-born population - Uruguay (%)
Place of birth for the foreign-born population - Venezuela (%)
Place of birth for the foreign-born population - Other South America (%)
Place of birth for the foreign-born population - Canada (%)
Place of birth for the foreign-born population - Other Northern America (%)
Place of birth for the foreign-born population - Other (%)
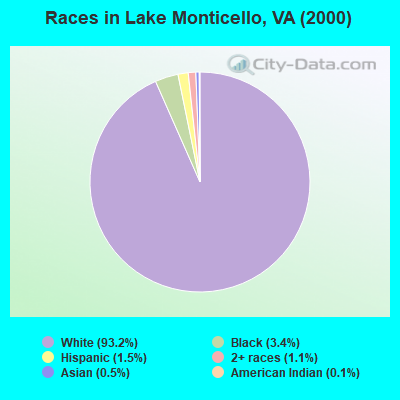
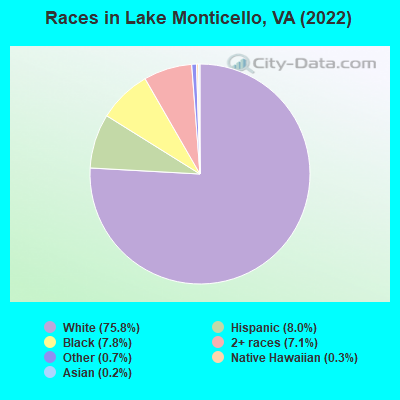
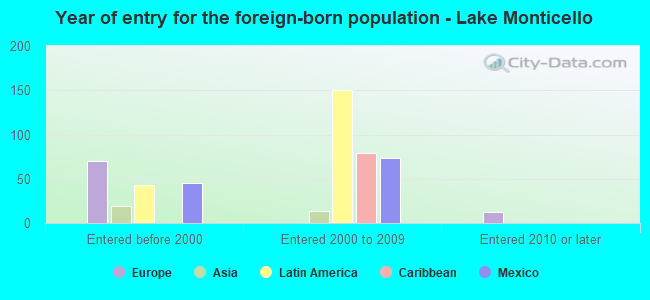
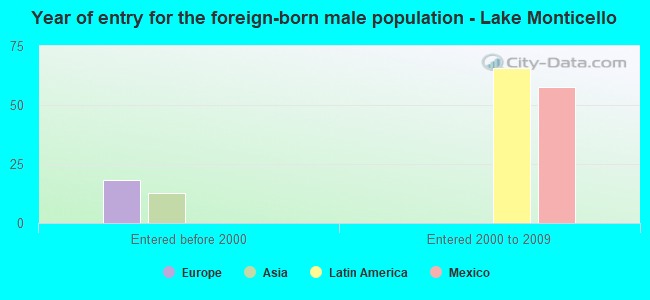
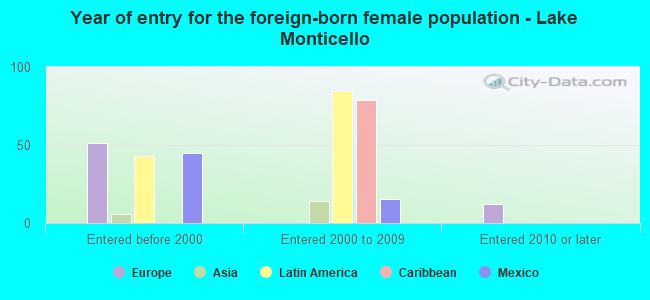
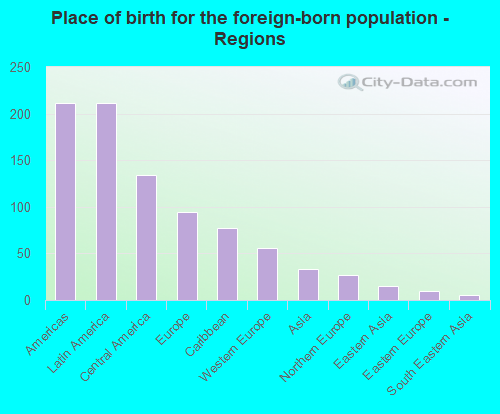
According to 2022 data, the most numerous races in Lake Monticello, VA are White alone (8,272 residents), Black alone (856 residents), and Hispanic (868 residents). 91.9% of Lake Monticello residents speak English at home. 3.1% of Lake Monticello, VA residents are foreign-born (1.9% born in Latin America, 0.9% born in Europe), which is 286.1% less than the foreign-born rate of 12.0% across the entire state of Virginia.
Race distribution in Lake Monticello
2000 2022
4,965,637 70.2% White alone 1,376,378 19.4% Black alone 329,540 4.7% Hispanic 259,277 3.7% Asian alone 114,022 1.6% Two or more races 18,596 0.3% American Indian alone 11,685 0.2% Other race alone 3,380 0.05% Native Hawaiian and Other
5,095,130 58.7% White alone 1,594,785 18.4% Black alone 905,750 10.4% Hispanic 602,881 6.9% Asian alone 406,047 4.7% Two or more races 60,419 0.7% Other race alone 11,738 0.1% American Indian alone 6,869 0.08% Native Hawaiian and Other
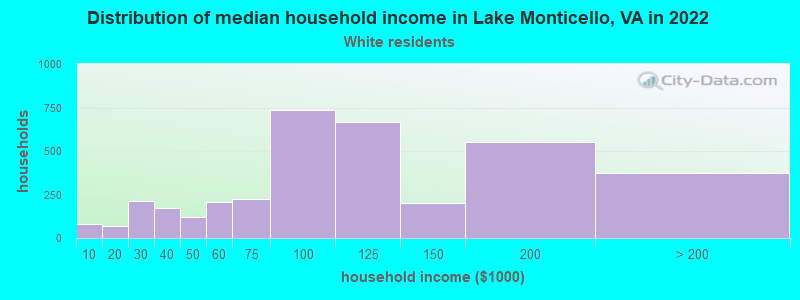
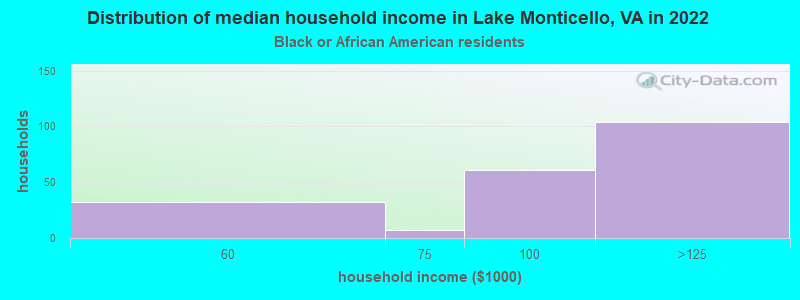
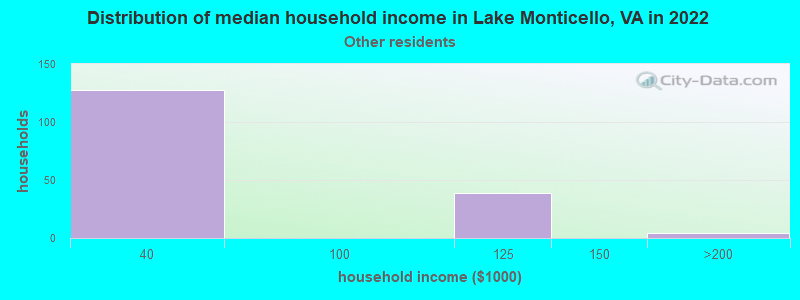
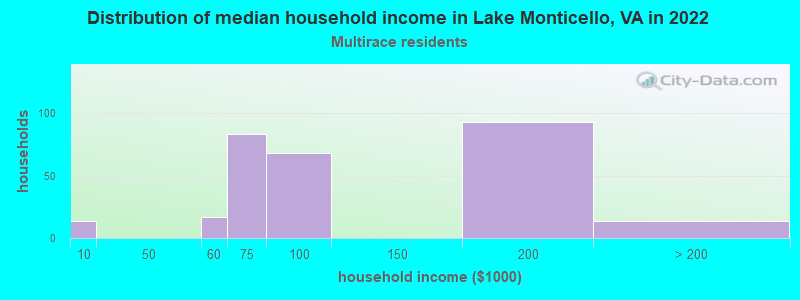
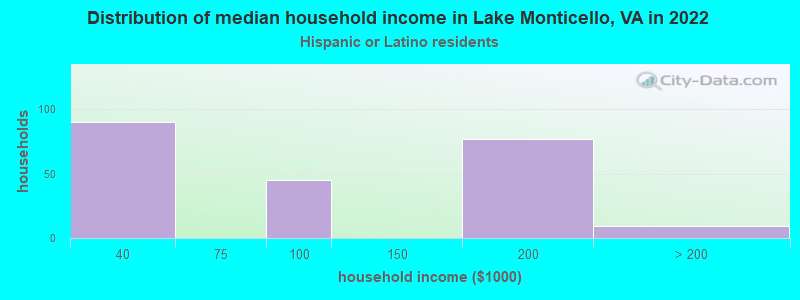
Income and house value in Lake Monticello Median household income in 2022 $99,428 White non-Hispanic householders$103,179 Black householdersMedian 2022 house value $292,828 White Non-Hispanic householders$295,096 Black or African American householders$311,881 American Indian or Alaska Native householders$425,292 Some other race householders$215,481 Two or more races householders$425,292 Hispanic or Latino householders
Median age by race in Lake Monticello
44.6 Median age for White residents48.1 41.4 35.9 Median age for Black or African American residents35.9 29.5 -682,215,742.8 Median age for American Indian / Alaska Native residents-682,352,940.5 -687,861,271.0 46.7 Median age for Asian residents16.9 47.2 -611,955,419.9 Median age for Native Hawaiian / Pacific Islander residents-541,531,822.5 -714,150,046.8 36.0 Median age for Other race residents35.5 38.7 13.2 Median age for Two or more races residents16.8 6.1 45.5 Median age for White alone residents49.3 41.9 30.7 Median age for Hispanic or Latino residents30.3 32.4
Owner/renter occupied households by race in Lake Monticello
House owners and renters - White residents 3,496 95.5% Owner occupied165 4.5% Renter occupiedHouse owners and renters - Black or African American residents 209 96.8% Owner occupied7 3.2% Renter occupiedHouse owners and renters - Other race residents 156 97.6% Owner occupied4 2.4% Renter occupiedHouse owners and renters - Two or more races residents 277 94.3% Owner occupied17 5.7% Renter occupiedHouse owners and renters - White alone residents 3,482 95.3% Owner occupied170 4.7% Renter occupiedHouse owners and renters - Hispanic or Latino residents 219 98.6% Owner occupied3 1.4% Renter occupied
Language usage in Lake Monticello
English speakers - Total 91.9% of residents of Lake Monticello speak English at home.
5.3% of residents speak Spanish at home 387 72.6% Speak English very well146 27.4% Speak English less than very well2.5% of residents speak other language at home 179 70.5% Speak English very well75 29.5% Speak English less than very well
English speakers - Born in the United States 96.3% of residents of Lake Monticello speak English at home.
1.5% of residents speak Spanish at home 61 80.3% Speak English very well15 19.7% Speak English less than very well1.9% of residents speak other language at home 65 68.4% Speak English very well30 31.6% Speak English less than very well
English speakers - Native, born elsewhere 40.0% of residents of Lake Monticello speak English at home.
62.6% of residents speak Spanish at home 87 89.7% Speak English very well10 10.3% Speak English less than very well
English speakers - Foreign-born 14.7% of residents of Lake Monticello speak English at home.
60.6% of residents speak Spanish at home 86 41.7% Speak English very well120 58.3% Speak English less than very well23.2% of residents speak other language at home 34 43.0% Speak English very well45 57.0% Speak English less than very well
White (Caucasian) - Speak only English Native:
98.1% (7,517)Foreign-born:
40.2% (42)
White (Caucasian) - Speak another language Native:
2.2% (167)Foreign-born:
62.4% (66)
Asian - Speak another language Native:
22.1% (30)Foreign-born:
98.9% (20)
Other race - Speak another language Native:
69.7% (212)Foreign-born:
98.4% (107)
Two or more races - Speak another language Native:
15.2% (106)Foreign-born:
100.0% (112)
White alone - Speak only English Native:
97.2% (7,465)Foreign-born:
44.4% (45)
White alone - Speak another language Native:
2.8% (213)Foreign-born:
54.5% (56)
Hispanic or Latino - Speak another language Native:
42.5% (248)Foreign-born:
99.6% (207)
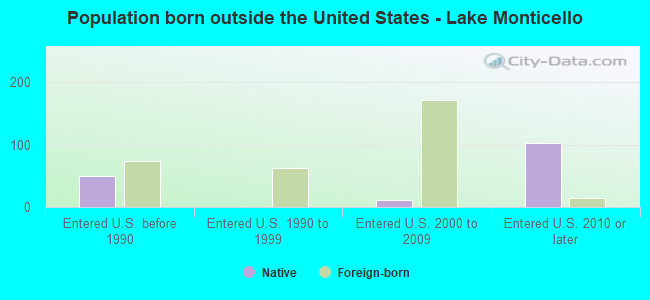
Foreign-born residents in Lake Monticello 339 residents are foreign born (1.9% Latin America , 0.9% Europe ).
This city:
3.1%Virginia:
12.6%
Marital status for residents in Lake Monticello Marital status - White (Caucasian) population 15 years and over
Males 19.0% Never married69.9% Now married0.4% Separated3.3% Widowed7.4% DivorcedFemales 20.3% Never married61.0% Now married0.0% Separated7.3% Widowed11.5% DivorcedWomen who gave birth in the past 12 months Now married:
100.0% (93)Unmarried:
0.0% (0)
Women who did not give birth in the past 12 months Now married:
53.2% (873)Unmarried:
46.8% (767)
Marital status - Black or African American population 15 years and over
Males 39.2% Never married49.5% Now married0.0% Separated0.0% Widowed11.3% DivorcedFemales 70.0% Never married17.7% Now married0.0% Separated0.0% Widowed12.2% DivorcedWomen who did not give birth in the past 12 months Now married:
12.4% (45)Unmarried:
87.6% (321)
Marital status - Asian population 15 years and over
Males 66.2% Never married0.0% Now married0.0% Separated33.8% Widowed0.0% DivorcedFemales 56.5% Never married43.5% Now married0.0% Separated0.0% Widowed0.0% DivorcedWomen who did not give birth in the past 12 months Now married:
25.7% (9)Unmarried:
74.3% (27)
Marital status - Other race population 15 years and over
Males 51.5% Never married43.1% Now married0.0% Separated0.0% Widowed5.4% DivorcedFemales 0.0% Never married93.2% Now married0.0% Separated0.0% Widowed6.8% DivorcedWomen who did not give birth in the past 12 months Now married:
87.0% (26)Unmarried:
13.0% (4)
Marital status - Two or more races population 15 years and over
Males 29.9% Never married70.1% Now married0.0% Separated0.0% Widowed0.0% DivorcedFemales 40.7% Never married29.0% Now married0.0% Separated8.1% Widowed22.2% DivorcedWomen who gave birth in the past 12 months Now married:
100.0% (52)Unmarried:
0.0% (0)
Women who did not give birth in the past 12 months Now married:
17.1% (33)Unmarried:
82.9% (159)
Marital status - White alone, not Hispanic / Latino population 15 years and over
Males 17.0% Never married71.6% Now married0.4% Separated3.3% Widowed7.6% DivorcedFemales 20.6% Never married60.3% Now married0.0% Separated7.4% Widowed11.7% DivorcedWomen who gave birth in the past 12 months Now married:
100.0% (97)Unmarried:
0.0% (0)
Women who did not give birth in the past 12 months Now married:
51.5% (845)Unmarried:
48.5% (797)
Marital status - Hispanic or Latino population 15 years and over
Males 53.8% Never married36.4% Now married0.0% Separated6.9% Widowed2.9% DivorcedFemales 24.1% Never married59.7% Now married0.0% Separated0.0% Widowed16.2% DivorcedWomen who gave birth in the past 12 months Now married:
100.0% (40)Unmarried:
0.0% (0)
Women who did not give birth in the past 12 months Now married:
47.4% (98)Unmarried:
52.6% (108)
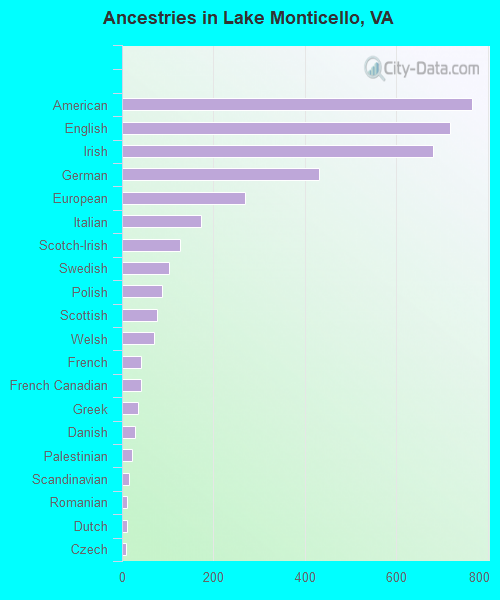
Ancestries in Lake Monticello
764 13.6% American718 12.8% English680 12.1% Irish430 7.7% German269 4.8% European173 3.1% Italian127 2.3% Scotch-Irish103 1.8% Swedish88 1.6% Polish76 1.4% Scottish70 1.3% Welsh42 0.8% French42 0.8% French Canadian34 0.6% Greek28 0.5% Danish22 0.4% Palestinian16 0.3% Scandinavian12 0.2% Romanian11 0.2% Dutch8 0.1% Czech6 0.1% Lithuanian5 0.09% Russian
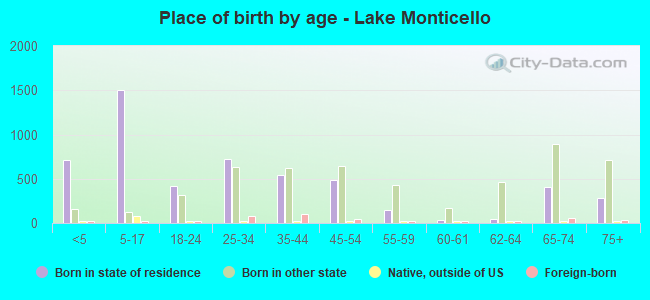
Children Nativity (place of birth) in Lake Monticello
Children under 6 years - Living with two parents Both parents native 608 100.0% NativeOne native, one foreign-born parent 12 100.0% NativeChildren under 6 years - Living with one parent Native parent 249 100.0% Native
Children 6 to 17 years - Living with two parents Both parents native 745 100.0% NativeBoth parents foreign-born 71 100.0% NativeChildren 6 to 17 years - Living with one parent Native parent 464 100.0% Native
Grandparents responsible for own grandchildren in Lake Monticello
Grandparents (30 to 59 years) White / Caucasian 31 100.0% Not responsible for grandchildrenBlack or African American 19 100.0% Not responsible for grandchildrenTwo or more races 47 100.0% Not responsible for grandchildrenWhite alone, not Hispanic / Latino 35 100.0% Not responsible for grandchildrenHispanic or Latino 32 100.0% Not responsible for grandchildren
Grandparents (60 years and over) White / Caucasian 15 100.0% Responsible for grandchildrenTwo or more races 27 100.0% Not responsible for grandchildrenWhite alone, not Hispanic / Latino 15 100.0% Responsible for grandchildren