Races in Lake Morton-Berrydale, Washington (WA) Detailed Stats
Data:
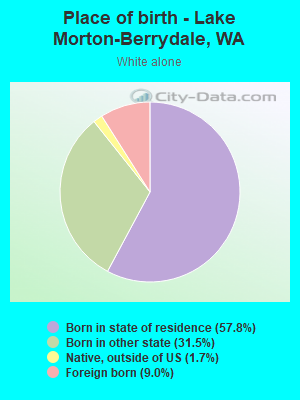
Races - White alone (%)
Races - White alone (% change since 2000)
Races - Black alone (%)
Races - Black alone (% change since 2000)
Races - American Indian alone (%)
Races - American Indian alone (% change since 2000)
Races - Asian alone (%)
Races - Asian alone (% change since 2000)
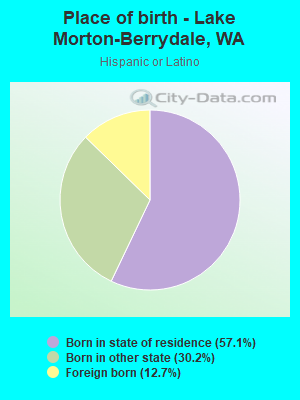
Races - Hispanic (%)
Races - Hispanic (% change since 2000)
Races - Native Hawaiian and Other Pacific Islander alone (%)
Races - Native Hawaiian and Other Pacific Islander alone (% change since 2000)
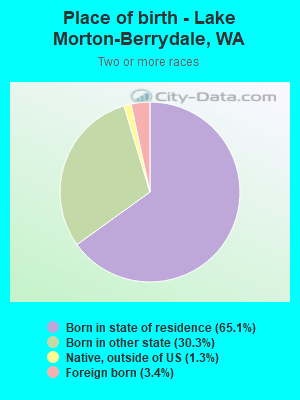
Races - Two or more races(%)
Races - Two or more races(% change since 2000)
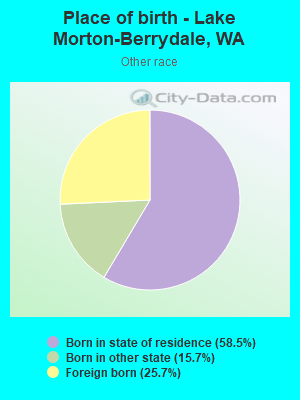
Races - Other race alone (%)
Races - Other race alone (% change since 2000)
Racial diversity
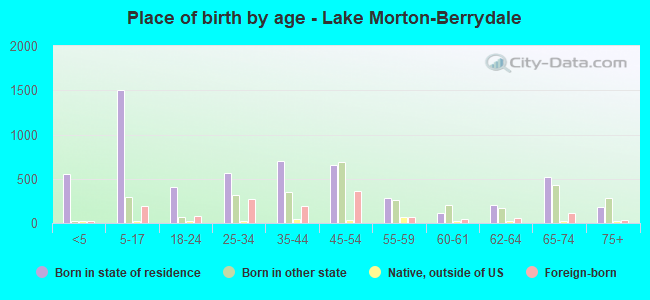
Place of birth - Born in state of residence (%)
Place of birth - Born in state of residence (%) - White
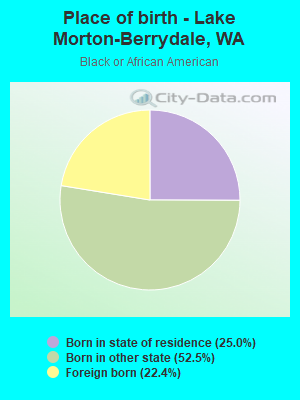
Place of birth - Born in state of residence (%) - Black or African American
Place of birth - Born in state of residence (%) - Asian
Place of birth - Born in state of residence (%) - Hispanic or Latino
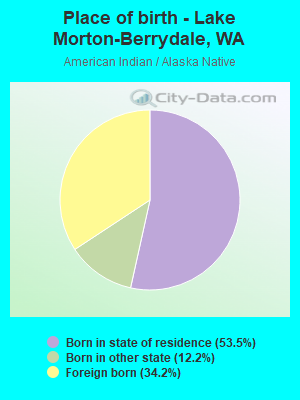
Place of birth - Born in state of residence (%) - American Indian and Alaska Native
Place of birth - Born in state of residence (%) - Multirace
Place of birth - Born in state of residence (%) - Other Race
Place of birth - Born in other state (%)
Place of birth - Born in other state (%) - White
Place of birth - Born in other state (%) - Black or African American
Place of birth - Born in other state (%) - Asian
Place of birth - Born in other state (%) - Hispanic or Latino
Place of birth - Born in other state (%) - American Indian and Alaska Native
Place of birth - Born in other state (%) - Multirace
Place of birth - Born in other state (%) - Other Race
Place of birth - Native, outside of US (%)
Place of birth - Native, outside of US (%) - White
Place of birth - Native, outside of US (%) - Black or African American
Place of birth - Native, outside of US (%) - Asian
Place of birth - Native, outside of US (%) - Hispanic or Latino
Place of birth - Native, outside of US (%) - American Indian and Alaska Native
Place of birth - Native, outside of US (%) - Multirace
Place of birth - Native, outside of US (%) - Other Race
Place of birth - Foreign born (%)
Place of birth - Foreign born (%) - White
Place of birth - Foreign born (%) - Black or African American
Place of birth - Foreign born (%) - Asian
Place of birth - Foreign born (%) - Hispanic or Latino
Place of birth - Foreign born (%) - American Indian and Alaska Native
Place of birth - Foreign born (%) - Multirace
Place of birth - Foreign born (%) - Other Race
Residents speaking English at home (%)
Residents speaking English at home - Born in the United States (%)
Residents speaking English at home - Native, born elsewhere (%)
Residents speaking English at home - Foreign born (%)
Residents speaking Spanish at home (%)
Residents speaking Spanish at home - Born in the United States (%)
Residents speaking Spanish at home - Native, born elsewhere (%)
Residents speaking Spanish at home - Foreign born (%)
Residents speaking other language at home (%)
Residents speaking other language at home - Born in the United States (%)
Residents speaking other language at home - Native, born elsewhere (%)
Residents speaking other language at home - Foreign born (%)
Marital status - Never married (%)
Marital status - Now married (%)
Marital status - Separated (%)
Marital status - Widowed (%)
Marital status - Divorced (%)
Ancestries Reported - Arab (%)
Ancestries Reported - Czech (%)
Ancestries Reported - Danish (%)
Ancestries Reported - Dutch (%)
Ancestries Reported - English (%)
Ancestries Reported - French (%)
Ancestries Reported - French Canadian (%)
Ancestries Reported - German (%)
Ancestries Reported - Greek (%)
Ancestries Reported - Hungarian (%)
Ancestries Reported - Irish (%)
Ancestries Reported - Italian (%)
Ancestries Reported - Lithuanian (%)
Ancestries Reported - Norwegian (%)
Ancestries Reported - Polish (%)
Ancestries Reported - Portuguese (%)
Ancestries Reported - Russian (%)
Ancestries Reported - Scotch-Irish (%)
Ancestries Reported - Scottish (%)
Ancestries Reported - Slovak (%)
Ancestries Reported - Subsaharan African (%)
Ancestries Reported - Swedish (%)
Ancestries Reported - Swiss (%)
Ancestries Reported - Ukrainian (%)
Ancestries Reported - United States (%)
Ancestries Reported - Welsh (%)
Ancestries Reported - West Indian (%)
Ancestries Reported - Other (%)
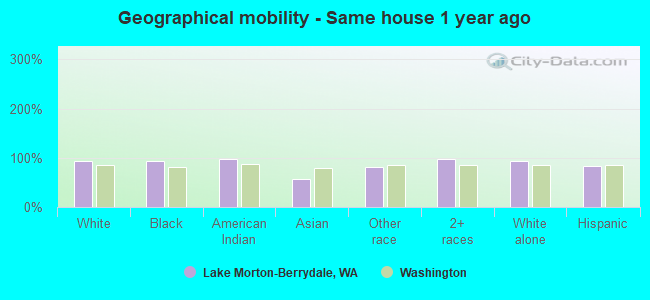
Geographical mobility - Same house 1 year ago (%)
Geographical mobility - Same house 1 year ago (%) - White
Geographical mobility - Same house 1 year ago (%) - Black or African American
Geographical mobility - Same house 1 year ago (%) - Asian
Geographical mobility - Same house 1 year ago (%) - Hispanic or Latino
Geographical mobility - Same house 1 year ago (%) - American Indian and Alaska Native
Geographical mobility - Same house 1 year ago (%) - Multirace
Geographical mobility - Same house 1 year ago (%) - Other Race
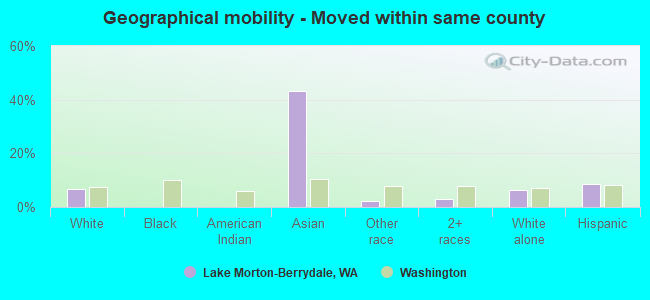
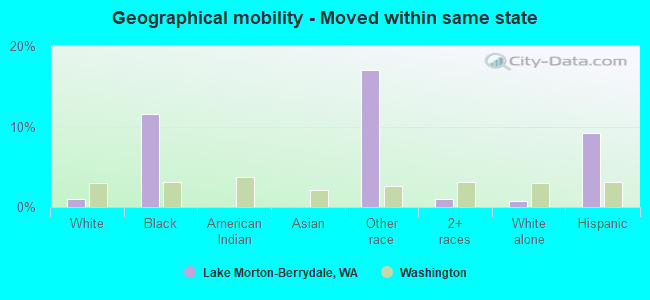
Geographical mobility - Moved within same county (%)
Geographical mobility - Moved within same county (%) - White
Geographical mobility - Moved within same county (%) - Black or African American
Geographical mobility - Moved within same county (%) - Asian
Geographical mobility - Moved within same county (%) - Hispanic or Latino
Geographical mobility - Moved within same county (%) - American Indian and Alaska Native
Geographical mobility - Moved within same county (%) - Multirace
Geographical mobility - Moved within same county (%) - Other Race
Geographical mobility - Moved from different county within same state (%)
Geographical mobility - Moved from different county within same state (%) - White
Geographical mobility - Moved from different county within same state (%) - Black or African American
Geographical mobility - Moved from different county within same state (%) - Asian
Geographical mobility - Moved from different county within same state (%) - Hispanic or Latino
Geographical mobility - Moved from different county within same state (%) - American Indian and Alaska Native
Geographical mobility - Moved from different county within same state (%) - Multirace
Geographical mobility - Moved from different county within same state (%) - Other Race
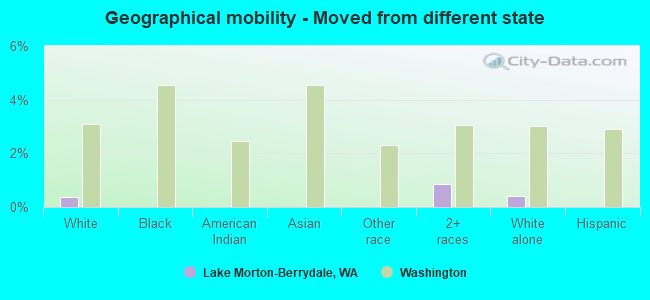
Geographical mobility - Moved from different state (%)
Geographical mobility - Moved from different state (%) - White
Geographical mobility - Moved from different state (%) - Black or African American
Geographical mobility - Moved from different state (%) - Asian
Geographical mobility - Moved from different state (%) - Hispanic or Latino
Geographical mobility - Moved from different state (%) - American Indian and Alaska Native
Geographical mobility - Moved from different state (%) - Multirace
Geographical mobility - Moved from different state (%) - Other Race
Geographical mobility - Moved from abroad (%)
Geographical mobility - Moved from abroad (%) - White
Geographical mobility - Moved from abroad (%) - Black or African American
Geographical mobility - Moved from abroad (%) - Asian
Geographical mobility - Moved from abroad (%) - Hispanic or Latino
Geographical mobility - Moved from abroad (%) - American Indian and Alaska Native
Geographical mobility - Moved from abroad (%) - Multirace
Geographical mobility - Moved from abroad (%) - Other Race
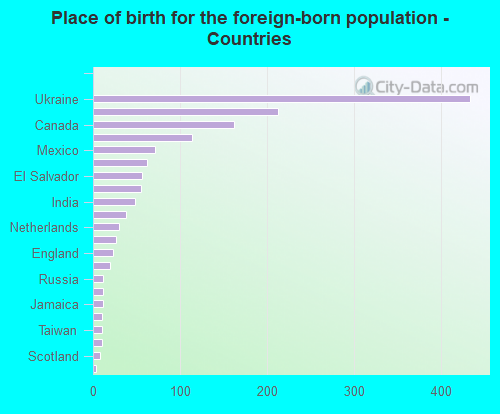
Place of birth for the foreign-born population - Ireland (%)
Place of birth for the foreign-born population - Denmark (%)
Place of birth for the foreign-born population - Norway (%)
Place of birth for the foreign-born population - Sweden (%)
Place of birth for the foreign-born population - United Kingdom (%)
Place of birth for the foreign-born population - England (%)
Place of birth for the foreign-born population - Scotland (%)
Place of birth for the foreign-born population - Other Northern Europe (%)
Place of birth for the foreign-born population - Austria (%)
Place of birth for the foreign-born population - Belgium (%)
Place of birth for the foreign-born population - France (%)
Place of birth for the foreign-born population - Germany (%)
Place of birth for the foreign-born population - Netherlands (%)
Place of birth for the foreign-born population - Switzerland (%)
Place of birth for the foreign-born population - Other Western Europe (%)
Place of birth for the foreign-born population - Greece (%)
Place of birth for the foreign-born population - Italy (%)
Place of birth for the foreign-born population - Portugal (%)
Place of birth for the foreign-born population - Spain (%)
Place of birth for the foreign-born population - Other Southern Europe (%)
Place of birth for the foreign-born population - Albania (%)
Place of birth for the foreign-born population - Belarus (%)
Place of birth for the foreign-born population - Bosnia and Herzegovina (%)
Place of birth for the foreign-born population - Bulgaria (%)
Place of birth for the foreign-born population - Croatia (%)
Place of birth for the foreign-born population - Czechoslovakia (%)
Place of birth for the foreign-born population - Hungary (%)
Place of birth for the foreign-born population - Latvia (%)
Place of birth for the foreign-born population - Lithuania (%)
Place of birth for the foreign-born population - North Macedonia (Macedonia) (%)
Place of birth for the foreign-born population - Moldova (%)
Place of birth for the foreign-born population - Poland (%)
Place of birth for the foreign-born population - Romania (%)
Place of birth for the foreign-born population - Russia (%)
Place of birth for the foreign-born population - Serbia (%)
Place of birth for the foreign-born population - Ukraine (%)
Place of birth for the foreign-born population - Other Eastern Europe (%)
Place of birth for the foreign-born population - China (%)
Place of birth for the foreign-born population - Hong Kong (%)
Place of birth for the foreign-born population - Taiwan (%)
Place of birth for the foreign-born population - Japan (%)
Place of birth for the foreign-born population - Korea (%)
Place of birth for the foreign-born population - Other Eastern Asia (%)
Place of birth for the foreign-born population - Afghanistan (%)
Place of birth for the foreign-born population - Bangladesh (%)
Place of birth for the foreign-born population - India (%)
Place of birth for the foreign-born population - Iran (%)
Place of birth for the foreign-born population - Kazakhstan (%)
Place of birth for the foreign-born population - Nepal (%)
Place of birth for the foreign-born population - Pakistan (%)
Place of birth for the foreign-born population - Sri Lanka (%)
Place of birth for the foreign-born population - Uzbekistan (%)
Place of birth for the foreign-born population - Other South Central Asia (%)
Place of birth for the foreign-born population - Burma (%)
Place of birth for the foreign-born population - Cambodia (%)
Place of birth for the foreign-born population - Indonesia (%)
Place of birth for the foreign-born population - Laos (%)
Place of birth for the foreign-born population - Malaysia (%)
Place of birth for the foreign-born population - Philippines (%)
Place of birth for the foreign-born population - Singapore (%)
Place of birth for the foreign-born population - Thailand (%)
Place of birth for the foreign-born population - Vietnam (%)
Place of birth for the foreign-born population - Other South Eastern Asia (%)
Place of birth for the foreign-born population - Armenia (%)
Place of birth for the foreign-born population - Iraq (%)
Place of birth for the foreign-born population - Israel (%)
Place of birth for the foreign-born population - Jordan (%)
Place of birth for the foreign-born population - Kuwait (%)
Place of birth for the foreign-born population - Lebanon (%)
Place of birth for the foreign-born population - Saudi Arabia (%)
Place of birth for the foreign-born population - Syria (%)
Place of birth for the foreign-born population - Turkey (%)
Place of birth for the foreign-born population - Yemen (%)
Place of birth for the foreign-born population - Other Western Asia (%)
Place of birth for the foreign-born population - Eritrea (%)
Place of birth for the foreign-born population - Ethiopia (%)
Place of birth for the foreign-born population - Kenya (%)
Place of birth for the foreign-born population - Somalia (%)
Place of birth for the foreign-born population - Uganda (%)
Place of birth for the foreign-born population - Zimbabwe (%)
Place of birth for the foreign-born population - Other Eastern Africa (%)
Place of birth for the foreign-born population - Cameroon (%)
Place of birth for the foreign-born population - Congo (%)
Place of birth for the foreign-born population - Democratic Republic of Congo (Zaire) (%)
Place of birth for the foreign-born population - Other Middle Africa (%)
Place of birth for the foreign-born population - Egypt (%)
Place of birth for the foreign-born population - Morocco (%)
Place of birth for the foreign-born population - Sudan (%)
Place of birth for the foreign-born population - Other Northern Africa (%)
Place of birth for the foreign-born population - South Africa (%)
Place of birth for the foreign-born population - Other Southern Africa (%)
Place of birth for the foreign-born population - Cabo Verde (%)
Place of birth for the foreign-born population - Ghana (%)
Place of birth for the foreign-born population - Liberia (%)
Place of birth for the foreign-born population - Nigeria (%)
Place of birth for the foreign-born population - Senegal (%)
Place of birth for the foreign-born population - Sierra Leone (%)
Place of birth for the foreign-born population - Other Western Africa (%)
Place of birth for the foreign-born population - Australia (%)
Place of birth for the foreign-born population - New Zealand (%)
Place of birth for the foreign-born population - Fiji (%)
Place of birth for the foreign-born population - Micronesia (%)
Place of birth for the foreign-born population - Bahamas (%)
Place of birth for the foreign-born population - Barbados (%)
Place of birth for the foreign-born population - Cuba (%)
Place of birth for the foreign-born population - Dominica (%)
Place of birth for the foreign-born population - Dominican Republic (%)
Place of birth for the foreign-born population - Grenada (%)
Place of birth for the foreign-born population - Haiti (%)
Place of birth for the foreign-born population - Jamaica (%)
Place of birth for the foreign-born population - St. Vincent and the Grenadines (%)
Place of birth for the foreign-born population - Trinidad and Tobago (%)
Place of birth for the foreign-born population - West Indies (%)
Place of birth for the foreign-born population - Other Caribbean (%)
Place of birth for the foreign-born population - Belize (%)
Place of birth for the foreign-born population - Costa Rica (%)
Place of birth for the foreign-born population - El Salvador (%)
Place of birth for the foreign-born population - Guatemala (%)
Place of birth for the foreign-born population - Honduras (%)
Place of birth for the foreign-born population - Mexico (%)
Place of birth for the foreign-born population - Nicaragua (%)
Place of birth for the foreign-born population - Panama (%)
Place of birth for the foreign-born population - Other Central America (%)
Place of birth for the foreign-born population - Argentina (%)
Place of birth for the foreign-born population - Bolivia (%)
Place of birth for the foreign-born population - Brazil (%)
Place of birth for the foreign-born population - Chile (%)
Place of birth for the foreign-born population - Colombia (%)
Place of birth for the foreign-born population - Ecuador (%)
Place of birth for the foreign-born population - Guyana (%)
Place of birth for the foreign-born population - Peru (%)
Place of birth for the foreign-born population - Uruguay (%)
Place of birth for the foreign-born population - Venezuela (%)
Place of birth for the foreign-born population - Other South America (%)
Place of birth for the foreign-born population - Canada (%)
Place of birth for the foreign-born population - Other Northern America (%)
Place of birth for the foreign-born population - Other (%)
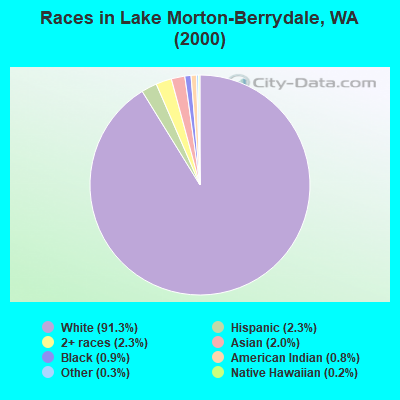
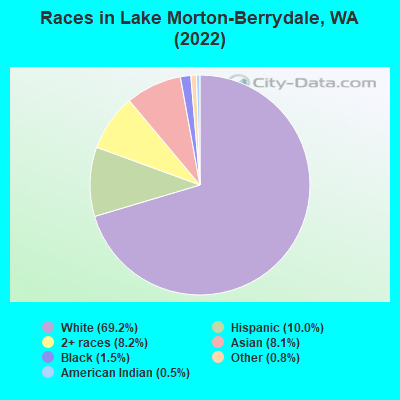
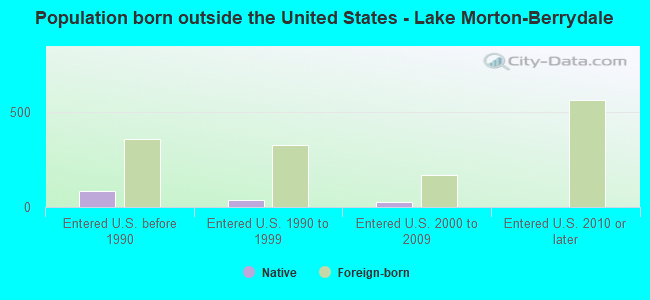
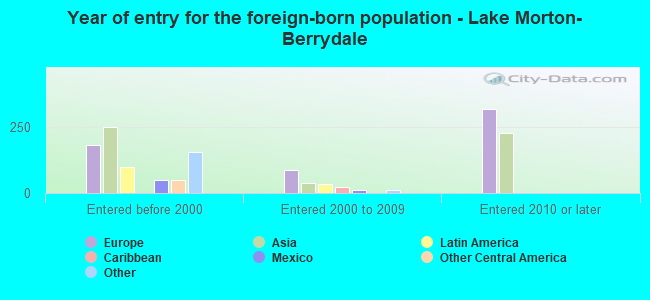
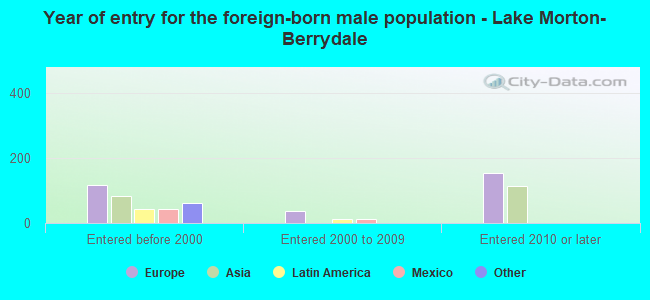
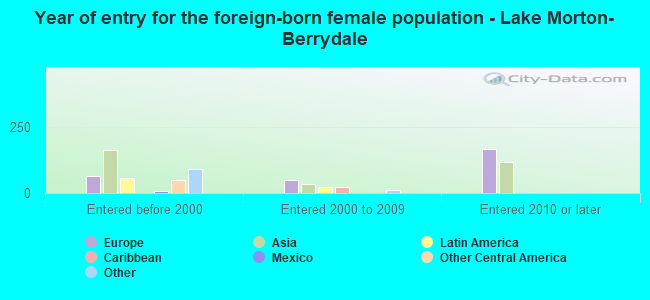
According to 2022 data, the most numerous races in Lake Morton-Berrydale, WA are White alone (7,274 residents), Hispanic (1,049 residents), and Asian alone (853 residents). 81.2% of Lake Morton-Berrydale residents speak English at home. 13.7% of Lake Morton-Berrydale, WA residents are foreign-born (5.6% born in Europe, 4.6% born in Asia, 1.5% born in North America, 1.4% born in Latin America), which is 9.7% less than the foreign-born rate of 15.0% across the entire state of Washington.
Race distribution in Lake Morton-Berrydale
2000 2022
4,652,490 78.9% White alone 441,509 7.5% Hispanic 319,401 5.4% Asian alone 184,631 3.1% Black alone 175,926 3.0% Two or more races 85,396 1.4% American Indian alone 22,779 0.4% Native Hawaiian and Other 11,989 0.2% Other race alone
4,941,456 63.5% White alone 1,093,313 14.0% Hispanic 755,832 9.7% Asian alone 523,448 6.7% Two or more races 299,537 3.8% Black alone 69,024 0.9% American Indian alone 52,231 0.7% Native Hawaiian and Other 50,945 0.7% Other race alone
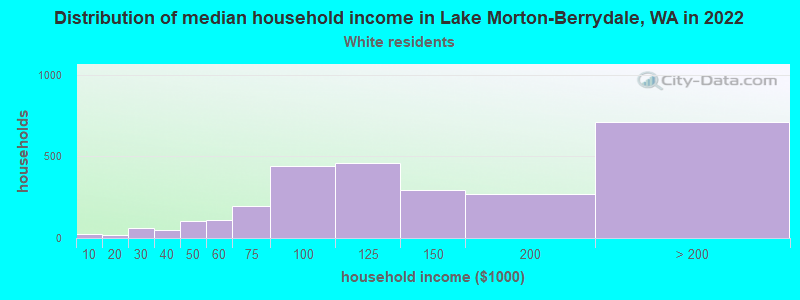
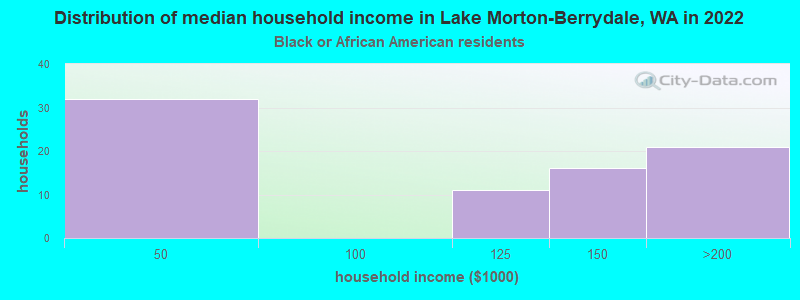
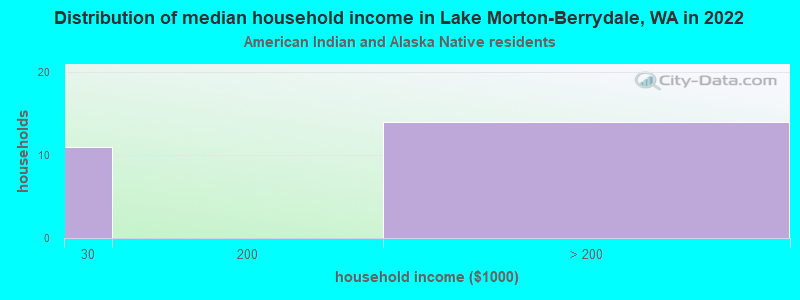
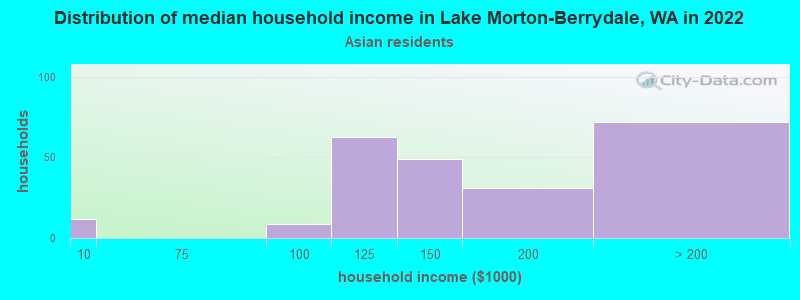
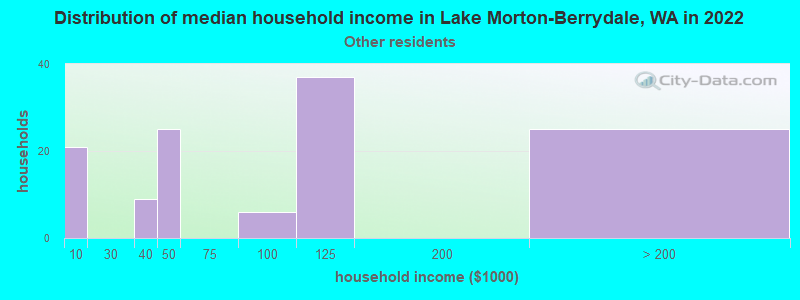
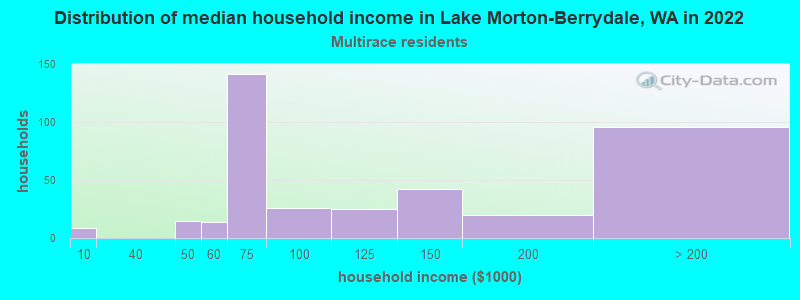
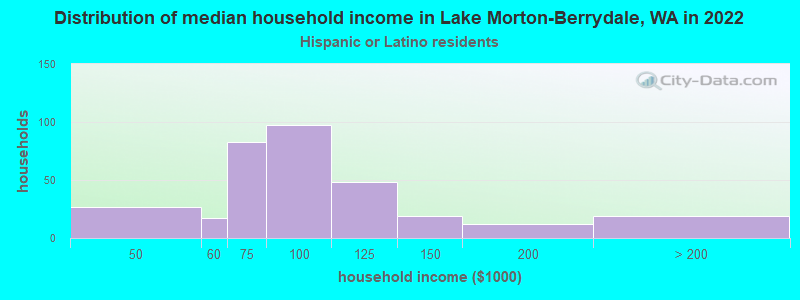
Income and house value in Lake Morton-Berrydale Median household income in 2022 $124,439 White non-Hispanic householders$127,293 Black householders$147,050 Asian householders$96,170 Hispanic or Latino race householdersMedian 2022 house value $695,803 White Non-Hispanic householders$777,512 Black or African American householders$636,146 American Indian or Alaska Native householders $724,642 Asian householders$889,757 Some other race householders$777,512 Two or more races householders$770,161 Hispanic or Latino householders
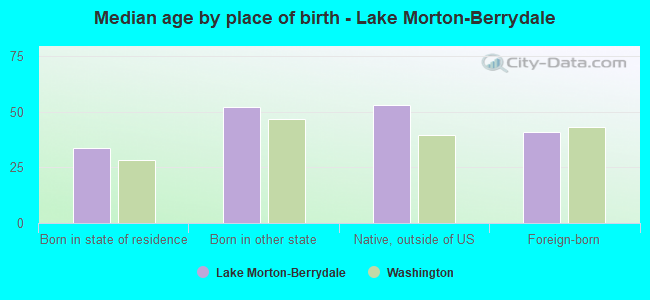
Median age by race in Lake Morton-Berrydale
44.8 Median age for White residents44.3 45.6 47.1 Median age for Black or African American residents47.6 45.4 49.0 Median age for American Indian / Alaska Native residents35.0 58.1 40.5 Median age for Asian residents40.5 40.0 -653,927,812.5 Median age for Native Hawaiian / Pacific Islander residents-664,509,168.7 -651,945,320.1 21.8 Median age for Other race residents21.6 15.7 20.8 Median age for Two or more races residents10.1 31.0 45.0 Median age for White alone residents44.3 47.0 29.6 Median age for Hispanic or Latino residents23.0 33.1
Owner/renter occupied households by race in Lake Morton-Berrydale
House owners and renters - White residents 2,449 89.4% Owner occupied292 10.6% Renter occupiedHouse owners and renters - Black or African American residents 66 100.0% Owner occupiedHouse owners and renters - American Indian / Alaska Native residents 7 23.1% Owner occupied24 76.9% Renter occupiedHouse owners and renters - Asian residents 239 100.0% Owner occupiedHouse owners and renters - Other race residents 73 72.0% Owner occupied29 28.0% Renter occupiedHouse owners and renters - Two or more races residents 372 89.9% Owner occupied42 10.1% Renter occupiedHouse owners and renters - White alone residents 2,348 92.3% Owner occupied196 7.7% Renter occupiedHouse owners and renters - Hispanic or Latino residents 207 60.9% Owner occupied133 39.1% Renter occupied
Language usage in Lake Morton-Berrydale
English speakers - Total 81.2% of residents of Lake Morton-Berrydale speak English at home.
4.4% of residents speak Spanish at home 237 54.6% Speak English very well197 45.4% Speak English less than very well13.1% of residents speak other language at home 687 53.1% Speak English very well607 46.9% Speak English less than very well
English speakers - Born in the United States 95.6% of residents of Lake Morton-Berrydale speak English at home.
2.6% of residents speak Spanish at home 37 46.8% Speak English very well42 53.2% Speak English less than very well1.7% of residents speak other language at home 48 92.3% Speak English very well4 7.7% Speak English less than very well
English speakers - Native, born elsewhere 59.2% of residents of Lake Morton-Berrydale speak English at home.
40.8% of residents speak other language at home 64 100.0% Speak English very well
English speakers - Foreign-born 22.9% of residents of Lake Morton-Berrydale speak English at home.
8.6% of residents speak Spanish at home 12 9.9% Speak English very well109 90.1% Speak English less than very well67.2% of residents speak other language at home 387 40.9% Speak English very well560 59.1% Speak English less than very well
White (Caucasian) - Speak only English Native:
96.4% (6,369)Foreign-born:
31.2% (178)
White (Caucasian) - Speak another language Native:
3.6% (238)Foreign-born:
68.8% (392)
Black or African American - Speak only English Native:
100.0% (128)Foreign-born:
100.0% (35)
American Indian / Alaska Native - Speak another language Native:
20.1% (14)Foreign-born:
100.0% (35)
Asian - Speak only English Native:
55.5% (138)Foreign-born:
10.7% (60)
Asian - Speak another language Native:
44.5% (111)Foreign-born:
89.3% (502)
Other race - Speak another language Native:
74.7% (247)Foreign-born:
100.0% (108)
Two or more races - Speak only English Native:
94.1% (866)Foreign-born:
97.6% (38)
White alone - Speak only English Native:
96.1% (6,064)Foreign-born:
28.8% (181)
White alone - Speak another language Native:
3.9% (244)Foreign-born:
71.8% (451)
Hispanic or Latino - Speak only English Native:
66.1% (601)Foreign-born:
4.9% (6)
Hispanic or Latino - Speak another language Native:
33.2% (302)Foreign-born:
95.3% (125)
Foreign-born residents in Lake Morton-Berrydale 1,438 residents are foreign born (5.6% Europe , 4.6% Asia , 1.5% North America , 1.4% Latin America ).
This city:
13.7%Washington:
14.9%
Marital status for residents in Lake Morton-Berrydale Marital status - White (Caucasian) population 15 years and over
Males 23.3% Never married66.7% Now married0.8% Separated1.1% Widowed8.1% DivorcedFemales 20.2% Never married67.1% Now married0.3% Separated2.7% Widowed9.7% DivorcedWomen who gave birth in the past 12 months Now married:
57.6% (18)Unmarried:
42.4% (13)
Women who did not give birth in the past 12 months Now married:
61.0% (964)Unmarried:
39.0% (617)
Marital status - Black or African American population 15 years and over
Males 36.4% Never married63.6% Now married0.0% Separated0.0% Widowed0.0% DivorcedFemales 0.0% Never married100.0% Now married0.0% Separated0.0% Widowed0.0% DivorcedWomen who gave birth in the past 12 months Now married:
100.0% (14)Unmarried:
0.0% (0)
Women who did not give birth in the past 12 months Now married:
100.0% (11)Unmarried:
0.0% (0)
Marital status - American Indian / Alaska Native population 15 years and over
Males 79.6% Never married20.4% Now married0.0% Separated0.0% Widowed0.0% DivorcedFemales 0.0% Never married85.3% Now married0.0% Separated0.0% Widowed14.7% DivorcedMarital status - Asian population 15 years and over
Males 16.0% Never married84.0% Now married0.0% Separated0.0% Widowed0.0% DivorcedFemales 2.8% Never married93.1% Now married0.0% Separated0.0% Widowed4.1% DivorcedWomen who gave birth in the past 12 months Now married:
100.0% (53)Unmarried:
0.0% (0)
Women who did not give birth in the past 12 months Now married:
95.0% (211)Unmarried:
5.0% (11)
Marital status - Other race population 15 years and over
Males 53.5% Never married16.1% Now married0.0% Separated5.8% Widowed24.5% DivorcedFemales 44.3% Never married46.2% Now married9.4% Separated0.0% Widowed0.0% DivorcedWomen who did not give birth in the past 12 months Now married:
27.7% (22)Unmarried:
72.3% (58)
Marital status - Two or more races population 15 years and over
Males 17.8% Never married76.7% Now married0.0% Separated0.0% Widowed5.6% DivorcedFemales 24.1% Never married72.3% Now married0.0% Separated0.0% Widowed3.6% DivorcedWomen who gave birth in the past 12 months Now married:
0.0% (0)Unmarried:
100.0% (10)
Women who did not give birth in the past 12 months Now married:
58.6% (108)Unmarried:
41.4% (76)
Marital status - White alone, not Hispanic / Latino population 15 years and over
Males 22.7% Never married67.1% Now married0.8% Separated1.1% Widowed8.3% DivorcedFemales 16.2% Never married70.3% Now married0.3% Separated3.0% Widowed10.2% DivorcedWomen who gave birth in the past 12 months Now married:
57.6% (18)Unmarried:
42.4% (13)
Women who did not give birth in the past 12 months Now married:
66.0% (905)Unmarried:
34.0% (467)
Marital status - Hispanic or Latino population 15 years and over
Males 54.5% Never married31.6% Now married0.0% Separated0.0% Widowed13.8% DivorcedFemales 48.9% Never married48.1% Now married0.0% Separated0.0% Widowed3.1% DivorcedWomen who gave birth in the past 12 months Now married:
0.0% (0)Unmarried:
100.0% (9)
Women who did not give birth in the past 12 months Now married:
37.3% (142)Unmarried:
62.7% (239)
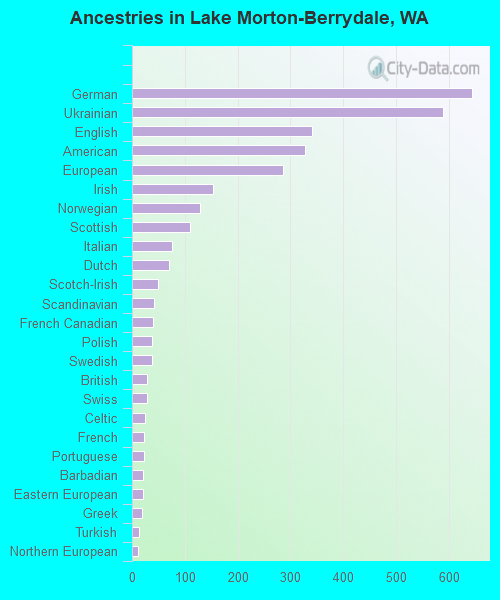
Ancestries in Lake Morton-Berrydale
644 13.0% German589 11.9% Ukrainian341 6.9% English327 6.6% American286 5.8% European154 3.1% Irish129 2.6% Norwegian110 2.2% Scottish76 1.5% Italian71 1.4% Dutch50 1.0% Scotch-Irish41 0.8% Scandinavian39 0.8% French Canadian38 0.8% Polish38 0.8% Swedish28 0.6% British28 0.6% Swiss24 0.5% Celtic23 0.5% French22 0.4% Portuguese21 0.4% Barbadian20 0.4% Eastern European18 0.4% Greek13 0.3% Turkish11 0.2% Northern European9 0.2% Canadian8 0.2% Welsh8 0.2% Jamaican
Children Nativity (place of birth) in Lake Morton-Berrydale
Children under 6 years - Living with two parents Both parents native 277 100.0% NativeBoth parents foreign-born 252 82.9% Native52 17.1% Foreign-bornOne native, one foreign-born parent 81 100.0% NativeChildren under 6 years - Living with one parent Native parent 70 100.0% NativeChildren 6 to 17 years - Living with two parents Both parents native 877 100.0% NativeBoth parents foreign-born 204 56.9% Native155 43.1% Foreign-bornOne native, one foreign-born parent 123 100.0% NativeChildren 6 to 17 years - Living with one parent Native parent 316 100.0% NativeForeign-born parent 85 50.9% Native82 49.1% Foreign-born
Grandparents responsible for own grandchildren in Lake Morton-Berrydale
Grandparents (30 to 59 years) White / Caucasian 30 100.0% Not responsible for grandchildrenWhite alone, not Hispanic / Latino 33 100.0% Not responsible for grandchildren
Grandparents (60 years and over) White / Caucasian 94 100.0% Not responsible for grandchildrenWhite alone, not Hispanic / Latino 96 100.0% Not responsible for grandchildren