Races in Lake Ridge, Virginia (VA) Detailed Stats
Data:
Races - White alone (%)
Races - White alone (% change since 2000)
Races - Black alone (%)
Races - Black alone (% change since 2000)
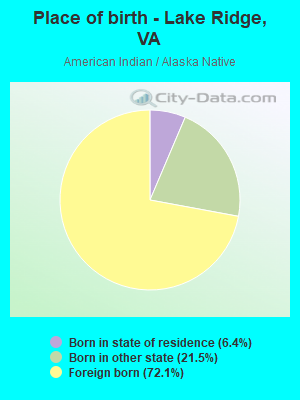
Races - American Indian alone (%)
Races - American Indian alone (% change since 2000)
Races - Asian alone (%)
Races - Asian alone (% change since 2000)
Races - Hispanic (%)
Races - Hispanic (% change since 2000)
Races - Native Hawaiian and Other Pacific Islander alone (%)
Races - Native Hawaiian and Other Pacific Islander alone (% change since 2000)
Races - Two or more races(%)
Races - Two or more races(% change since 2000)
Races - Other race alone (%)
Races - Other race alone (% change since 2000)
Racial diversity
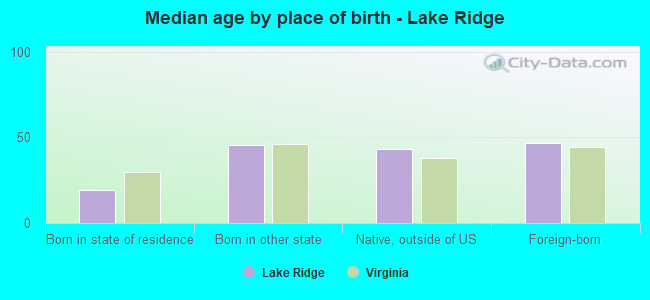
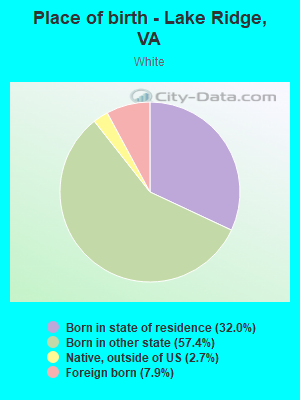
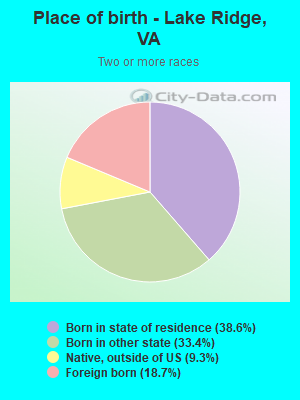
Place of birth - Born in state of residence (%)
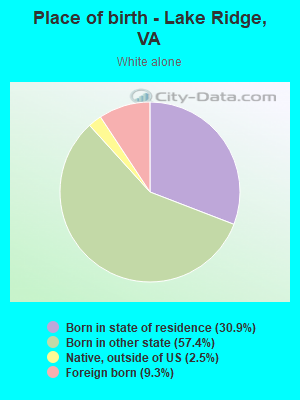
Place of birth - Born in state of residence (%) - White
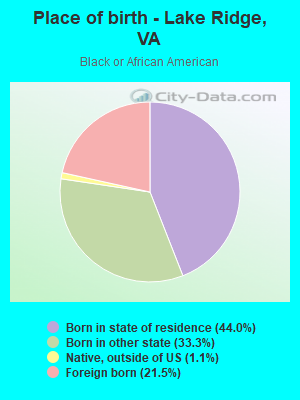
Place of birth - Born in state of residence (%) - Black or African American
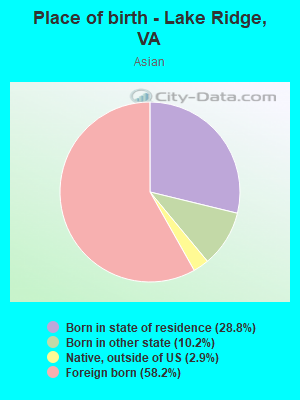
Place of birth - Born in state of residence (%) - Asian
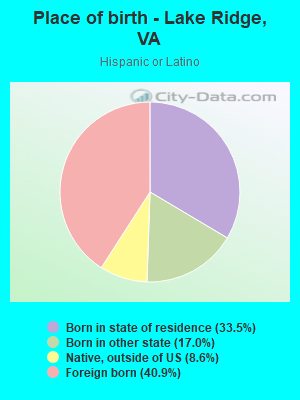
Place of birth - Born in state of residence (%) - Hispanic or Latino
Place of birth - Born in state of residence (%) - American Indian and Alaska Native
Place of birth - Born in state of residence (%) - Multirace
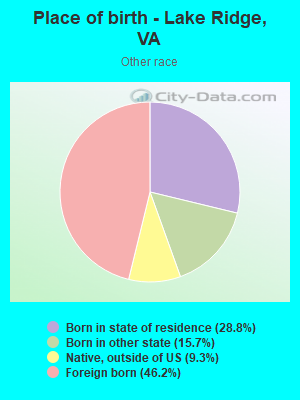
Place of birth - Born in state of residence (%) - Other Race
Place of birth - Born in other state (%)
Place of birth - Born in other state (%) - White
Place of birth - Born in other state (%) - Black or African American
Place of birth - Born in other state (%) - Asian
Place of birth - Born in other state (%) - Hispanic or Latino
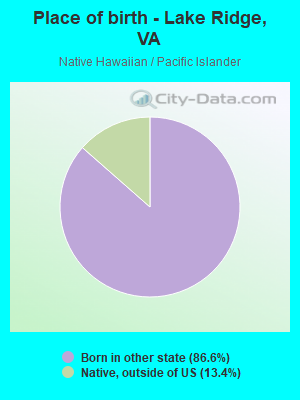
Place of birth - Born in other state (%) - American Indian and Alaska Native
Place of birth - Born in other state (%) - Multirace
Place of birth - Born in other state (%) - Other Race
Place of birth - Native, outside of US (%)
Place of birth - Native, outside of US (%) - White
Place of birth - Native, outside of US (%) - Black or African American
Place of birth - Native, outside of US (%) - Asian
Place of birth - Native, outside of US (%) - Hispanic or Latino
Place of birth - Native, outside of US (%) - American Indian and Alaska Native
Place of birth - Native, outside of US (%) - Multirace
Place of birth - Native, outside of US (%) - Other Race
Place of birth - Foreign born (%)
Place of birth - Foreign born (%) - White
Place of birth - Foreign born (%) - Black or African American
Place of birth - Foreign born (%) - Asian
Place of birth - Foreign born (%) - Hispanic or Latino
Place of birth - Foreign born (%) - American Indian and Alaska Native
Place of birth - Foreign born (%) - Multirace
Place of birth - Foreign born (%) - Other Race
Residents speaking English at home (%)
Residents speaking English at home - Born in the United States (%)
Residents speaking English at home - Native, born elsewhere (%)
Residents speaking English at home - Foreign born (%)
Residents speaking Spanish at home (%)
Residents speaking Spanish at home - Born in the United States (%)
Residents speaking Spanish at home - Native, born elsewhere (%)
Residents speaking Spanish at home - Foreign born (%)
Residents speaking other language at home (%)
Residents speaking other language at home - Born in the United States (%)
Residents speaking other language at home - Native, born elsewhere (%)
Residents speaking other language at home - Foreign born (%)
Marital status - Never married (%)
Marital status - Now married (%)
Marital status - Separated (%)
Marital status - Widowed (%)
Marital status - Divorced (%)
Ancestries Reported - Arab (%)
Ancestries Reported - Czech (%)
Ancestries Reported - Danish (%)
Ancestries Reported - Dutch (%)
Ancestries Reported - English (%)
Ancestries Reported - French (%)
Ancestries Reported - French Canadian (%)
Ancestries Reported - German (%)
Ancestries Reported - Greek (%)
Ancestries Reported - Hungarian (%)
Ancestries Reported - Irish (%)
Ancestries Reported - Italian (%)
Ancestries Reported - Lithuanian (%)
Ancestries Reported - Norwegian (%)
Ancestries Reported - Polish (%)
Ancestries Reported - Portuguese (%)
Ancestries Reported - Russian (%)
Ancestries Reported - Scotch-Irish (%)
Ancestries Reported - Scottish (%)
Ancestries Reported - Slovak (%)
Ancestries Reported - Subsaharan African (%)
Ancestries Reported - Swedish (%)
Ancestries Reported - Swiss (%)
Ancestries Reported - Ukrainian (%)
Ancestries Reported - United States (%)
Ancestries Reported - Welsh (%)
Ancestries Reported - West Indian (%)
Ancestries Reported - Other (%)
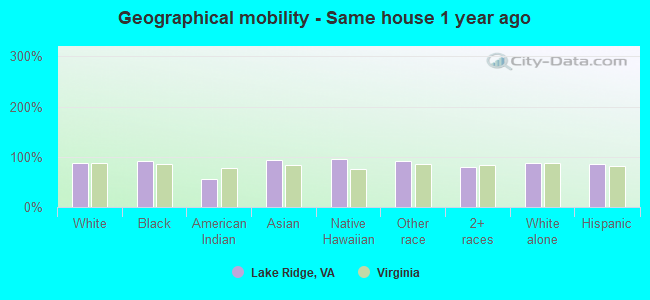
Geographical mobility - Same house 1 year ago (%)
Geographical mobility - Same house 1 year ago (%) - White
Geographical mobility - Same house 1 year ago (%) - Black or African American
Geographical mobility - Same house 1 year ago (%) - Asian
Geographical mobility - Same house 1 year ago (%) - Hispanic or Latino
Geographical mobility - Same house 1 year ago (%) - American Indian and Alaska Native
Geographical mobility - Same house 1 year ago (%) - Multirace
Geographical mobility - Same house 1 year ago (%) - Other Race
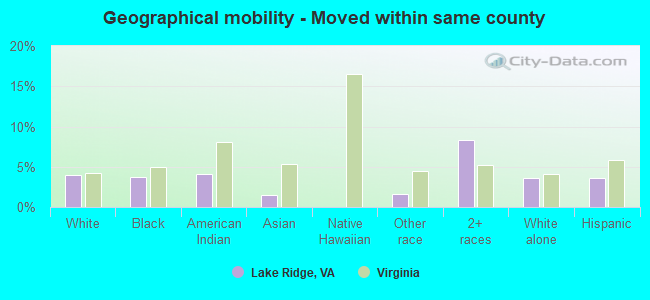
Geographical mobility - Moved within same county (%)
Geographical mobility - Moved within same county (%) - White
Geographical mobility - Moved within same county (%) - Black or African American
Geographical mobility - Moved within same county (%) - Asian
Geographical mobility - Moved within same county (%) - Hispanic or Latino
Geographical mobility - Moved within same county (%) - American Indian and Alaska Native
Geographical mobility - Moved within same county (%) - Multirace
Geographical mobility - Moved within same county (%) - Other Race
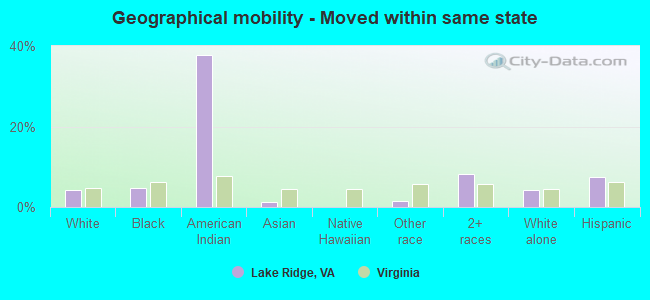
Geographical mobility - Moved from different county within same state (%)
Geographical mobility - Moved from different county within same state (%) - White
Geographical mobility - Moved from different county within same state (%) - Black or African American
Geographical mobility - Moved from different county within same state (%) - Asian
Geographical mobility - Moved from different county within same state (%) - Hispanic or Latino
Geographical mobility - Moved from different county within same state (%) - American Indian and Alaska Native
Geographical mobility - Moved from different county within same state (%) - Multirace
Geographical mobility - Moved from different county within same state (%) - Other Race
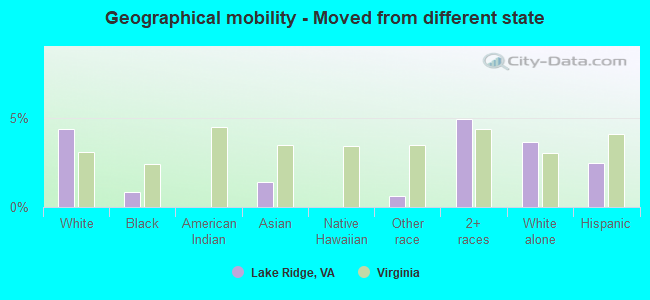
Geographical mobility - Moved from different state (%)
Geographical mobility - Moved from different state (%) - White
Geographical mobility - Moved from different state (%) - Black or African American
Geographical mobility - Moved from different state (%) - Asian
Geographical mobility - Moved from different state (%) - Hispanic or Latino
Geographical mobility - Moved from different state (%) - American Indian and Alaska Native
Geographical mobility - Moved from different state (%) - Multirace
Geographical mobility - Moved from different state (%) - Other Race
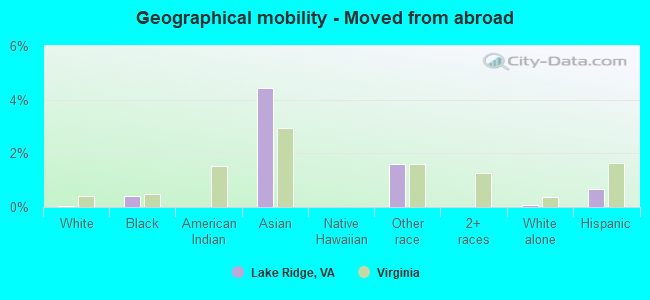
Geographical mobility - Moved from abroad (%)
Geographical mobility - Moved from abroad (%) - White
Geographical mobility - Moved from abroad (%) - Black or African American
Geographical mobility - Moved from abroad (%) - Asian
Geographical mobility - Moved from abroad (%) - Hispanic or Latino
Geographical mobility - Moved from abroad (%) - American Indian and Alaska Native
Geographical mobility - Moved from abroad (%) - Multirace
Geographical mobility - Moved from abroad (%) - Other Race
Place of birth for the foreign-born population - Ireland (%)
Place of birth for the foreign-born population - Denmark (%)
Place of birth for the foreign-born population - Norway (%)
Place of birth for the foreign-born population - Sweden (%)
Place of birth for the foreign-born population - United Kingdom (%)
Place of birth for the foreign-born population - England (%)
Place of birth for the foreign-born population - Scotland (%)
Place of birth for the foreign-born population - Other Northern Europe (%)
Place of birth for the foreign-born population - Austria (%)
Place of birth for the foreign-born population - Belgium (%)
Place of birth for the foreign-born population - France (%)
Place of birth for the foreign-born population - Germany (%)
Place of birth for the foreign-born population - Netherlands (%)
Place of birth for the foreign-born population - Switzerland (%)
Place of birth for the foreign-born population - Other Western Europe (%)
Place of birth for the foreign-born population - Greece (%)
Place of birth for the foreign-born population - Italy (%)
Place of birth for the foreign-born population - Portugal (%)
Place of birth for the foreign-born population - Spain (%)
Place of birth for the foreign-born population - Other Southern Europe (%)
Place of birth for the foreign-born population - Albania (%)
Place of birth for the foreign-born population - Belarus (%)
Place of birth for the foreign-born population - Bosnia and Herzegovina (%)
Place of birth for the foreign-born population - Bulgaria (%)
Place of birth for the foreign-born population - Croatia (%)
Place of birth for the foreign-born population - Czechoslovakia (%)
Place of birth for the foreign-born population - Hungary (%)
Place of birth for the foreign-born population - Latvia (%)
Place of birth for the foreign-born population - Lithuania (%)
Place of birth for the foreign-born population - North Macedonia (Macedonia) (%)
Place of birth for the foreign-born population - Moldova (%)
Place of birth for the foreign-born population - Poland (%)
Place of birth for the foreign-born population - Romania (%)
Place of birth for the foreign-born population - Russia (%)
Place of birth for the foreign-born population - Serbia (%)
Place of birth for the foreign-born population - Ukraine (%)
Place of birth for the foreign-born population - Other Eastern Europe (%)
Place of birth for the foreign-born population - China (%)
Place of birth for the foreign-born population - Hong Kong (%)
Place of birth for the foreign-born population - Taiwan (%)
Place of birth for the foreign-born population - Japan (%)
Place of birth for the foreign-born population - Korea (%)
Place of birth for the foreign-born population - Other Eastern Asia (%)
Place of birth for the foreign-born population - Afghanistan (%)
Place of birth for the foreign-born population - Bangladesh (%)
Place of birth for the foreign-born population - India (%)
Place of birth for the foreign-born population - Iran (%)
Place of birth for the foreign-born population - Kazakhstan (%)
Place of birth for the foreign-born population - Nepal (%)
Place of birth for the foreign-born population - Pakistan (%)
Place of birth for the foreign-born population - Sri Lanka (%)
Place of birth for the foreign-born population - Uzbekistan (%)
Place of birth for the foreign-born population - Other South Central Asia (%)
Place of birth for the foreign-born population - Burma (%)
Place of birth for the foreign-born population - Cambodia (%)
Place of birth for the foreign-born population - Indonesia (%)
Place of birth for the foreign-born population - Laos (%)
Place of birth for the foreign-born population - Malaysia (%)
Place of birth for the foreign-born population - Philippines (%)
Place of birth for the foreign-born population - Singapore (%)
Place of birth for the foreign-born population - Thailand (%)
Place of birth for the foreign-born population - Vietnam (%)
Place of birth for the foreign-born population - Other South Eastern Asia (%)
Place of birth for the foreign-born population - Armenia (%)
Place of birth for the foreign-born population - Iraq (%)
Place of birth for the foreign-born population - Israel (%)
Place of birth for the foreign-born population - Jordan (%)
Place of birth for the foreign-born population - Kuwait (%)
Place of birth for the foreign-born population - Lebanon (%)
Place of birth for the foreign-born population - Saudi Arabia (%)
Place of birth for the foreign-born population - Syria (%)
Place of birth for the foreign-born population - Turkey (%)
Place of birth for the foreign-born population - Yemen (%)
Place of birth for the foreign-born population - Other Western Asia (%)
Place of birth for the foreign-born population - Eritrea (%)
Place of birth for the foreign-born population - Ethiopia (%)
Place of birth for the foreign-born population - Kenya (%)
Place of birth for the foreign-born population - Somalia (%)
Place of birth for the foreign-born population - Uganda (%)
Place of birth for the foreign-born population - Zimbabwe (%)
Place of birth for the foreign-born population - Other Eastern Africa (%)
Place of birth for the foreign-born population - Cameroon (%)
Place of birth for the foreign-born population - Congo (%)
Place of birth for the foreign-born population - Democratic Republic of Congo (Zaire) (%)
Place of birth for the foreign-born population - Other Middle Africa (%)
Place of birth for the foreign-born population - Egypt (%)
Place of birth for the foreign-born population - Morocco (%)
Place of birth for the foreign-born population - Sudan (%)
Place of birth for the foreign-born population - Other Northern Africa (%)
Place of birth for the foreign-born population - South Africa (%)
Place of birth for the foreign-born population - Other Southern Africa (%)
Place of birth for the foreign-born population - Cabo Verde (%)
Place of birth for the foreign-born population - Ghana (%)
Place of birth for the foreign-born population - Liberia (%)
Place of birth for the foreign-born population - Nigeria (%)
Place of birth for the foreign-born population - Senegal (%)
Place of birth for the foreign-born population - Sierra Leone (%)
Place of birth for the foreign-born population - Other Western Africa (%)
Place of birth for the foreign-born population - Australia (%)
Place of birth for the foreign-born population - New Zealand (%)
Place of birth for the foreign-born population - Fiji (%)
Place of birth for the foreign-born population - Micronesia (%)
Place of birth for the foreign-born population - Bahamas (%)
Place of birth for the foreign-born population - Barbados (%)
Place of birth for the foreign-born population - Cuba (%)
Place of birth for the foreign-born population - Dominica (%)
Place of birth for the foreign-born population - Dominican Republic (%)
Place of birth for the foreign-born population - Grenada (%)
Place of birth for the foreign-born population - Haiti (%)
Place of birth for the foreign-born population - Jamaica (%)
Place of birth for the foreign-born population - St. Vincent and the Grenadines (%)
Place of birth for the foreign-born population - Trinidad and Tobago (%)
Place of birth for the foreign-born population - West Indies (%)
Place of birth for the foreign-born population - Other Caribbean (%)
Place of birth for the foreign-born population - Belize (%)
Place of birth for the foreign-born population - Costa Rica (%)
Place of birth for the foreign-born population - El Salvador (%)
Place of birth for the foreign-born population - Guatemala (%)
Place of birth for the foreign-born population - Honduras (%)
Place of birth for the foreign-born population - Mexico (%)
Place of birth for the foreign-born population - Nicaragua (%)
Place of birth for the foreign-born population - Panama (%)
Place of birth for the foreign-born population - Other Central America (%)
Place of birth for the foreign-born population - Argentina (%)
Place of birth for the foreign-born population - Bolivia (%)
Place of birth for the foreign-born population - Brazil (%)
Place of birth for the foreign-born population - Chile (%)
Place of birth for the foreign-born population - Colombia (%)
Place of birth for the foreign-born population - Ecuador (%)
Place of birth for the foreign-born population - Guyana (%)
Place of birth for the foreign-born population - Peru (%)
Place of birth for the foreign-born population - Uruguay (%)
Place of birth for the foreign-born population - Venezuela (%)
Place of birth for the foreign-born population - Other South America (%)
Place of birth for the foreign-born population - Canada (%)
Place of birth for the foreign-born population - Other Northern America (%)
Place of birth for the foreign-born population - Other (%)
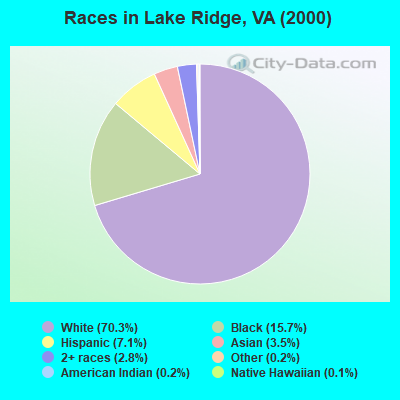
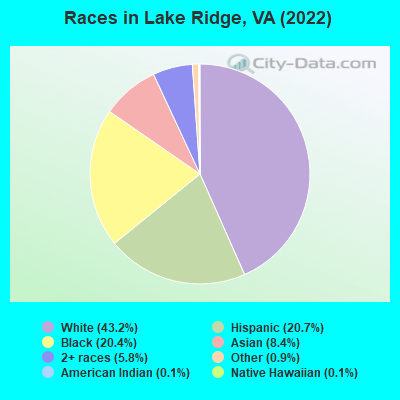
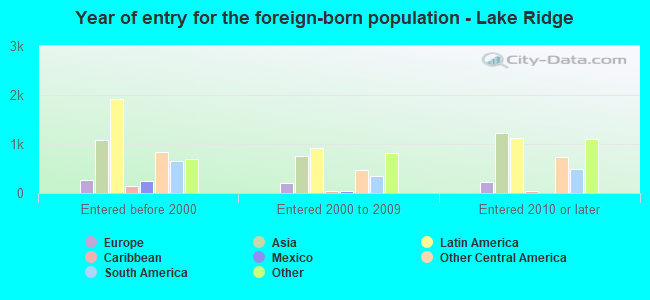
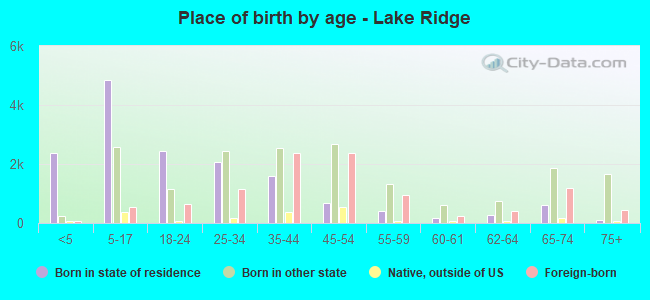
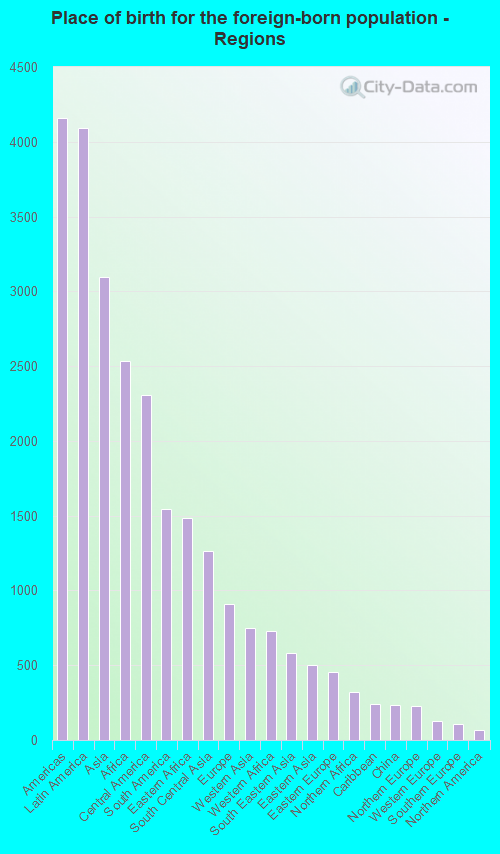
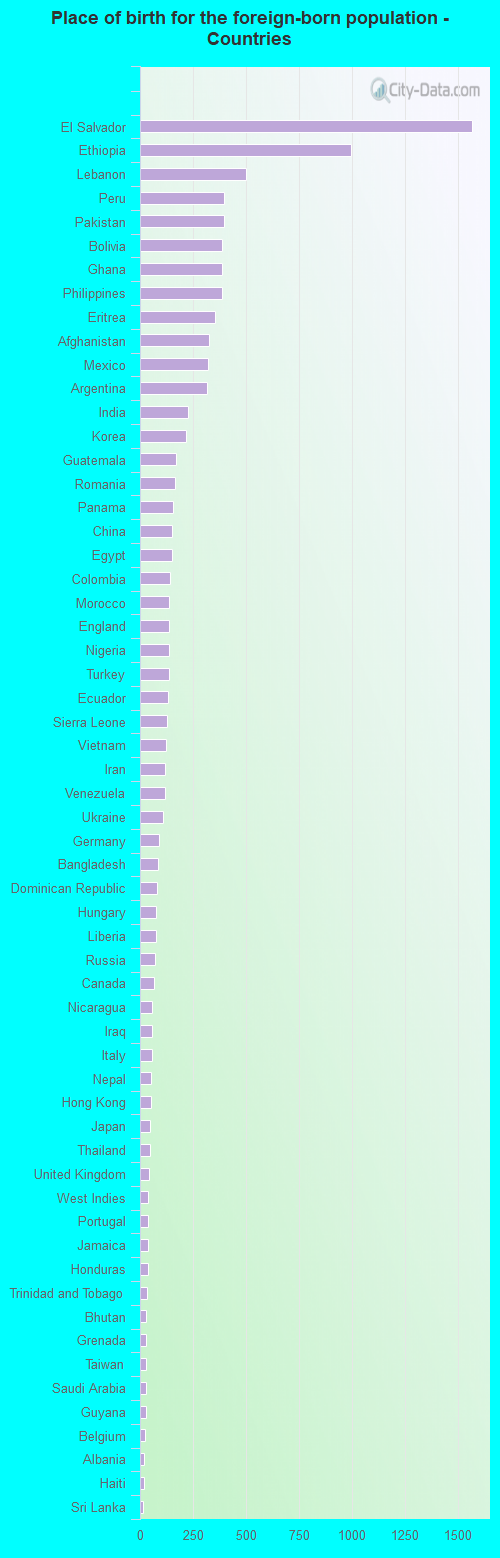
According to 2022 data, the most numerous races in Lake Ridge, VA are White alone (19,574 residents), Black alone (9,218 residents), and Hispanic (9,385 residents). 67.8% of Lake Ridge residents speak English at home. 23.6% of Lake Ridge, VA residents are foreign-born (9.0% born in Latin America, 6.8% born in Asia, 5.6% born in Africa), which is 49.3% greater than the foreign-born rate of 12.0% across the entire state of Virginia.
Race distribution in Lake Ridge
2000 2022
4,965,637 70.2% White alone 1,376,378 19.4% Black alone 329,540 4.7% Hispanic 259,277 3.7% Asian alone 114,022 1.6% Two or more races 18,596 0.3% American Indian alone 11,685 0.2% Other race alone 3,380 0.05% Native Hawaiian and Other
5,095,130 58.7% White alone 1,594,785 18.4% Black alone 905,750 10.4% Hispanic 602,881 6.9% Asian alone 406,047 4.7% Two or more races 60,419 0.7% Other race alone 11,738 0.1% American Indian alone 6,869 0.08% Native Hawaiian and Other
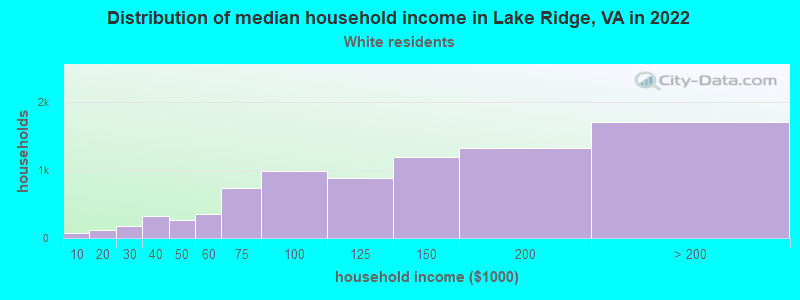
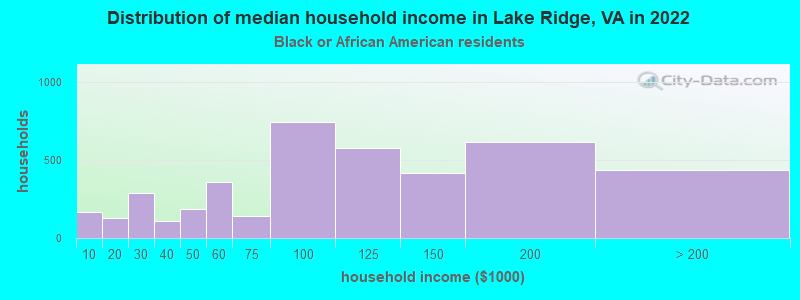
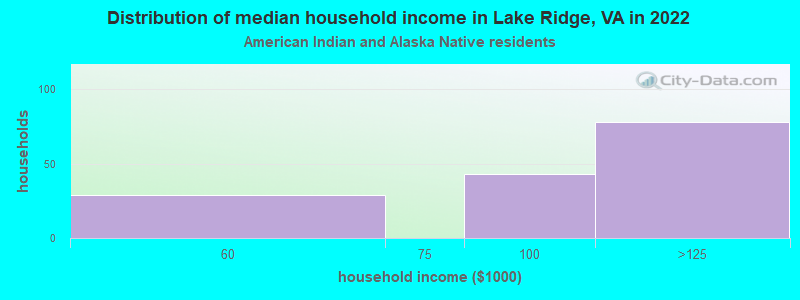
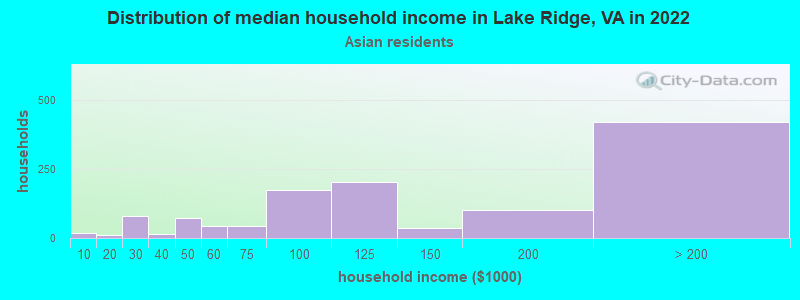
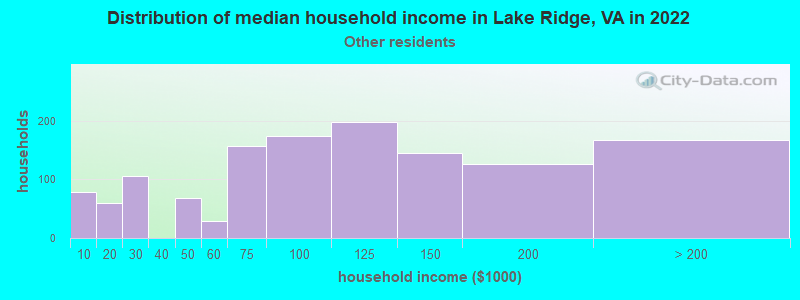
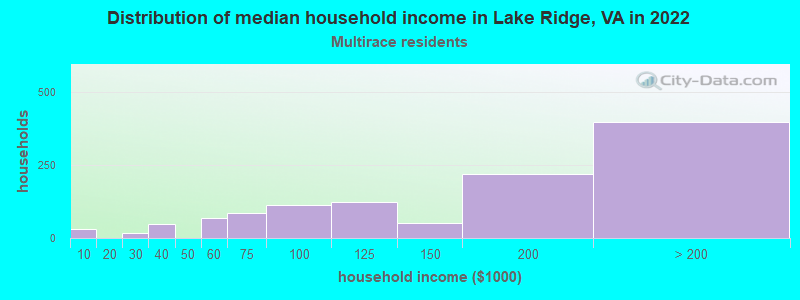
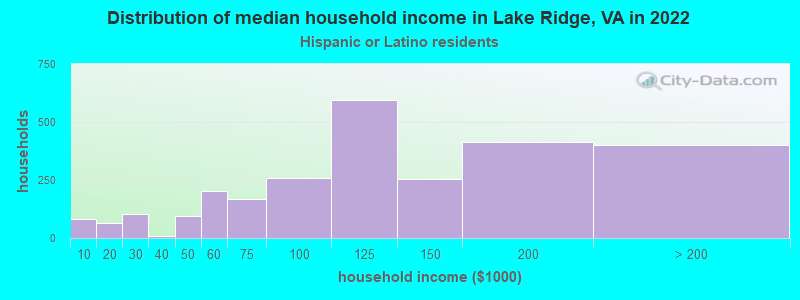
Income and house value in Lake Ridge Median household income in 2022 $125,972 White non-Hispanic householders$99,137 Black householders$98,531 American Indian and Alaska Native householders$133,291 Asian householders$100,412 Some other race householders$149,679 Two or more races householders$117,803 Hispanic or Latino race householdersMedian 2022 house value $476,743 White Non-Hispanic householders$409,386 Black or African American householders$471,494 American Indian or Alaska Native householders $499,778 Asian householders$452,541 Native Hawaiian and other Pacific Islander householders$340,280 Some other race householders$397,723 Two or more races householders$357,484 Hispanic or Latino householders
Median age by race in Lake Ridge
40.3 Median age for White residents39.3 41.3 39.2 Median age for Black or African American residents35.4 40.7 32.9 Median age for American Indian / Alaska Native residents33.7 32.1 37.8 Median age for Asian residents38.7 37.4 64.3 Median age for Native Hawaiian / Pacific Islander residents-541,531,822.5 75.1 35.6 Median age for Other race residents34.9 34.9 20.0 Median age for Two or more races residents19.3 20.3 40.2 Median age for White alone residents39.2 40.9 34.5 Median age for Hispanic or Latino residents31.5 36.2
Owner/renter occupied households by race in Lake Ridge
House owners and renters - White residents 6,151 76.9% Owner occupied1,845 23.1% Renter occupiedHouse owners and renters - Black or African American residents 2,933 71.7% Owner occupied1,160 28.3% Renter occupiedHouse owners and renters - American Indian / Alaska Native residents 74 44.9% Owner occupied91 55.1% Renter occupiedHouse owners and renters - Asian residents 990 81.0% Owner occupied232 19.0% Renter occupiedHouse owners and renters - Other race residents 1,004 75.1% Owner occupied333 24.9% Renter occupiedHouse owners and renters - Two or more races residents 814 71.2% Owner occupied329 28.8% Renter occupiedHouse owners and renters - White alone residents 5,703 73.7% Owner occupied2,039 26.3% Renter occupiedHouse owners and renters - Hispanic or Latino residents 2,145 82.2% Owner occupied464 17.8% Renter occupied
Language usage in Lake Ridge
English speakers - Total 67.8% of residents of Lake Ridge speak English at home.
14.5% of residents speak Spanish at home 4,128 66.9% Speak English very well2,041 33.1% Speak English less than very well17.8% of residents speak other language at home 5,266 69.3% Speak English very well2,335 30.7% Speak English less than very well
English speakers - Born in the United States 92.4% of residents of Lake Ridge speak English at home.
4.0% of residents speak Spanish at home 689 97.0% Speak English very well21 3.0% Speak English less than very well3.2% of residents speak other language at home 511 89.8% Speak English very well58 10.2% Speak English less than very well
English speakers - Native, born elsewhere 49.9% of residents of Lake Ridge speak English at home.
36.8% of residents speak Spanish at home 519 82.9% Speak English very well107 17.1% Speak English less than very well13.0% of residents speak other language at home 222 100.0% Speak English very well
English speakers - Foreign-born 12.5% of residents of Lake Ridge speak English at home.
34.7% of residents speak Spanish at home 1,780 49.8% Speak English very well1,795 50.2% Speak English less than very well52.9% of residents speak other language at home 3,299 60.5% Speak English very well2,152 39.5% Speak English less than very well
White (Caucasian) - Speak only English Native:
96.5% (16,603)Foreign-born:
18.7% (289)
White (Caucasian) - Speak another language Native:
4.8% (827)Foreign-born:
81.9% (1,264)
Black or African American - Speak only English Native:
92.9% (6,336)Foreign-born:
10.7% (218)
Black or African American - Speak another language Native:
7.2% (493)Foreign-born:
91.6% (1,863)
American Indian / Alaska Native - Speak only English Native:
89.8% (86)Foreign-born:
3.4% (8)
American Indian / Alaska Native - Speak another language Native:
11.4% (11)Foreign-born:
99.4% (242)
Asian - Speak only English Native:
39.5% (604)Foreign-born:
13.2% (290)
Asian - Speak another language Native:
59.6% (912)Foreign-born:
86.8% (1,911)
Other race - Speak only English Native:
32.9% (884)Foreign-born:
6.8% (191)
Other race - Speak another language Native:
67.1% (1,804)Foreign-born:
92.5% (2,582)
Two or more races - Speak only English Native:
77.4% (3,204)Foreign-born:
20.1% (222)
Two or more races - Speak another language Native:
19.5% (807)Foreign-born:
80.9% (893)
White alone - Speak only English Native:
95.9% (16,216)Foreign-born:
15.6% (280)
White alone - Speak another language Native:
4.0% (677)Foreign-born:
86.3% (1,551)
Hispanic or Latino - Speak only English Native:
50.2% (2,401)Foreign-born:
10.0% (386)
Hispanic or Latino - Speak another language Native:
50.4% (2,409)Foreign-born:
90.6% (3,514)
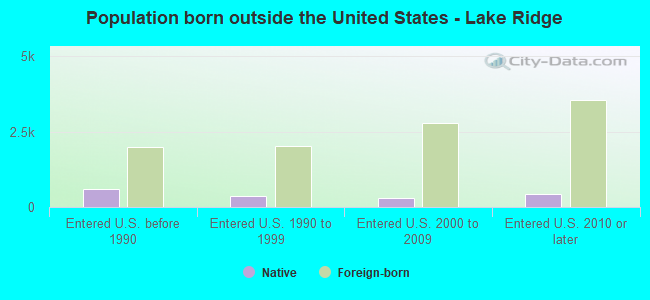
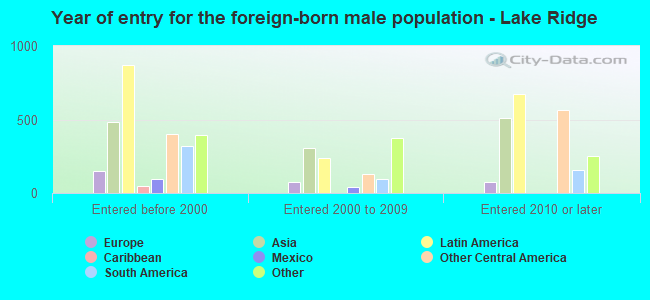
Foreign-born residents in Lake Ridge 10,703 residents are foreign born (9.0% Latin America , 6.8% Asia , 5.6% Africa ).
This city:
23.6%Virginia:
12.6%
Marital status for residents in Lake Ridge Marital status - White (Caucasian) population 15 years and over
Males 29.8% Never married59.7% Now married1.4% Separated2.1% Widowed7.1% DivorcedFemales 28.0% Never married50.8% Now married1.5% Separated7.2% Widowed12.5% DivorcedWomen who gave birth in the past 12 months Now married:
56.6% (105)Unmarried:
43.4% (81)
Women who did not give birth in the past 12 months Now married:
48.0% (2,086)Unmarried:
52.0% (2,261)
Marital status - Black or African American population 15 years and over
Males 35.4% Never married46.7% Now married1.8% Separated2.3% Widowed13.8% DivorcedFemales 41.0% Never married31.4% Now married3.6% Separated4.8% Widowed19.2% DivorcedWomen who gave birth in the past 12 months Now married:
37.9% (151)Unmarried:
62.1% (247)
Women who did not give birth in the past 12 months Now married:
25.4% (532)Unmarried:
74.6% (1,561)
Marital status - American Indian / Alaska Native population 15 years and over
Males 35.3% Never married39.6% Now married25.2% Separated0.0% Widowed0.0% DivorcedFemales 7.3% Never married75.8% Now married16.9% Separated0.0% Widowed0.0% DivorcedWomen who did not give birth in the past 12 months Now married:
100.0% (103)Unmarried:
0.0% (0)
Marital status - Asian population 15 years and over
Males 20.3% Never married73.6% Now married0.5% Separated1.0% Widowed4.5% DivorcedFemales 28.1% Never married59.6% Now married0.0% Separated4.3% Widowed8.1% DivorcedWomen who gave birth in the past 12 months Now married:
100.0% (27)Unmarried:
0.0% (0)
Women who did not give birth in the past 12 months Now married:
48.1% (516)Unmarried:
51.9% (556)
Marital status - Other race population 15 years and over
Males 42.3% Never married45.5% Now married0.8% Separated0.0% Widowed11.3% DivorcedFemales 41.1% Never married41.4% Now married2.6% Separated3.8% Widowed11.1% DivorcedWomen who gave birth in the past 12 months Now married:
100.0% (29)Unmarried:
0.0% (0)
Women who did not give birth in the past 12 months Now married:
40.3% (837)Unmarried:
59.7% (1,243)
Marital status - Two or more races population 15 years and over
Males 44.1% Never married47.3% Now married0.0% Separated1.2% Widowed7.3% DivorcedFemales 36.7% Never married49.0% Now married0.0% Separated4.3% Widowed10.0% DivorcedWomen who gave birth in the past 12 months Now married:
100.0% (66)Unmarried:
0.0% (0)
Women who did not give birth in the past 12 months Now married:
44.0% (801)Unmarried:
56.0% (1,020)
Marital status - White alone, not Hispanic / Latino population 15 years and over
Males 30.2% Never married58.5% Now married1.4% Separated2.3% Widowed7.6% DivorcedFemales 28.7% Never married50.4% Now married0.7% Separated7.9% Widowed12.3% DivorcedWomen who gave birth in the past 12 months Now married:
86.7% (93)Unmarried:
13.3% (14)
Women who did not give birth in the past 12 months Now married:
45.5% (2,016)Unmarried:
54.5% (2,414)
Marital status - Hispanic or Latino population 15 years and over
Males 39.7% Never married52.4% Now married1.2% Separated0.5% Widowed6.2% DivorcedFemales 33.6% Never married45.7% Now married4.1% Separated3.9% Widowed12.7% DivorcedWomen who gave birth in the past 12 months Now married:
42.4% (63)Unmarried:
57.6% (86)
Women who did not give birth in the past 12 months Now married:
46.1% (1,271)Unmarried:
53.9% (1,485)
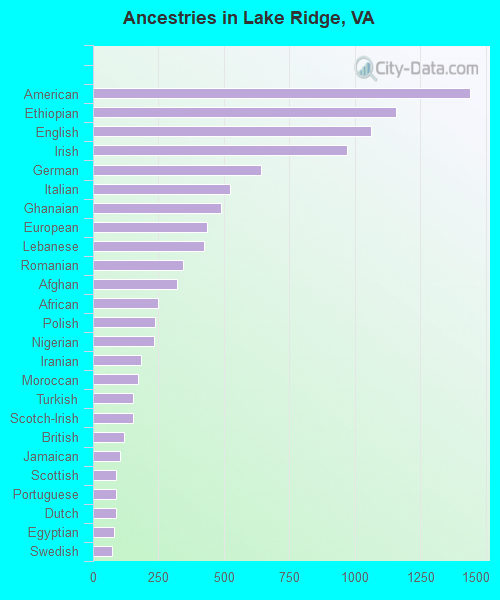
Ancestries in Lake Ridge
1,440 6.3% American1,156 5.1% Ethiopian1,063 4.7% English971 4.3% Irish642 2.8% German524 2.3% Italian489 2.1% Ghanaian434 1.9% European424 1.9% Lebanese342 1.5% Romanian319 1.4% Afghan247 1.1% African235 1.0% Polish234 1.0% Nigerian182 0.8% Iranian173 0.8% Moroccan151 0.7% Turkish151 0.7% Scotch-Irish117 0.5% British105 0.5% Jamaican88 0.4% Scottish88 0.4% Portuguese86 0.4% Dutch79 0.3% Egyptian72 0.3% Swedish68 0.3% Haitian63 0.3% West Indian60 0.3% Ukrainian55 0.2% Syrian54 0.2% Greek48 0.2% Arab47 0.2% Armenian46 0.2% Finnish42 0.2% Russian40 0.2% Canadian38 0.2% Slovak37 0.2% Albanian36 0.2% Norwegian36 0.2% Liberian32 0.1% Sudanese30 0.1% French27 0.1% Belgian22 0.10% Iraqi19 0.08% Scandinavian19 0.08% Czechoslovakian19 0.08% Austrian18 0.08% Sierra Leonean16 0.07% Estonian15 0.07% Danish14 0.06% Hungarian14 0.06% Trinidadian and Tobagonian11 0.05% Eastern European10 0.04% Slavic10 0.04% Croatian8 0.04% French Canadian8 0.04% Serbian8 0.04% Welsh7 0.03% Swiss
Geographical mobility in Lake Ridge Same house 1 year ago 16,845 87.4% White (Caucasian)8,474 91.2% Black or African American169 55.5% American Indian / Alaska Native3,531 93.9% Asian48 95.3% Native Hawaiian / Pacific Islander5,405 92.2% Other race4,789 79.1% Two or more races17,142 88.6% White alone, not Hispanic / Latino7,961 85.9% Hispanic or LatinoMoved within same county 758 3.9% White / Caucasian346 3.7% Black or African American12 4.0% American Indian / Alaska Native57 1.5% Asian91 1.6% Other race502 8.3% Two or more races688 3.6% White alone, not Hispanic / Latino334 3.6% Hispanic or LatinoMoved within same state 832 4.3% White / Caucasian428 4.6% Black or African American116 37.9% American Indian / Alaska Native48 1.3% Asian86 1.5% Other race502 8.3% Two or more races798 4.1% White alone, not Hispanic / Latino694 7.5% Hispanic or LatinoMoved from different state 842 4.4% White / Caucasian75 0.8% Black or African American53 1.4% Asian37 0.6% Other race296 4.9% Two or more races703 3.6% White alone, not Hispanic / Latino230 2.5% Hispanic or LatinoMoved from abroad 8 0.0% White37 0.4% Black or African American167 4.4% Asian95 1.6% Other race11 0.1% White alone, not Hispanic / Latino63 0.7% Hispanic or Latino
Children Nativity (place of birth) in Lake Ridge
Children under 6 years - Living with two parents Both parents native 1,029 98.7% Native14 1.3% Foreign-bornBoth parents foreign-born 477 91.8% Native43 8.2% Foreign-bornOne native, one foreign-born parent 442 100.0% NativeChildren under 6 years - Living with one parent Native parent 696 100.0% NativeForeign-born parent 123 100.0% NativeChildren 6 to 17 years - Living with two parents Both parents native 2,533 100.0% NativeBoth parents foreign-born 1,088 72.5% Native412 27.5% Foreign-bornOne native, one foreign-born parent 750 99.5% Native4 0.5% Foreign-bornChildren 6 to 17 years - Living with one parent Native parent 1,100 100.0% NativeForeign-born parent 1,257 50.3% Native1,242 49.7% Foreign-born
Grandparents responsible for own grandchildren in Lake Ridge
Grandparents (30 to 59 years) White / Caucasian 82 44.5% Responsible for grandchildren102 55.5% Not responsible for grandchildrenBlack or African American 8 3.2% Responsible for grandchildren252 96.8% Not responsible for grandchildrenOther race 174 100.0% Not responsible for grandchildrenTwo or more races 72 100.0% Not responsible for grandchildrenWhite alone, not Hispanic / Latino 56 34.3% Responsible for grandchildren107 65.7% Not responsible for grandchildrenHispanic or Latino 48 22.8% Responsible for grandchildren164 77.2% Not responsible for grandchildrenGrandparents (60 years and over) White / Caucasian 25 7.3% Responsible for grandchildren316 92.7% Not responsible for grandchildrenBlack or African American 101 66.8% Responsible for grandchildren50 33.2% Not responsible for grandchildrenOther race 23 100.0% Not responsible for grandchildrenTwo or more races 6 26.0% Responsible for grandchildren17 74.0% Not responsible for grandchildrenWhite alone, not Hispanic / Latino 29 8.0% Responsible for grandchildren332 92.0% Not responsible for grandchildrenHispanic or Latino 7 8.2% Responsible for grandchildren76 91.8% Not responsible for grandchildren