Races in Lake Ronkonkoma, New York (NY) Detailed Stats
Data:
Races - White alone (%)
Races - White alone (% change since 2000)
Races - Black alone (%)
Races - Black alone (% change since 2000)
Races - American Indian alone (%)
Races - American Indian alone (% change since 2000)
Races - Asian alone (%)
Races - Asian alone (% change since 2000)
Races - Hispanic (%)
Races - Hispanic (% change since 2000)
Races - Native Hawaiian and Other Pacific Islander alone (%)
Races - Native Hawaiian and Other Pacific Islander alone (% change since 2000)
Races - Two or more races(%)
Races - Two or more races(% change since 2000)
Races - Other race alone (%)
Races - Other race alone (% change since 2000)
Racial diversity
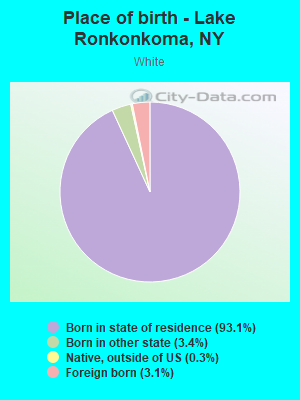
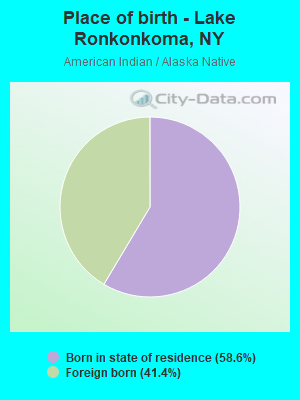
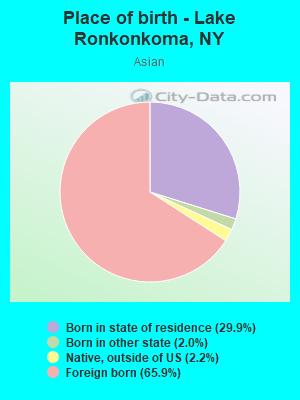
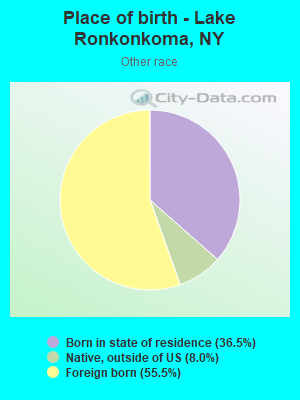
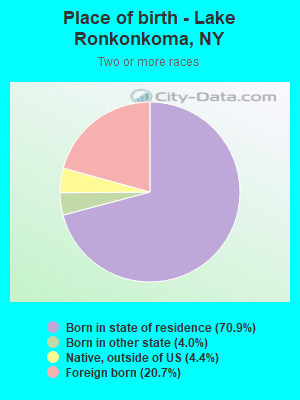
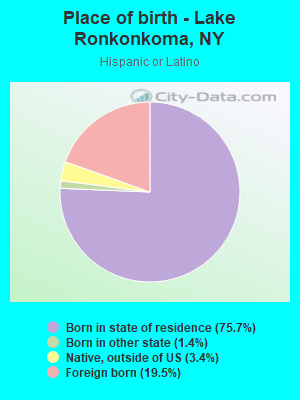
Place of birth - Born in state of residence (%)
Place of birth - Born in state of residence (%) - White
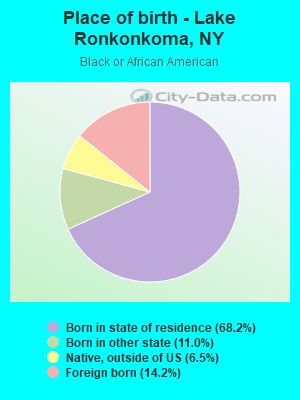
Place of birth - Born in state of residence (%) - Black or African American
Place of birth - Born in state of residence (%) - Asian
Place of birth - Born in state of residence (%) - Hispanic or Latino
Place of birth - Born in state of residence (%) - American Indian and Alaska Native
Place of birth - Born in state of residence (%) - Multirace
Place of birth - Born in state of residence (%) - Other Race
Place of birth - Born in other state (%)
Place of birth - Born in other state (%) - White
Place of birth - Born in other state (%) - Black or African American
Place of birth - Born in other state (%) - Asian
Place of birth - Born in other state (%) - Hispanic or Latino
Place of birth - Born in other state (%) - American Indian and Alaska Native
Place of birth - Born in other state (%) - Multirace
Place of birth - Born in other state (%) - Other Race
Place of birth - Native, outside of US (%)
Place of birth - Native, outside of US (%) - White
Place of birth - Native, outside of US (%) - Black or African American
Place of birth - Native, outside of US (%) - Asian
Place of birth - Native, outside of US (%) - Hispanic or Latino
Place of birth - Native, outside of US (%) - American Indian and Alaska Native
Place of birth - Native, outside of US (%) - Multirace
Place of birth - Native, outside of US (%) - Other Race
Place of birth - Foreign born (%)
Place of birth - Foreign born (%) - White
Place of birth - Foreign born (%) - Black or African American
Place of birth - Foreign born (%) - Asian
Place of birth - Foreign born (%) - Hispanic or Latino
Place of birth - Foreign born (%) - American Indian and Alaska Native
Place of birth - Foreign born (%) - Multirace
Place of birth - Foreign born (%) - Other Race
Residents speaking English at home (%)
Residents speaking English at home - Born in the United States (%)
Residents speaking English at home - Native, born elsewhere (%)
Residents speaking English at home - Foreign born (%)
Residents speaking Spanish at home (%)
Residents speaking Spanish at home - Born in the United States (%)
Residents speaking Spanish at home - Native, born elsewhere (%)
Residents speaking Spanish at home - Foreign born (%)
Residents speaking other language at home (%)
Residents speaking other language at home - Born in the United States (%)
Residents speaking other language at home - Native, born elsewhere (%)
Residents speaking other language at home - Foreign born (%)
Marital status - Never married (%)
Marital status - Now married (%)
Marital status - Separated (%)
Marital status - Widowed (%)
Marital status - Divorced (%)
Ancestries Reported - Arab (%)
Ancestries Reported - Czech (%)
Ancestries Reported - Danish (%)
Ancestries Reported - Dutch (%)
Ancestries Reported - English (%)
Ancestries Reported - French (%)
Ancestries Reported - French Canadian (%)
Ancestries Reported - German (%)
Ancestries Reported - Greek (%)
Ancestries Reported - Hungarian (%)
Ancestries Reported - Irish (%)
Ancestries Reported - Italian (%)
Ancestries Reported - Lithuanian (%)
Ancestries Reported - Norwegian (%)
Ancestries Reported - Polish (%)
Ancestries Reported - Portuguese (%)
Ancestries Reported - Russian (%)
Ancestries Reported - Scotch-Irish (%)
Ancestries Reported - Scottish (%)
Ancestries Reported - Slovak (%)
Ancestries Reported - Subsaharan African (%)
Ancestries Reported - Swedish (%)
Ancestries Reported - Swiss (%)
Ancestries Reported - Ukrainian (%)
Ancestries Reported - United States (%)
Ancestries Reported - Welsh (%)
Ancestries Reported - West Indian (%)
Ancestries Reported - Other (%)
Geographical mobility - Same house 1 year ago (%)
Geographical mobility - Same house 1 year ago (%) - White
Geographical mobility - Same house 1 year ago (%) - Black or African American
Geographical mobility - Same house 1 year ago (%) - Asian
Geographical mobility - Same house 1 year ago (%) - Hispanic or Latino
Geographical mobility - Same house 1 year ago (%) - American Indian and Alaska Native
Geographical mobility - Same house 1 year ago (%) - Multirace
Geographical mobility - Same house 1 year ago (%) - Other Race
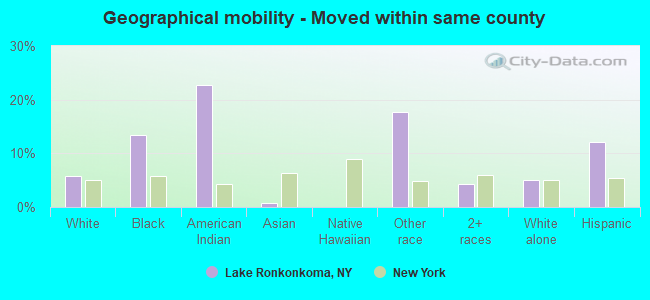
Geographical mobility - Moved within same county (%)
Geographical mobility - Moved within same county (%) - White
Geographical mobility - Moved within same county (%) - Black or African American
Geographical mobility - Moved within same county (%) - Asian
Geographical mobility - Moved within same county (%) - Hispanic or Latino
Geographical mobility - Moved within same county (%) - American Indian and Alaska Native
Geographical mobility - Moved within same county (%) - Multirace
Geographical mobility - Moved within same county (%) - Other Race
Geographical mobility - Moved from different county within same state (%)
Geographical mobility - Moved from different county within same state (%) - White
Geographical mobility - Moved from different county within same state (%) - Black or African American
Geographical mobility - Moved from different county within same state (%) - Asian
Geographical mobility - Moved from different county within same state (%) - Hispanic or Latino
Geographical mobility - Moved from different county within same state (%) - American Indian and Alaska Native
Geographical mobility - Moved from different county within same state (%) - Multirace
Geographical mobility - Moved from different county within same state (%) - Other Race
Geographical mobility - Moved from different state (%)
Geographical mobility - Moved from different state (%) - White
Geographical mobility - Moved from different state (%) - Black or African American
Geographical mobility - Moved from different state (%) - Asian
Geographical mobility - Moved from different state (%) - Hispanic or Latino
Geographical mobility - Moved from different state (%) - American Indian and Alaska Native
Geographical mobility - Moved from different state (%) - Multirace
Geographical mobility - Moved from different state (%) - Other Race
Geographical mobility - Moved from abroad (%)
Geographical mobility - Moved from abroad (%) - White
Geographical mobility - Moved from abroad (%) - Black or African American
Geographical mobility - Moved from abroad (%) - Asian
Geographical mobility - Moved from abroad (%) - Hispanic or Latino
Geographical mobility - Moved from abroad (%) - American Indian and Alaska Native
Geographical mobility - Moved from abroad (%) - Multirace
Geographical mobility - Moved from abroad (%) - Other Race
Place of birth for the foreign-born population - Ireland (%)
Place of birth for the foreign-born population - Denmark (%)
Place of birth for the foreign-born population - Norway (%)
Place of birth for the foreign-born population - Sweden (%)
Place of birth for the foreign-born population - United Kingdom (%)
Place of birth for the foreign-born population - England (%)
Place of birth for the foreign-born population - Scotland (%)
Place of birth for the foreign-born population - Other Northern Europe (%)
Place of birth for the foreign-born population - Austria (%)
Place of birth for the foreign-born population - Belgium (%)
Place of birth for the foreign-born population - France (%)
Place of birth for the foreign-born population - Germany (%)
Place of birth for the foreign-born population - Netherlands (%)
Place of birth for the foreign-born population - Switzerland (%)
Place of birth for the foreign-born population - Other Western Europe (%)
Place of birth for the foreign-born population - Greece (%)
Place of birth for the foreign-born population - Italy (%)
Place of birth for the foreign-born population - Portugal (%)
Place of birth for the foreign-born population - Spain (%)
Place of birth for the foreign-born population - Other Southern Europe (%)
Place of birth for the foreign-born population - Albania (%)
Place of birth for the foreign-born population - Belarus (%)
Place of birth for the foreign-born population - Bosnia and Herzegovina (%)
Place of birth for the foreign-born population - Bulgaria (%)
Place of birth for the foreign-born population - Croatia (%)
Place of birth for the foreign-born population - Czechoslovakia (%)
Place of birth for the foreign-born population - Hungary (%)
Place of birth for the foreign-born population - Latvia (%)
Place of birth for the foreign-born population - Lithuania (%)
Place of birth for the foreign-born population - North Macedonia (Macedonia) (%)
Place of birth for the foreign-born population - Moldova (%)
Place of birth for the foreign-born population - Poland (%)
Place of birth for the foreign-born population - Romania (%)
Place of birth for the foreign-born population - Russia (%)
Place of birth for the foreign-born population - Serbia (%)
Place of birth for the foreign-born population - Ukraine (%)
Place of birth for the foreign-born population - Other Eastern Europe (%)
Place of birth for the foreign-born population - China (%)
Place of birth for the foreign-born population - Hong Kong (%)
Place of birth for the foreign-born population - Taiwan (%)
Place of birth for the foreign-born population - Japan (%)
Place of birth for the foreign-born population - Korea (%)
Place of birth for the foreign-born population - Other Eastern Asia (%)
Place of birth for the foreign-born population - Afghanistan (%)
Place of birth for the foreign-born population - Bangladesh (%)
Place of birth for the foreign-born population - India (%)
Place of birth for the foreign-born population - Iran (%)
Place of birth for the foreign-born population - Kazakhstan (%)
Place of birth for the foreign-born population - Nepal (%)
Place of birth for the foreign-born population - Pakistan (%)
Place of birth for the foreign-born population - Sri Lanka (%)
Place of birth for the foreign-born population - Uzbekistan (%)
Place of birth for the foreign-born population - Other South Central Asia (%)
Place of birth for the foreign-born population - Burma (%)
Place of birth for the foreign-born population - Cambodia (%)
Place of birth for the foreign-born population - Indonesia (%)
Place of birth for the foreign-born population - Laos (%)
Place of birth for the foreign-born population - Malaysia (%)
Place of birth for the foreign-born population - Philippines (%)
Place of birth for the foreign-born population - Singapore (%)
Place of birth for the foreign-born population - Thailand (%)
Place of birth for the foreign-born population - Vietnam (%)
Place of birth for the foreign-born population - Other South Eastern Asia (%)
Place of birth for the foreign-born population - Armenia (%)
Place of birth for the foreign-born population - Iraq (%)
Place of birth for the foreign-born population - Israel (%)
Place of birth for the foreign-born population - Jordan (%)
Place of birth for the foreign-born population - Kuwait (%)
Place of birth for the foreign-born population - Lebanon (%)
Place of birth for the foreign-born population - Saudi Arabia (%)
Place of birth for the foreign-born population - Syria (%)
Place of birth for the foreign-born population - Turkey (%)
Place of birth for the foreign-born population - Yemen (%)
Place of birth for the foreign-born population - Other Western Asia (%)
Place of birth for the foreign-born population - Eritrea (%)
Place of birth for the foreign-born population - Ethiopia (%)
Place of birth for the foreign-born population - Kenya (%)
Place of birth for the foreign-born population - Somalia (%)
Place of birth for the foreign-born population - Uganda (%)
Place of birth for the foreign-born population - Zimbabwe (%)
Place of birth for the foreign-born population - Other Eastern Africa (%)
Place of birth for the foreign-born population - Cameroon (%)
Place of birth for the foreign-born population - Congo (%)
Place of birth for the foreign-born population - Democratic Republic of Congo (Zaire) (%)
Place of birth for the foreign-born population - Other Middle Africa (%)
Place of birth for the foreign-born population - Egypt (%)
Place of birth for the foreign-born population - Morocco (%)
Place of birth for the foreign-born population - Sudan (%)
Place of birth for the foreign-born population - Other Northern Africa (%)
Place of birth for the foreign-born population - South Africa (%)
Place of birth for the foreign-born population - Other Southern Africa (%)
Place of birth for the foreign-born population - Cabo Verde (%)
Place of birth for the foreign-born population - Ghana (%)
Place of birth for the foreign-born population - Liberia (%)
Place of birth for the foreign-born population - Nigeria (%)
Place of birth for the foreign-born population - Senegal (%)
Place of birth for the foreign-born population - Sierra Leone (%)
Place of birth for the foreign-born population - Other Western Africa (%)
Place of birth for the foreign-born population - Australia (%)
Place of birth for the foreign-born population - New Zealand (%)
Place of birth for the foreign-born population - Fiji (%)
Place of birth for the foreign-born population - Micronesia (%)
Place of birth for the foreign-born population - Bahamas (%)
Place of birth for the foreign-born population - Barbados (%)
Place of birth for the foreign-born population - Cuba (%)
Place of birth for the foreign-born population - Dominica (%)
Place of birth for the foreign-born population - Dominican Republic (%)
Place of birth for the foreign-born population - Grenada (%)
Place of birth for the foreign-born population - Haiti (%)
Place of birth for the foreign-born population - Jamaica (%)
Place of birth for the foreign-born population - St. Vincent and the Grenadines (%)
Place of birth for the foreign-born population - Trinidad and Tobago (%)
Place of birth for the foreign-born population - West Indies (%)
Place of birth for the foreign-born population - Other Caribbean (%)
Place of birth for the foreign-born population - Belize (%)
Place of birth for the foreign-born population - Costa Rica (%)
Place of birth for the foreign-born population - El Salvador (%)
Place of birth for the foreign-born population - Guatemala (%)
Place of birth for the foreign-born population - Honduras (%)
Place of birth for the foreign-born population - Mexico (%)
Place of birth for the foreign-born population - Nicaragua (%)
Place of birth for the foreign-born population - Panama (%)
Place of birth for the foreign-born population - Other Central America (%)
Place of birth for the foreign-born population - Argentina (%)
Place of birth for the foreign-born population - Bolivia (%)
Place of birth for the foreign-born population - Brazil (%)
Place of birth for the foreign-born population - Chile (%)
Place of birth for the foreign-born population - Colombia (%)
Place of birth for the foreign-born population - Ecuador (%)
Place of birth for the foreign-born population - Guyana (%)
Place of birth for the foreign-born population - Peru (%)
Place of birth for the foreign-born population - Uruguay (%)
Place of birth for the foreign-born population - Venezuela (%)
Place of birth for the foreign-born population - Other South America (%)
Place of birth for the foreign-born population - Canada (%)
Place of birth for the foreign-born population - Other Northern America (%)
Place of birth for the foreign-born population - Other (%)
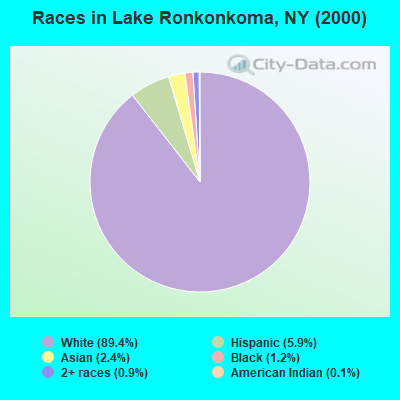
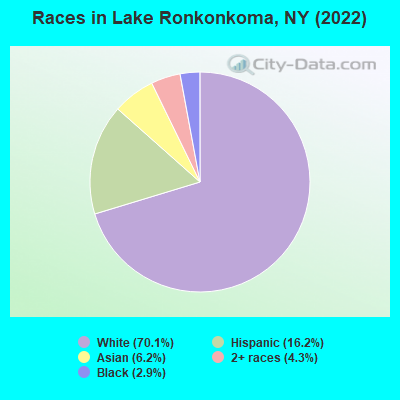
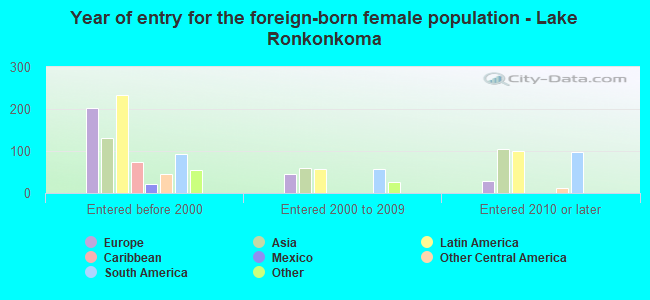
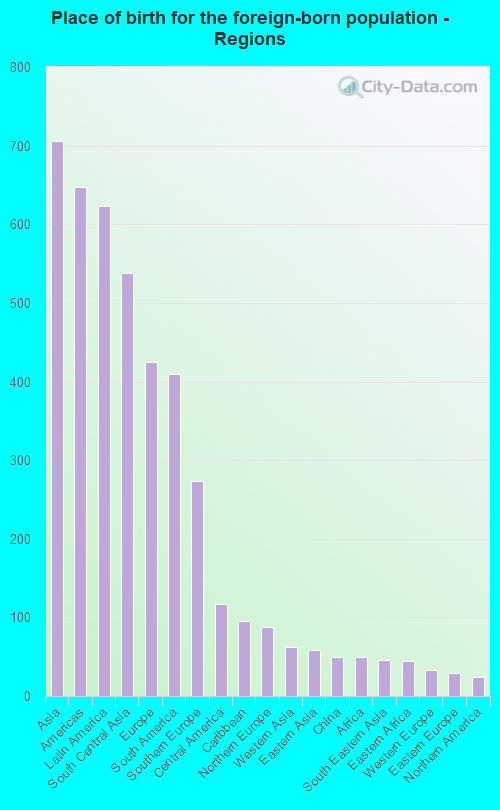
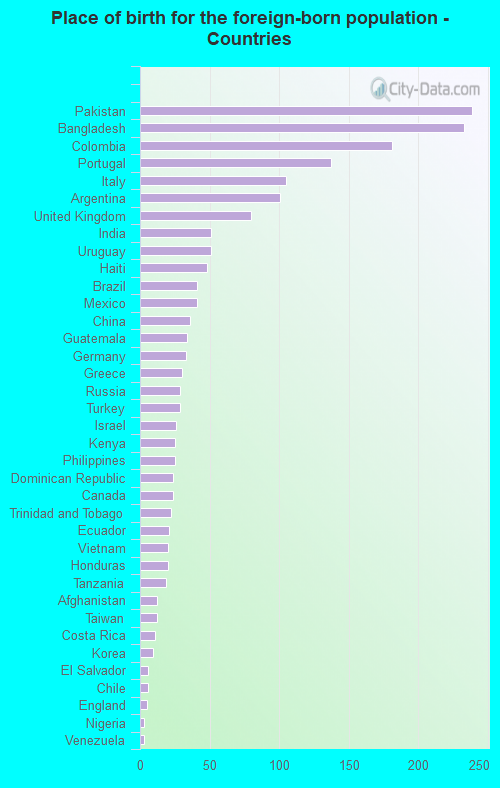
According to 2022 data, the most numerous races in Lake Ronkonkoma, NY are White alone (12,865 residents), Hispanic (2,975 residents), and Black alone (523 residents). 80.6% of Lake Ronkonkoma residents speak English at home. 10.0% of Lake Ronkonkoma, NY residents are foreign-born (3.9% born in Asia, 3.4% born in Latin America, 2.3% born in Europe), which is 120.9% less than the foreign-born rate of 22.0% across the entire state of New York.
Race distribution in Lake Ronkonkoma
2000 2022
11,760,981 62.0% White alone 2,867,583 15.1% Hispanic 2,812,623 14.8% Black alone 1,035,926 5.5% Asian alone 366,116 1.9% Two or more races 75,499 0.4% Other race alone 52,499 0.3% American Indian alone 5,230 0.03% Native Hawaiian and Other
10,408,933 52.9% White alone 3,867,299 19.7% Hispanic 2,633,840 13.4% Black alone 1,776,286 9.0% Asian alone 732,670 3.7% Two or more races 216,110 1.1% Other race alone 35,082 0.2% American Indian alone 6,931 0.04% Native Hawaiian and Other
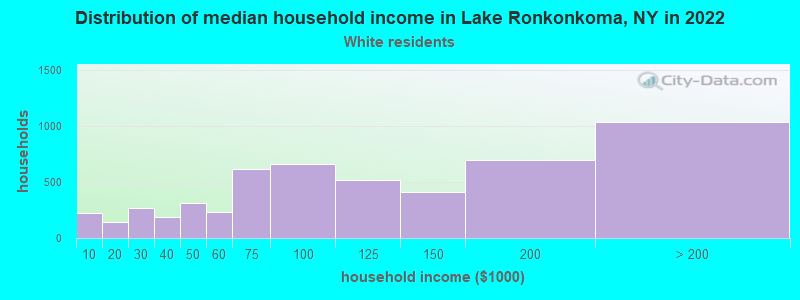
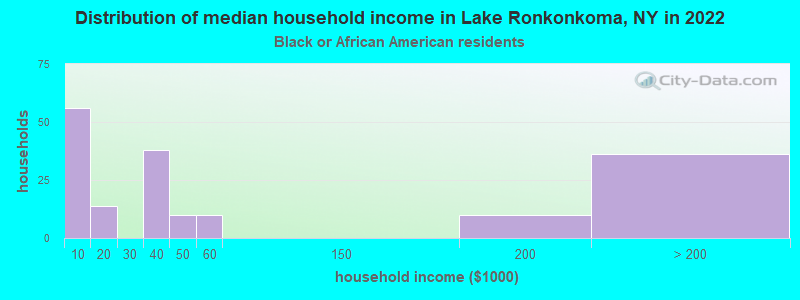
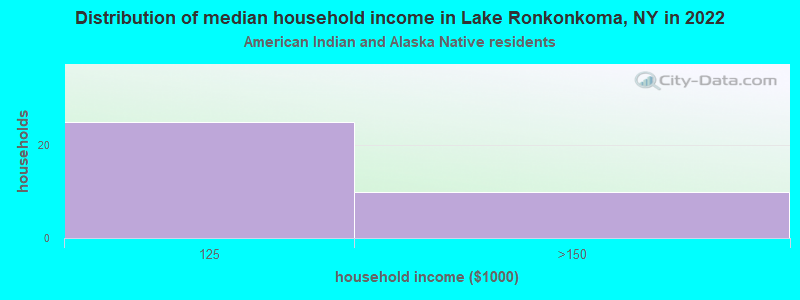
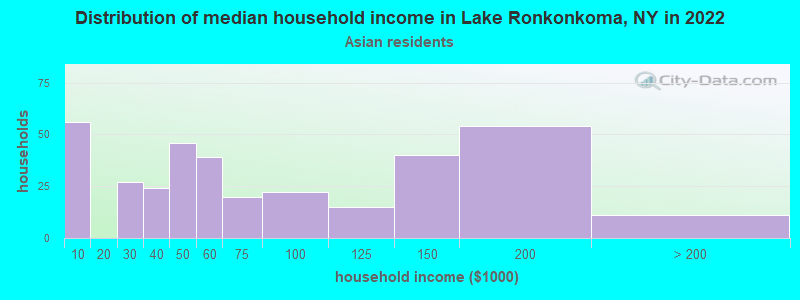
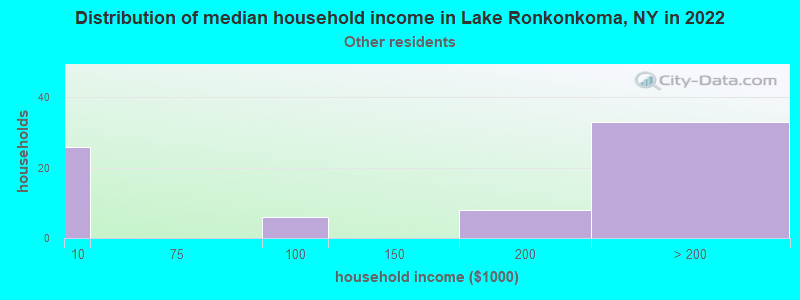
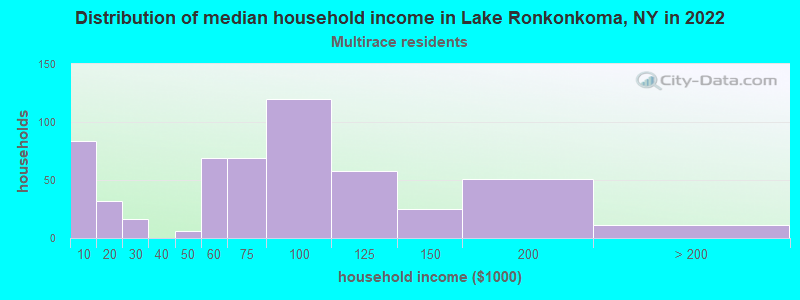
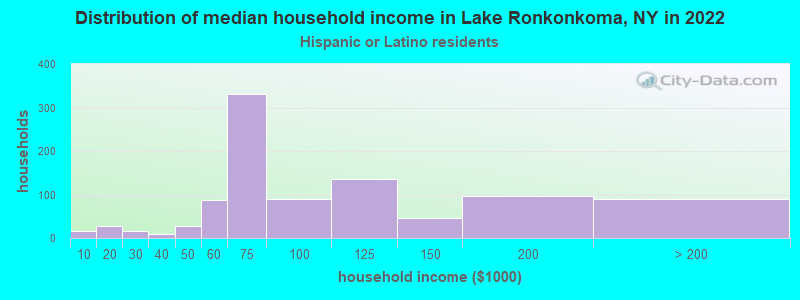
Income and house value in Lake Ronkonkoma Median household income in 2022 $102,857 White non-Hispanic householders$52,906 Asian householdersover $200,000 Some other race householders$65,446 Two or more races householders$67,356 Hispanic or Latino race householdersMedian 2022 house value $497,111 White Non-Hispanic householders$396,682 Black or African American householders$303,658 American Indian or Alaska Native householders $468,079 Asian householders$407,347 Native Hawaiian and other Pacific Islander householders$463,042 Some other race householders$503,629 Two or more races householders$466,894 Hispanic or Latino householders
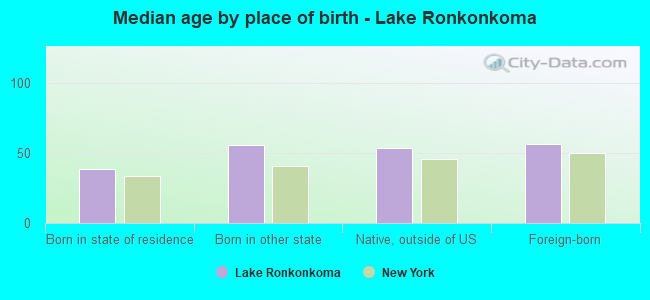
Median age by race in Lake Ronkonkoma
45.7 Median age for White residents45.7 45.6 39.4 Median age for Black or African American residents42.3 36.3 50.7 Median age for American Indian / Alaska Native residents31.5 -513,692,161.9 41.3 Median age for Asian residents41.9 41.7 -742,816,091.2 Median age for Native Hawaiian / Pacific Islander residents-831,187,409.8 -771,300,447.7 60.7 Median age for Other race residents61.6 55.2 27.6 Median age for Two or more races residents45.0 25.8 46.0 Median age for White alone residents48.1 44.2 39.7 Median age for Hispanic or Latino residents36.5 47.5
Owner/renter occupied households by race in Lake Ronkonkoma
House owners and renters - White residents 3,615 69.7% Owner occupied1,574 30.3% Renter occupiedHouse owners and renters - Black or African American residents 17 10.2% Owner occupied150 89.8% Renter occupiedHouse owners and renters - American Indian / Alaska Native residents 24 100.0% Owner occupiedHouse owners and renters - Asian residents 323 84.1% Owner occupied61 15.9% Renter occupiedHouse owners and renters - Other race residents 51 71.9% Owner occupied20 28.1% Renter occupiedHouse owners and renters - Two or more races residents 426 81.6% Owner occupied96 18.4% Renter occupiedHouse owners and renters - White alone residents 3,492 72.4% Owner occupied1,330 27.6% Renter occupiedHouse owners and renters - Hispanic or Latino residents 517 52.1% Owner occupied476 47.9% Renter occupied
Language usage in Lake Ronkonkoma
English speakers - Total 80.6% of residents of Lake Ronkonkoma speak English at home.
8.8% of residents speak Spanish at home 1,031 67.2% Speak English very well503 32.8% Speak English less than very well10.1% of residents speak other language at home 1,170 66.5% Speak English very well589 33.5% Speak English less than very well
English speakers - Born in the United States 89.2% of residents of Lake Ronkonkoma speak English at home.
7.2% of residents speak Spanish at home 41 91.1% Speak English very well4 8.9% Speak English less than very well2.9% of residents speak other language at home 13 72.2% Speak English very well5 27.8% Speak English less than very well
English speakers - Native, born elsewhere 23.0% of residents of Lake Ronkonkoma speak English at home.
43.8% of residents speak Spanish at home 40 51.3% Speak English very well38 48.7% Speak English less than very well42.7% of residents speak other language at home 76 100.0% Speak English very well
English speakers - Foreign-born 15.3% of residents of Lake Ronkonkoma speak English at home.
29.7% of residents speak Spanish at home 156 26.7% Speak English very well429 73.3% Speak English less than very well54.1% of residents speak other language at home 506 47.5% Speak English very well559 52.5% Speak English less than very well
White (Caucasian) - Speak only English Native:
94.2% (12,057)Foreign-born:
27.2% (118)
White (Caucasian) - Speak another language Native:
5.6% (716)Foreign-born:
72.0% (311)
Black or African American - Speak only English Native:
90.4% (455)Foreign-born:
36.6% (32)
Black or African American - Speak another language Native:
8.9% (45)Foreign-born:
59.9% (52)
American Indian / Alaska Native - Speak another language Native:
100.0% (42)Foreign-born:
100.0% (33)
Asian - Speak only English Native:
26.8% (78)Foreign-born:
11.7% (85)
Asian - Speak another language Native:
76.6% (223)Foreign-born:
88.2% (645)
Other race - Speak only English Native:
66.9% (66)Foreign-born:
5.9% (7)
Other race - Speak another language Native:
36.3% (36)Foreign-born:
94.5% (118)
Two or more races - Speak another language Native:
27.1% (377)Foreign-born:
100.0% (399)
White alone - Speak only English Native:
95.2% (11,341)Foreign-born:
23.8% (114)
White alone - Speak another language Native:
4.8% (574)Foreign-born:
76.2% (364)
Hispanic or Latino - Speak only English Native:
65.2% (1,372)Foreign-born:
3.8% (21)
Hispanic or Latino - Speak another language Native:
35.8% (755)Foreign-born:
96.6% (550)
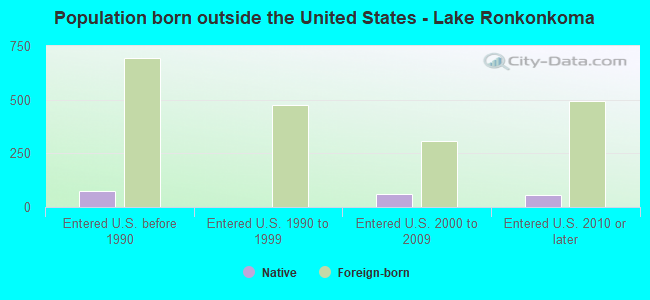
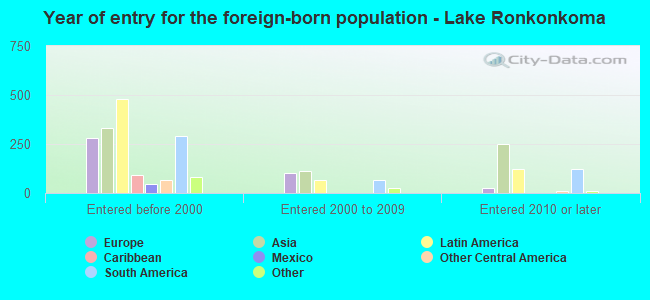
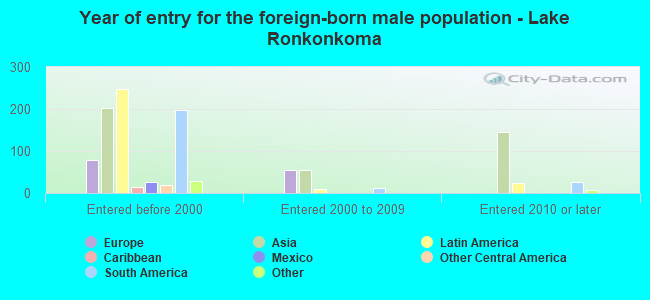
Foreign-born residents in Lake Ronkonkoma 1,828 residents are foreign born (3.9% Asia , 3.4% Latin America , 2.3% Europe ).
This city:
10.0%New York:
22.6%
Marital status for residents in Lake Ronkonkoma Marital status - White (Caucasian) population 15 years and over
Males 32.6% Never married49.3% Now married2.5% Separated4.2% Widowed11.4% DivorcedFemales 33.5% Never married44.5% Now married1.3% Separated7.4% Widowed13.3% DivorcedWomen who gave birth in the past 12 months Now married:
85.2% (90)Unmarried:
14.8% (16)
Women who did not give birth in the past 12 months Now married:
42.5% (1,136)Unmarried:
57.5% (1,537)
Marital status - Black or African American population 15 years and over
Males 70.5% Never married13.7% Now married0.0% Separated0.0% Widowed15.9% DivorcedFemales 59.0% Never married6.1% Now married9.4% Separated0.0% Widowed25.4% DivorcedWomen who gave birth in the past 12 months Now married:
0.0% (0)Unmarried:
100.0% (9)
Women who did not give birth in the past 12 months Now married:
14.7% (23)Unmarried:
85.3% (132)
Marital status - American Indian / Alaska Native population 15 years and over
Males 40.5% Never married59.5% Now married0.0% Separated0.0% Widowed0.0% DivorcedFemales 0.0% Never married100.0% Now married0.0% Separated0.0% Widowed0.0% DivorcedWomen who did not give birth in the past 12 months Now married:
100.0% (3)Unmarried:
0.0% (0)
Marital status - Asian population 15 years and over
Males 27.1% Never married70.7% Now married0.0% Separated0.0% Widowed2.2% DivorcedFemales 31.3% Never married60.9% Now married0.0% Separated2.7% Widowed5.2% DivorcedWomen who gave birth in the past 12 months Now married:
100.0% (7)Unmarried:
0.0% (0)
Women who did not give birth in the past 12 months Now married:
51.6% (181)Unmarried:
48.4% (170)
Marital status - Other race population 15 years and over
Males 17.6% Never married51.5% Now married0.0% Separated0.0% Widowed30.9% DivorcedFemales 13.9% Never married83.5% Now married0.0% Separated0.0% Widowed2.5% DivorcedWomen who did not give birth in the past 12 months Now married:
65.6% (31)Unmarried:
34.4% (16)
Marital status - Two or more races population 15 years and over
Males 41.8% Never married58.2% Now married0.0% Separated0.0% Widowed0.0% DivorcedFemales 50.5% Never married30.2% Now married2.6% Separated4.2% Widowed12.5% DivorcedWomen who did not give birth in the past 12 months Now married:
11.8% (61)Unmarried:
88.2% (461)
Marital status - White alone, not Hispanic / Latino population 15 years and over
Males 31.5% Never married49.1% Now married2.6% Separated4.5% Widowed12.3% DivorcedFemales 30.6% Never married46.6% Now married1.4% Separated7.9% Widowed13.4% DivorcedWomen who gave birth in the past 12 months Now married:
80.4% (69)Unmarried:
19.6% (17)
Women who did not give birth in the past 12 months Now married:
42.7% (1,154)Unmarried:
57.3% (1,550)
Marital status - Hispanic or Latino population 15 years and over
Males 41.4% Never married54.2% Now married1.0% Separated0.5% Widowed2.8% DivorcedFemales 49.9% Never married33.8% Now married1.3% Separated3.0% Widowed12.1% DivorcedWomen who gave birth in the past 12 months Now married:
100.0% (31)Unmarried:
0.0% (0)
Women who did not give birth in the past 12 months Now married:
29.7% (134)Unmarried:
70.3% (317)
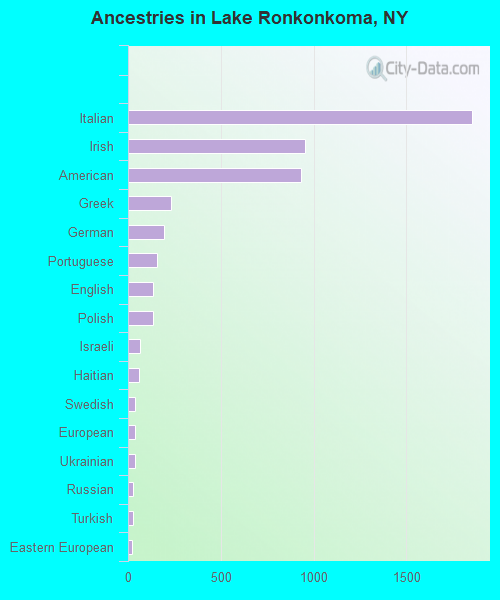
Ancestries in Lake Ronkonkoma
1,853 23.2% Italian953 11.9% Irish930 11.6% American232 2.9% Greek192 2.4% German158 2.0% Portuguese135 1.7% English134 1.7% Polish66 0.8% Israeli61 0.8% Haitian39 0.5% Swedish37 0.5% European37 0.5% Ukrainian26 0.3% Russian26 0.3% Turkish23 0.3% Eastern European15 0.2% Czech15 0.2% Lithuanian14 0.2% Afghan13 0.2% Hungarian12 0.2% Brazilian12 0.2% Finnish12 0.2% Jamaican11 0.1% Cypriot10 0.1% Norwegian10 0.1% Swiss9 0.1% Dutch8 0.1% British6 0.08% French Canadian4 0.05% Nigerian2 0.03% Scotch-Irish
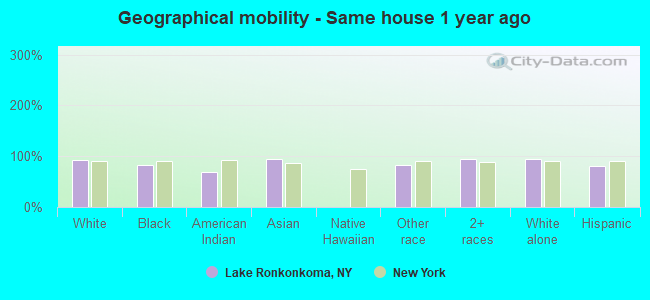
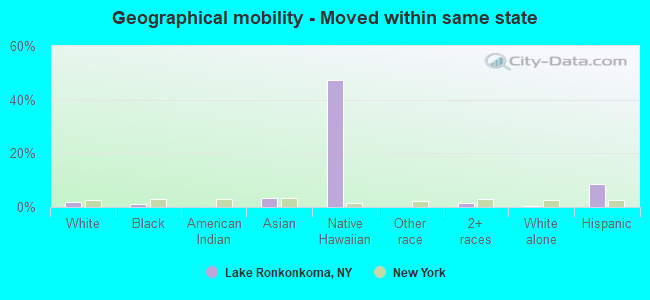
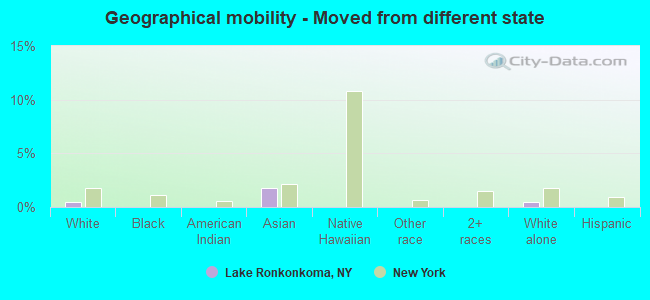
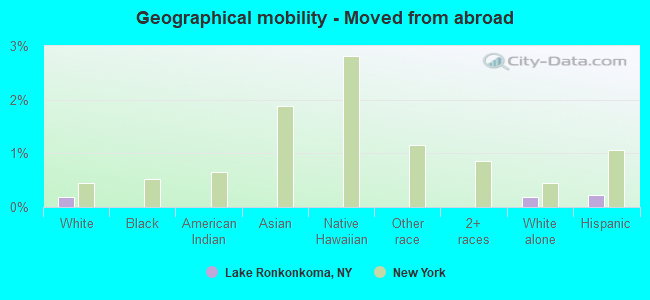
Geographical mobility in Lake Ronkonkoma Same house 1 year ago 12,444 91.8% White (Caucasian)496 82.7% Black or African American42 68.2% American Indian / Alaska Native1,056 94.5% Asian185 83.5% Other race1,850 94.7% Two or more races11,987 93.8% White alone, not Hispanic / Latino2,359 80.6% Hispanic or LatinoMoved within same county 791 5.8% White / Caucasian81 13.4% Black or African American14 22.7% American Indian / Alaska Native8 0.7% Asian39 17.6% Other race82 4.2% Two or more races642 5.0% White alone, not Hispanic / Latino357 12.2% Hispanic or LatinoMoved within same state 231 1.7% White / Caucasian7 1.1% Black or African American36 3.2% Asian4 47.4% Native Hawaiian / Pacific Islander26 1.3% Two or more races66 0.5% White alone, not Hispanic / Latino251 8.6% Hispanic or LatinoMoved from different state 62 0.5% White / Caucasian20 1.8% Asian65 0.5% White alone, not Hispanic / LatinoMoved from abroad 24 0.2% White24 0.2% White alone, not Hispanic / Latino7 0.2% Hispanic or Latino
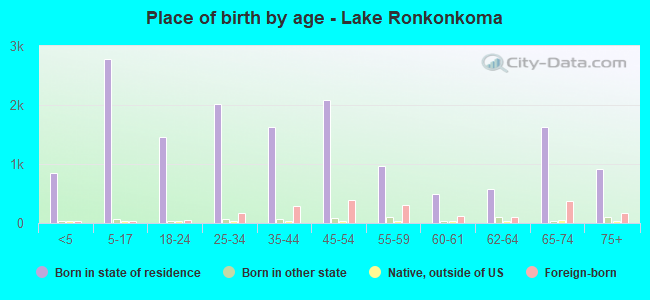
Children Nativity (place of birth) in Lake Ronkonkoma
Children under 6 years - Living with two parents Both parents native 622 99.0% Native7 1.0% Foreign-bornBoth parents foreign-born 50 84.1% Native9 15.9% Foreign-bornOne native, one foreign-born parent 16 100.0% NativeChildren under 6 years - Living with one parent Native parent 384 100.0% NativeForeign-born parent 14 100.0% NativeChildren 6 to 17 years - Living with two parents Both parents native 1,638 100.0% Native0 0.0% Foreign-bornBoth parents foreign-born 144 85.6% Native24 14.4% Foreign-bornOne native, one foreign-born parent 58 100.0% NativeChildren 6 to 17 years - Living with one parent Native parent 456 100.0% NativeForeign-born parent 82 51.5% Native77 48.5% Foreign-born
Grandparents responsible for own grandchildren in Lake Ronkonkoma
Grandparents (30 to 59 years) White / Caucasian 77 53.1% Responsible for grandchildren68 46.9% Not responsible for grandchildrenTwo or more races 19 100.0% Responsible for grandchildrenWhite alone, not Hispanic / Latino 75 49.2% Responsible for grandchildren77 50.8% Not responsible for grandchildrenGrandparents (60 years and over) White / Caucasian 70 26.7% Responsible for grandchildren192 73.3% Not responsible for grandchildrenWhite alone, not Hispanic / Latino 57 22.3% Responsible for grandchildren198 77.7% Not responsible for grandchildren