Races in Lake St. Louis, Missouri (MO) Detailed Stats
Data:
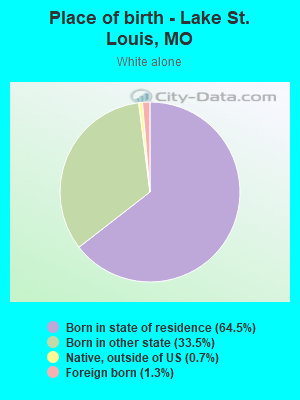
Races - White alone (%)
Races - White alone (% change since 2000)
Races - Black alone (%)
Races - Black alone (% change since 2000)
Races - American Indian alone (%)
Races - American Indian alone (% change since 2000)
Races - Asian alone (%)
Races - Asian alone (% change since 2000)
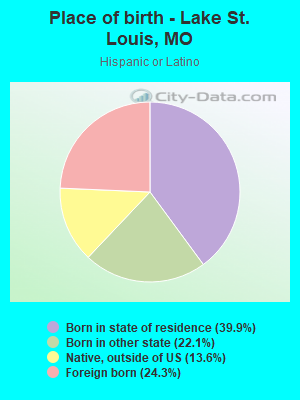
Races - Hispanic (%)
Races - Hispanic (% change since 2000)
Races - Native Hawaiian and Other Pacific Islander alone (%)
Races - Native Hawaiian and Other Pacific Islander alone (% change since 2000)
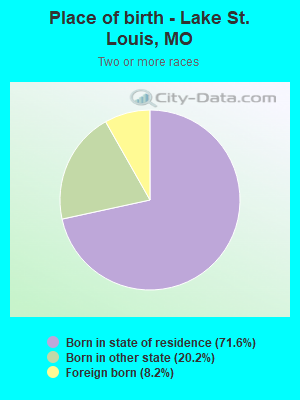
Races - Two or more races(%)
Races - Two or more races(% change since 2000)
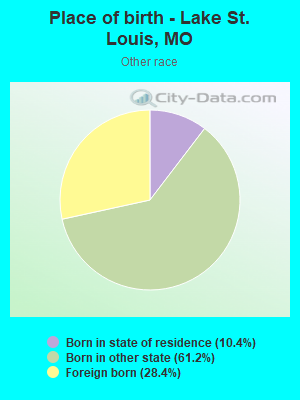
Races - Other race alone (%)
Races - Other race alone (% change since 2000)
Racial diversity
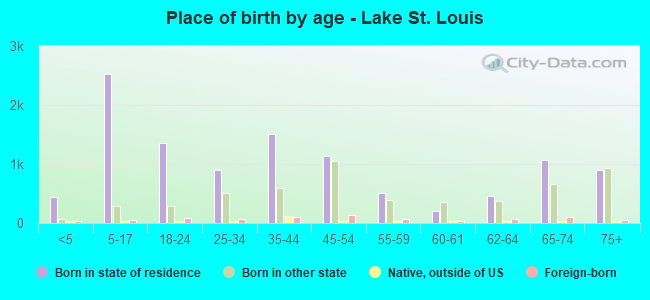
Place of birth - Born in state of residence (%)
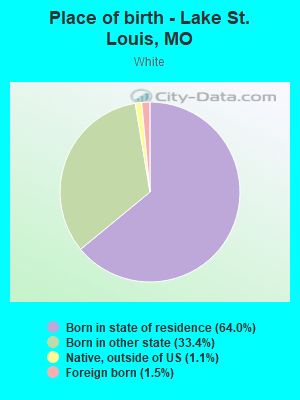
Place of birth - Born in state of residence (%) - White
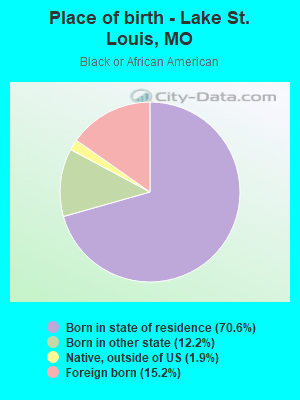
Place of birth - Born in state of residence (%) - Black or African American
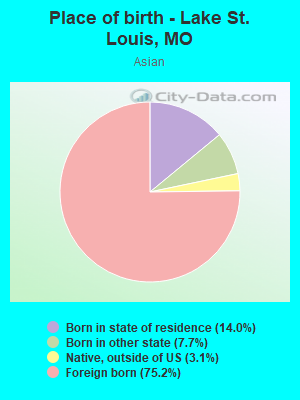
Place of birth - Born in state of residence (%) - Asian
Place of birth - Born in state of residence (%) - Hispanic or Latino
Place of birth - Born in state of residence (%) - American Indian and Alaska Native
Place of birth - Born in state of residence (%) - Multirace
Place of birth - Born in state of residence (%) - Other Race
Place of birth - Born in other state (%)
Place of birth - Born in other state (%) - White
Place of birth - Born in other state (%) - Black or African American
Place of birth - Born in other state (%) - Asian
Place of birth - Born in other state (%) - Hispanic or Latino
Place of birth - Born in other state (%) - American Indian and Alaska Native
Place of birth - Born in other state (%) - Multirace
Place of birth - Born in other state (%) - Other Race
Place of birth - Native, outside of US (%)
Place of birth - Native, outside of US (%) - White
Place of birth - Native, outside of US (%) - Black or African American
Place of birth - Native, outside of US (%) - Asian
Place of birth - Native, outside of US (%) - Hispanic or Latino
Place of birth - Native, outside of US (%) - American Indian and Alaska Native
Place of birth - Native, outside of US (%) - Multirace
Place of birth - Native, outside of US (%) - Other Race
Place of birth - Foreign born (%)
Place of birth - Foreign born (%) - White
Place of birth - Foreign born (%) - Black or African American
Place of birth - Foreign born (%) - Asian
Place of birth - Foreign born (%) - Hispanic or Latino
Place of birth - Foreign born (%) - American Indian and Alaska Native
Place of birth - Foreign born (%) - Multirace
Place of birth - Foreign born (%) - Other Race
Residents speaking English at home (%)
Residents speaking English at home - Born in the United States (%)
Residents speaking English at home - Native, born elsewhere (%)
Residents speaking English at home - Foreign born (%)
Residents speaking Spanish at home (%)
Residents speaking Spanish at home - Born in the United States (%)
Residents speaking Spanish at home - Native, born elsewhere (%)
Residents speaking Spanish at home - Foreign born (%)
Residents speaking other language at home (%)
Residents speaking other language at home - Born in the United States (%)
Residents speaking other language at home - Native, born elsewhere (%)
Residents speaking other language at home - Foreign born (%)
Marital status - Never married (%)
Marital status - Now married (%)
Marital status - Separated (%)
Marital status - Widowed (%)
Marital status - Divorced (%)
Ancestries Reported - Arab (%)
Ancestries Reported - Czech (%)
Ancestries Reported - Danish (%)
Ancestries Reported - Dutch (%)
Ancestries Reported - English (%)
Ancestries Reported - French (%)
Ancestries Reported - French Canadian (%)
Ancestries Reported - German (%)
Ancestries Reported - Greek (%)
Ancestries Reported - Hungarian (%)
Ancestries Reported - Irish (%)
Ancestries Reported - Italian (%)
Ancestries Reported - Lithuanian (%)
Ancestries Reported - Norwegian (%)
Ancestries Reported - Polish (%)
Ancestries Reported - Portuguese (%)
Ancestries Reported - Russian (%)
Ancestries Reported - Scotch-Irish (%)
Ancestries Reported - Scottish (%)
Ancestries Reported - Slovak (%)
Ancestries Reported - Subsaharan African (%)
Ancestries Reported - Swedish (%)
Ancestries Reported - Swiss (%)
Ancestries Reported - Ukrainian (%)
Ancestries Reported - United States (%)
Ancestries Reported - Welsh (%)
Ancestries Reported - West Indian (%)
Ancestries Reported - Other (%)
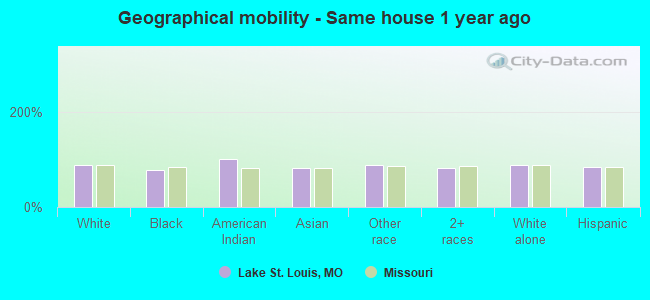
Geographical mobility - Same house 1 year ago (%)
Geographical mobility - Same house 1 year ago (%) - White
Geographical mobility - Same house 1 year ago (%) - Black or African American
Geographical mobility - Same house 1 year ago (%) - Asian
Geographical mobility - Same house 1 year ago (%) - Hispanic or Latino
Geographical mobility - Same house 1 year ago (%) - American Indian and Alaska Native
Geographical mobility - Same house 1 year ago (%) - Multirace
Geographical mobility - Same house 1 year ago (%) - Other Race
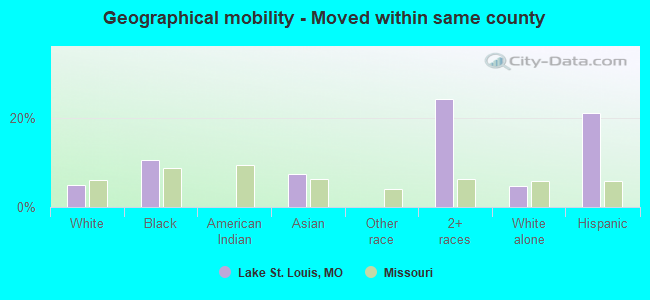
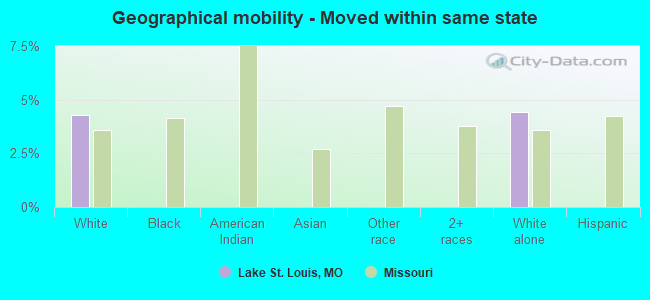
Geographical mobility - Moved within same county (%)
Geographical mobility - Moved within same county (%) - White
Geographical mobility - Moved within same county (%) - Black or African American
Geographical mobility - Moved within same county (%) - Asian
Geographical mobility - Moved within same county (%) - Hispanic or Latino
Geographical mobility - Moved within same county (%) - American Indian and Alaska Native
Geographical mobility - Moved within same county (%) - Multirace
Geographical mobility - Moved within same county (%) - Other Race
Geographical mobility - Moved from different county within same state (%)
Geographical mobility - Moved from different county within same state (%) - White
Geographical mobility - Moved from different county within same state (%) - Black or African American
Geographical mobility - Moved from different county within same state (%) - Asian
Geographical mobility - Moved from different county within same state (%) - Hispanic or Latino
Geographical mobility - Moved from different county within same state (%) - American Indian and Alaska Native
Geographical mobility - Moved from different county within same state (%) - Multirace
Geographical mobility - Moved from different county within same state (%) - Other Race
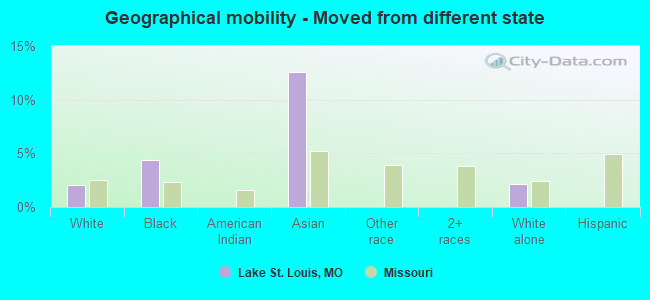
Geographical mobility - Moved from different state (%)
Geographical mobility - Moved from different state (%) - White
Geographical mobility - Moved from different state (%) - Black or African American
Geographical mobility - Moved from different state (%) - Asian
Geographical mobility - Moved from different state (%) - Hispanic or Latino
Geographical mobility - Moved from different state (%) - American Indian and Alaska Native
Geographical mobility - Moved from different state (%) - Multirace
Geographical mobility - Moved from different state (%) - Other Race
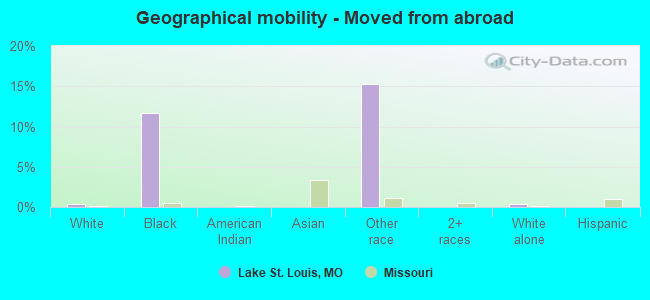
Geographical mobility - Moved from abroad (%)
Geographical mobility - Moved from abroad (%) - White
Geographical mobility - Moved from abroad (%) - Black or African American
Geographical mobility - Moved from abroad (%) - Asian
Geographical mobility - Moved from abroad (%) - Hispanic or Latino
Geographical mobility - Moved from abroad (%) - American Indian and Alaska Native
Geographical mobility - Moved from abroad (%) - Multirace
Geographical mobility - Moved from abroad (%) - Other Race
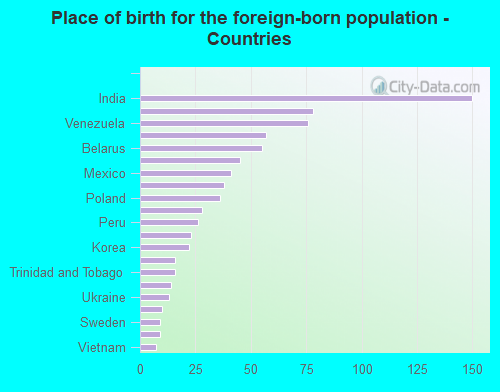
Place of birth for the foreign-born population - Ireland (%)
Place of birth for the foreign-born population - Denmark (%)
Place of birth for the foreign-born population - Norway (%)
Place of birth for the foreign-born population - Sweden (%)
Place of birth for the foreign-born population - United Kingdom (%)
Place of birth for the foreign-born population - England (%)
Place of birth for the foreign-born population - Scotland (%)
Place of birth for the foreign-born population - Other Northern Europe (%)
Place of birth for the foreign-born population - Austria (%)
Place of birth for the foreign-born population - Belgium (%)
Place of birth for the foreign-born population - France (%)
Place of birth for the foreign-born population - Germany (%)
Place of birth for the foreign-born population - Netherlands (%)
Place of birth for the foreign-born population - Switzerland (%)
Place of birth for the foreign-born population - Other Western Europe (%)
Place of birth for the foreign-born population - Greece (%)
Place of birth for the foreign-born population - Italy (%)
Place of birth for the foreign-born population - Portugal (%)
Place of birth for the foreign-born population - Spain (%)
Place of birth for the foreign-born population - Other Southern Europe (%)
Place of birth for the foreign-born population - Albania (%)
Place of birth for the foreign-born population - Belarus (%)
Place of birth for the foreign-born population - Bosnia and Herzegovina (%)
Place of birth for the foreign-born population - Bulgaria (%)
Place of birth for the foreign-born population - Croatia (%)
Place of birth for the foreign-born population - Czechoslovakia (%)
Place of birth for the foreign-born population - Hungary (%)
Place of birth for the foreign-born population - Latvia (%)
Place of birth for the foreign-born population - Lithuania (%)
Place of birth for the foreign-born population - North Macedonia (Macedonia) (%)
Place of birth for the foreign-born population - Moldova (%)
Place of birth for the foreign-born population - Poland (%)
Place of birth for the foreign-born population - Romania (%)
Place of birth for the foreign-born population - Russia (%)
Place of birth for the foreign-born population - Serbia (%)
Place of birth for the foreign-born population - Ukraine (%)
Place of birth for the foreign-born population - Other Eastern Europe (%)
Place of birth for the foreign-born population - China (%)
Place of birth for the foreign-born population - Hong Kong (%)
Place of birth for the foreign-born population - Taiwan (%)
Place of birth for the foreign-born population - Japan (%)
Place of birth for the foreign-born population - Korea (%)
Place of birth for the foreign-born population - Other Eastern Asia (%)
Place of birth for the foreign-born population - Afghanistan (%)
Place of birth for the foreign-born population - Bangladesh (%)
Place of birth for the foreign-born population - India (%)
Place of birth for the foreign-born population - Iran (%)
Place of birth for the foreign-born population - Kazakhstan (%)
Place of birth for the foreign-born population - Nepal (%)
Place of birth for the foreign-born population - Pakistan (%)
Place of birth for the foreign-born population - Sri Lanka (%)
Place of birth for the foreign-born population - Uzbekistan (%)
Place of birth for the foreign-born population - Other South Central Asia (%)
Place of birth for the foreign-born population - Burma (%)
Place of birth for the foreign-born population - Cambodia (%)
Place of birth for the foreign-born population - Indonesia (%)
Place of birth for the foreign-born population - Laos (%)
Place of birth for the foreign-born population - Malaysia (%)
Place of birth for the foreign-born population - Philippines (%)
Place of birth for the foreign-born population - Singapore (%)
Place of birth for the foreign-born population - Thailand (%)
Place of birth for the foreign-born population - Vietnam (%)
Place of birth for the foreign-born population - Other South Eastern Asia (%)
Place of birth for the foreign-born population - Armenia (%)
Place of birth for the foreign-born population - Iraq (%)
Place of birth for the foreign-born population - Israel (%)
Place of birth for the foreign-born population - Jordan (%)
Place of birth for the foreign-born population - Kuwait (%)
Place of birth for the foreign-born population - Lebanon (%)
Place of birth for the foreign-born population - Saudi Arabia (%)
Place of birth for the foreign-born population - Syria (%)
Place of birth for the foreign-born population - Turkey (%)
Place of birth for the foreign-born population - Yemen (%)
Place of birth for the foreign-born population - Other Western Asia (%)
Place of birth for the foreign-born population - Eritrea (%)
Place of birth for the foreign-born population - Ethiopia (%)
Place of birth for the foreign-born population - Kenya (%)
Place of birth for the foreign-born population - Somalia (%)
Place of birth for the foreign-born population - Uganda (%)
Place of birth for the foreign-born population - Zimbabwe (%)
Place of birth for the foreign-born population - Other Eastern Africa (%)
Place of birth for the foreign-born population - Cameroon (%)
Place of birth for the foreign-born population - Congo (%)
Place of birth for the foreign-born population - Democratic Republic of Congo (Zaire) (%)
Place of birth for the foreign-born population - Other Middle Africa (%)
Place of birth for the foreign-born population - Egypt (%)
Place of birth for the foreign-born population - Morocco (%)
Place of birth for the foreign-born population - Sudan (%)
Place of birth for the foreign-born population - Other Northern Africa (%)
Place of birth for the foreign-born population - South Africa (%)
Place of birth for the foreign-born population - Other Southern Africa (%)
Place of birth for the foreign-born population - Cabo Verde (%)
Place of birth for the foreign-born population - Ghana (%)
Place of birth for the foreign-born population - Liberia (%)
Place of birth for the foreign-born population - Nigeria (%)
Place of birth for the foreign-born population - Senegal (%)
Place of birth for the foreign-born population - Sierra Leone (%)
Place of birth for the foreign-born population - Other Western Africa (%)
Place of birth for the foreign-born population - Australia (%)
Place of birth for the foreign-born population - New Zealand (%)
Place of birth for the foreign-born population - Fiji (%)
Place of birth for the foreign-born population - Micronesia (%)
Place of birth for the foreign-born population - Bahamas (%)
Place of birth for the foreign-born population - Barbados (%)
Place of birth for the foreign-born population - Cuba (%)
Place of birth for the foreign-born population - Dominica (%)
Place of birth for the foreign-born population - Dominican Republic (%)
Place of birth for the foreign-born population - Grenada (%)
Place of birth for the foreign-born population - Haiti (%)
Place of birth for the foreign-born population - Jamaica (%)
Place of birth for the foreign-born population - St. Vincent and the Grenadines (%)
Place of birth for the foreign-born population - Trinidad and Tobago (%)
Place of birth for the foreign-born population - West Indies (%)
Place of birth for the foreign-born population - Other Caribbean (%)
Place of birth for the foreign-born population - Belize (%)
Place of birth for the foreign-born population - Costa Rica (%)
Place of birth for the foreign-born population - El Salvador (%)
Place of birth for the foreign-born population - Guatemala (%)
Place of birth for the foreign-born population - Honduras (%)
Place of birth for the foreign-born population - Mexico (%)
Place of birth for the foreign-born population - Nicaragua (%)
Place of birth for the foreign-born population - Panama (%)
Place of birth for the foreign-born population - Other Central America (%)
Place of birth for the foreign-born population - Argentina (%)
Place of birth for the foreign-born population - Bolivia (%)
Place of birth for the foreign-born population - Brazil (%)
Place of birth for the foreign-born population - Chile (%)
Place of birth for the foreign-born population - Colombia (%)
Place of birth for the foreign-born population - Ecuador (%)
Place of birth for the foreign-born population - Guyana (%)
Place of birth for the foreign-born population - Peru (%)
Place of birth for the foreign-born population - Uruguay (%)
Place of birth for the foreign-born population - Venezuela (%)
Place of birth for the foreign-born population - Other South America (%)
Place of birth for the foreign-born population - Canada (%)
Place of birth for the foreign-born population - Other Northern America (%)
Place of birth for the foreign-born population - Other (%)
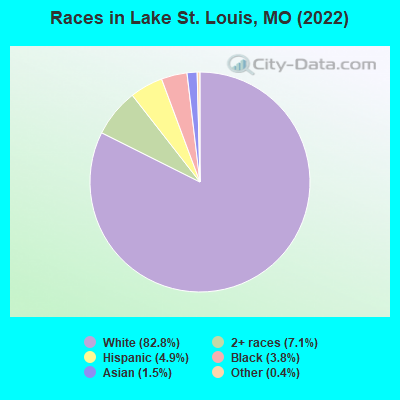
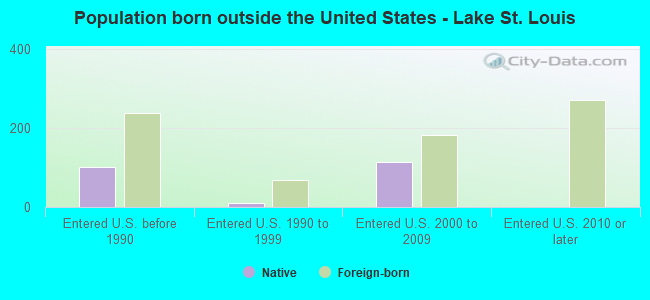
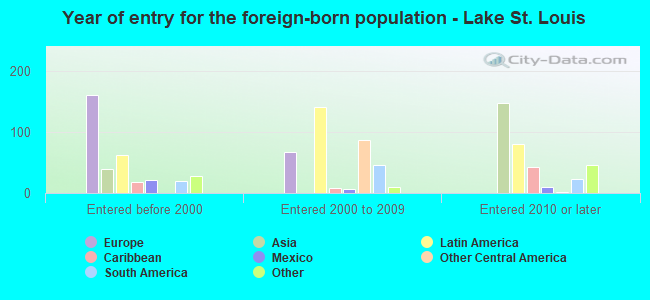
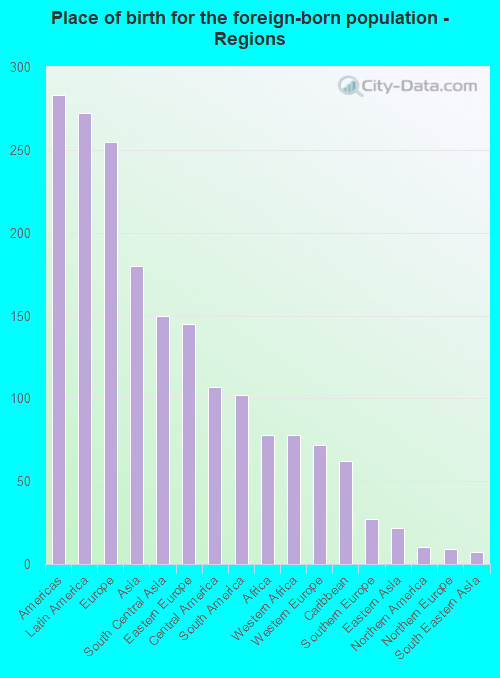
According to 2022 data, the most numerous races in Lake St. Louis, MO are White alone (14,417 residents), Black alone (656 residents), and Two or more races (1,235 residents). 94.7% of Lake St. Louis residents speak English at home. 4.6% of Lake St. Louis, MO residents are foreign-born (1.6% born in Latin America, 1.5% born in Europe, 1.1% born in Asia, 0.5% born in Africa), which is 12.8% greater than the foreign-born rate of 4.0% across the entire state of Missouri.
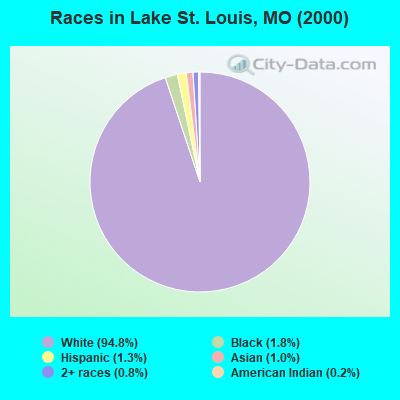
Race distribution in Lake St. Louis
2000 2022
4,686,474 83.8% White alone 625,667 11.2% Black alone 118,592 2.1% Hispanic 71,905 1.3% Two or more races 61,041 1.1% Asian alone 23,302 0.4% American Indian alone 5,291 0.09% Other race alone 2,939 0.05% Native Hawaiian and Other
4,733,411 76.6% White alone 656,739 10.6% Black alone 316,300 5.1% Two or more races 291,763 4.7% Hispanic 132,436 2.1% Asian alone 27,467 0.4% Other race alone 12,313 0.2% American Indian alone 7,528 0.1% Native Hawaiian and Other
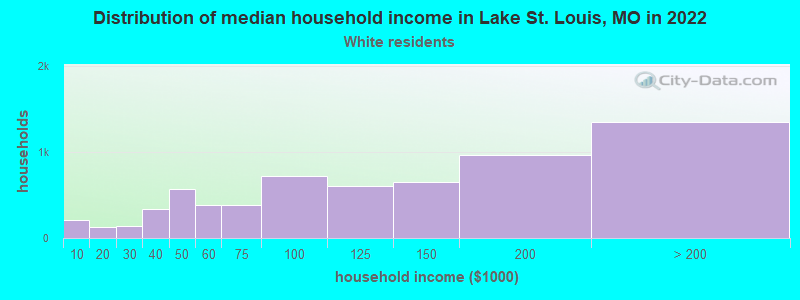
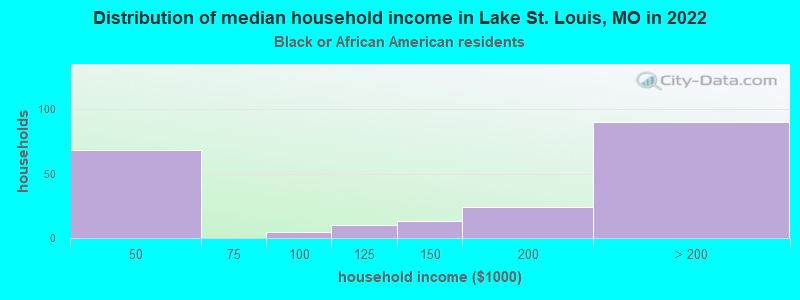
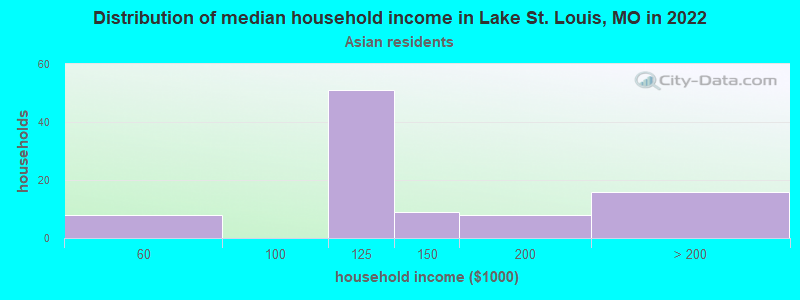
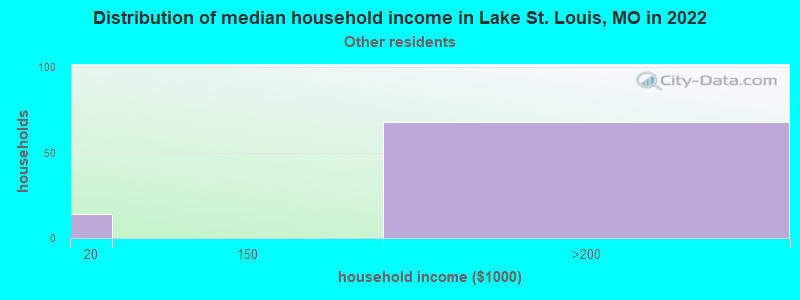
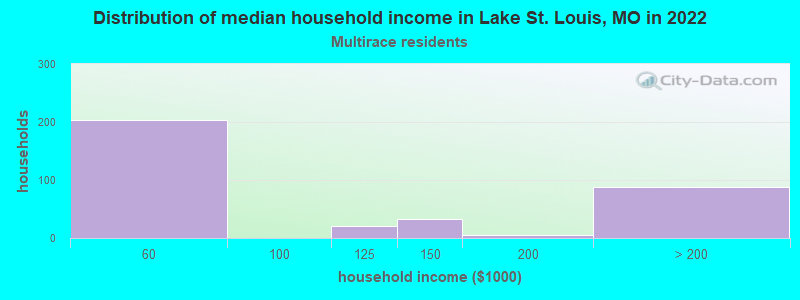
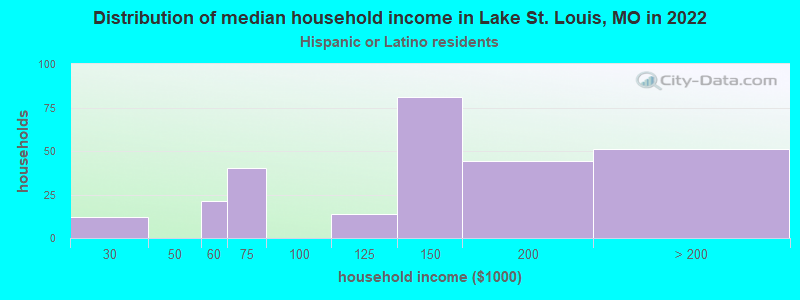
Income and house value in Lake St. Louis Median household income in 2022 $112,202 White non-Hispanic householdersover $200,000 Black householders$115,473 Asian householdersover $200,000 Some other race householders$110,009 Hispanic or Latino race householdersMedian 2022 house value $393,320 White Non-Hispanic householders$369,839 Black or African American householders$223,077 American Indian or Alaska Native householders $723,945 Asian householders$336,260 Two or more races householders$610,528 Hispanic or Latino householders
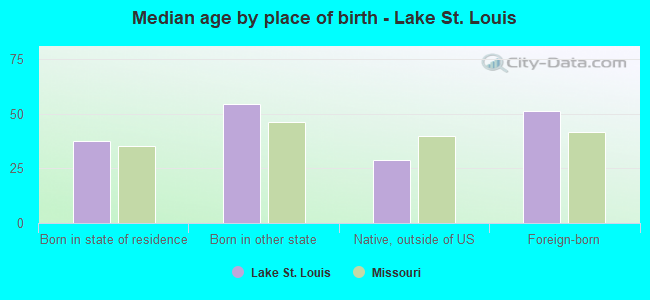
Median age by race in Lake St. Louis
46.7 Median age for White residents44.8 49.2 25.9 Median age for Black or African American residents23.6 31.1 -724,899,597.7 Median age for American Indian / Alaska Native residents-658,692,184.3 -686,991,869.2 37.2 Median age for Asian residents40.2 34.7 -693,430,656.2 Median age for Native Hawaiian / Pacific Islander residents-683,513,838.1 -752,136,751.4 29.7 Median age for Other race residents30.4 8.7 22.4 Median age for Two or more races residents25.4 22.2 47.0 Median age for White alone residents45.2 49.5 34.4 Median age for Hispanic or Latino residents34.8 35.7
Owner/renter occupied households by race in Lake St. Louis
House owners and renters - White residents 4,938 76.0% Owner occupied1,556 24.0% Renter occupiedHouse owners and renters - Black or African American residents 148 85.7% Owner occupied25 14.3% Renter occupiedHouse owners and renters - Asian residents 35 40.0% Owner occupied53 60.0% Renter occupiedHouse owners and renters - Other race residents 130 100.0% Owner occupiedHouse owners and renters - Two or more races residents 250 57.8% Owner occupied182 42.2% Renter occupiedHouse owners and renters - White alone residents 4,868 76.8% Owner occupied1,467 23.2% Renter occupiedHouse owners and renters - Hispanic or Latino residents 255 84.3% Owner occupied47 15.7% Renter occupied
Language usage in Lake St. Louis
English speakers - Total 94.7% of residents of Lake St. Louis speak English at home.
3.4% of residents speak Spanish at home 523 91.1% Speak English very well51 8.9% Speak English less than very well2.1% of residents speak other language at home 305 85.0% Speak English very well54 15.0% Speak English less than very well
English speakers - Born in the United States 95.7% of residents of Lake St. Louis speak English at home.
3.6% of residents speak Spanish at home 194 100.0% Speak English very well1.3% of residents speak other language at home 68 95.8% Speak English very well3 4.2% Speak English less than very well
English speakers - Native, born elsewhere 62.3% of residents of Lake St. Louis speak English at home.
21.6% of residents speak Spanish at home 44 100.0% Speak English very well
English speakers - Foreign-born 42.3% of residents of Lake St. Louis speak English at home.
21.2% of residents speak Spanish at home 125 79.1% Speak English very well33 20.9% Speak English less than very well36.3% of residents speak other language at home 218 80.4% Speak English very well53 19.6% Speak English less than very well
White (Caucasian) - Speak only English Native:
97.8% (13,838)Foreign-born:
59.6% (130)
White (Caucasian) - Speak another language Native:
1.7% (237)Foreign-born:
43.2% (94)
Black or African American - Speak only English Native:
99.2% (572)Foreign-born:
62.6% (62)
Asian - Speak only English Native:
100.0% (40)Foreign-born:
21.5% (42)
Asian - Speak another language Native:
7.5% (3)Foreign-born:
78.4% (154)
Other race - Speak only English Native:
100.0% (104)Foreign-born:
86.4% (61)
Other race - Speak another language Native:
12.9% (13)Foreign-born:
40.8% (29)
Two or more races - Speak only English Native:
91.5% (1,206)Foreign-born:
6.7% (9)
Two or more races - Speak another language Native:
7.1% (93)Foreign-born:
93.0% (122)
White alone - Speak only English Native:
98.7% (13,667)Foreign-born:
53.1% (102)
White alone - Speak another language Native:
1.2% (162)Foreign-born:
38.2% (73)
Hispanic or Latino - Speak only English Native:
53.0% (312)Foreign-born:
31.9% (67)
Hispanic or Latino - Speak another language Native:
47.1% (278)Foreign-born:
69.6% (146)
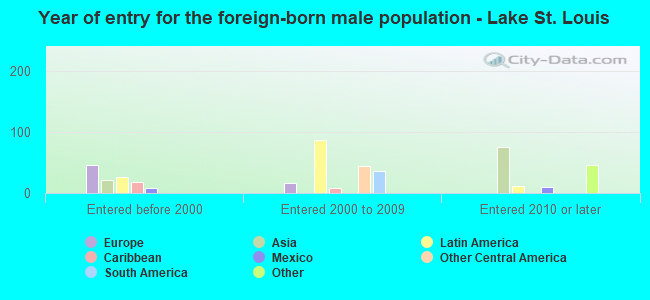
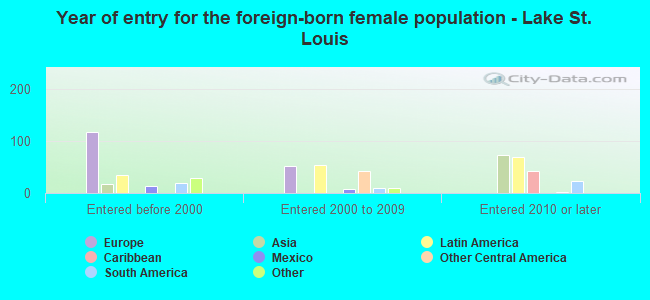
Foreign-born residents in Lake St. Louis 798 residents are foreign born (1.6% Latin America , 1.5% Europe , 1.1% Asia , 0.5% Africa ).
This city:
4.6%Missouri:
4.2%
Marital status for residents in Lake St. Louis Marital status - White (Caucasian) population 15 years and over
Males 27.2% Never married63.2% Now married0.7% Separated1.6% Widowed7.3% DivorcedFemales 16.7% Never married62.6% Now married0.3% Separated7.4% Widowed13.0% DivorcedWomen who gave birth in the past 12 months Now married:
44.6% (32)Unmarried:
55.4% (40)
Women who did not give birth in the past 12 months Now married:
53.9% (1,481)Unmarried:
46.1% (1,269)
Marital status - Black or African American population 15 years and over
Males 57.5% Never married42.5% Now married0.0% Separated0.0% Widowed0.0% DivorcedFemales 32.5% Never married45.5% Now married0.0% Separated14.5% Widowed7.5% DivorcedWomen who did not give birth in the past 12 months Now married:
42.0% (75)Unmarried:
58.0% (103)
Marital status - Asian population 15 years and over
Males 0.0% Never married100.0% Now married0.0% Separated0.0% Widowed0.0% DivorcedFemales 19.8% Never married80.2% Now married0.0% Separated0.0% Widowed0.0% DivorcedWomen who did not give birth in the past 12 months Now married:
77.7% (85)Unmarried:
22.3% (24)
Marital status - Other race population 15 years and over
Males 22.5% Never married77.5% Now married0.0% Separated0.0% Widowed0.0% DivorcedFemales 0.0% Never married100.0% Now married0.0% Separated0.0% Widowed0.0% DivorcedWomen who did not give birth in the past 12 months Now married:
100.0% (22)Unmarried:
0.0% (0)
Marital status - Two or more races population 15 years and over
Males 21.7% Never married78.3% Now married0.0% Separated0.0% Widowed0.0% DivorcedFemales 54.6% Never married40.0% Now married0.0% Separated0.3% Widowed5.1% DivorcedWomen who did not give birth in the past 12 months Now married:
23.7% (107)Unmarried:
76.3% (346)
Marital status - White alone, not Hispanic / Latino population 15 years and over
Males 27.3% Never married62.8% Now married0.7% Separated1.7% Widowed7.5% DivorcedFemales 16.8% Never married62.6% Now married0.3% Separated7.6% Widowed12.7% DivorcedWomen who gave birth in the past 12 months Now married:
44.6% (32)Unmarried:
55.4% (40)
Women who did not give birth in the past 12 months Now married:
53.2% (1,428)Unmarried:
46.8% (1,258)
Marital status - Hispanic or Latino population 15 years and over
Males 21.6% Never married78.4% Now married0.0% Separated0.0% Widowed0.0% DivorcedFemales 20.5% Never married65.2% Now married0.0% Separated0.4% Widowed14.0% DivorcedWomen who did not give birth in the past 12 months Now married:
66.0% (123)Unmarried:
34.0% (63)
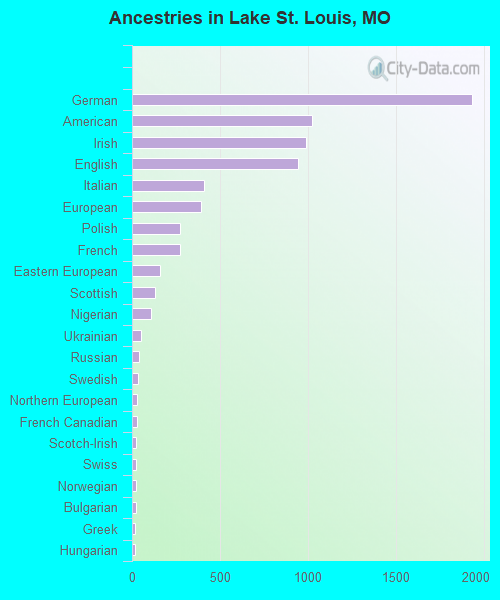
Ancestries in Lake St. Louis
1,934 23.2% German1,026 12.3% American988 11.8% Irish946 11.3% English412 4.9% Italian393 4.7% European273 3.3% Polish272 3.3% French161 1.9% Eastern European128 1.5% Scottish109 1.3% Nigerian54 0.6% Ukrainian37 0.4% Russian32 0.4% Swedish28 0.3% Northern European27 0.3% French Canadian25 0.3% Scotch-Irish25 0.3% Swiss23 0.3% Norwegian20 0.2% Bulgarian18 0.2% Greek18 0.2% Hungarian17 0.2% Czechoslovakian14 0.2% Austrian14 0.2% Trinidadian and Tobagonian13 0.2% Latvian12 0.1% Canadian9 0.1% Czech9 0.1% Maltese6 0.07% British5 0.06% African4 0.05% Welsh
Children Nativity (place of birth) in Lake St. Louis
Children under 6 years - Living with two parents Both parents native 641 99.9% Native0 0.1% Foreign-bornBoth parents foreign-born 22 81.8% Native5 18.2% Foreign-bornChildren under 6 years - Living with one parent Native parent 136 100.0% NativeChildren 6 to 17 years - Living with two parents Both parents native 2,056 99.1% Native18 0.9% Foreign-bornBoth parents foreign-born 12 35.1% Native23 64.9% Foreign-bornOne native, one foreign-born parent 55 100.0% NativeChildren 6 to 17 years - Living with one parent Native parent 330 100.0% NativeForeign-born parent 18 51.6% Native17 48.4% Foreign-born
Grandparents responsible for own grandchildren in Lake St. Louis
Grandparents (30 to 59 years) White / Caucasian 53 100.0% Not responsible for grandchildrenWhite alone, not Hispanic / Latino 58 100.0% Not responsible for grandchildrenGrandparents (60 years and over) White / Caucasian 82 42.3% Responsible for grandchildren111 57.7% Not responsible for grandchildrenWhite alone, not Hispanic / Latino 74 39.7% Responsible for grandchildren113 60.3% Not responsible for grandchildren