Races in Lake Stevens, Washington (WA) Detailed Stats
Data:
Races - White alone (%)
Races - White alone (% change since 2000)
Races - Black alone (%)
Races - Black alone (% change since 2000)
Races - American Indian alone (%)
Races - American Indian alone (% change since 2000)
Races - Asian alone (%)
Races - Asian alone (% change since 2000)
Races - Hispanic (%)
Races - Hispanic (% change since 2000)
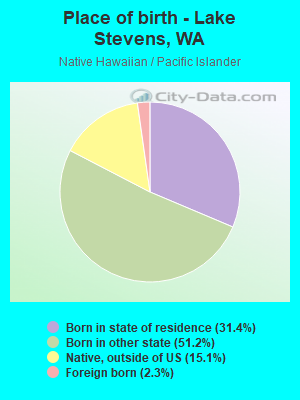
Races - Native Hawaiian and Other Pacific Islander alone (%)
Races - Native Hawaiian and Other Pacific Islander alone (% change since 2000)
Races - Two or more races(%)
Races - Two or more races(% change since 2000)
Races - Other race alone (%)
Races - Other race alone (% change since 2000)
Racial diversity
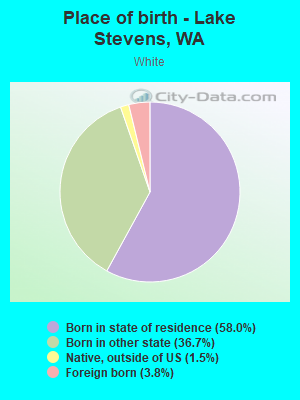
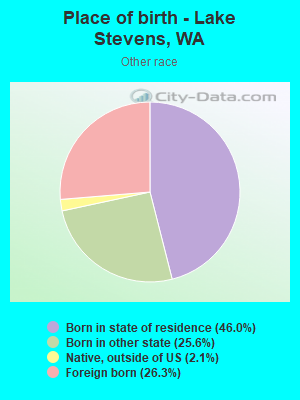
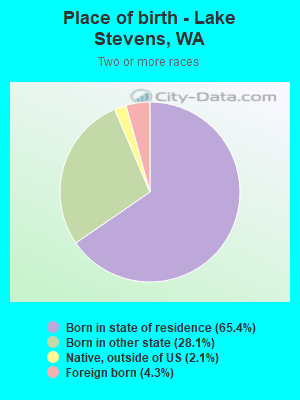
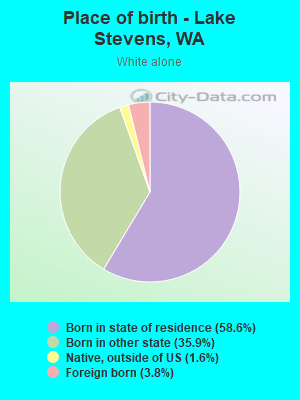
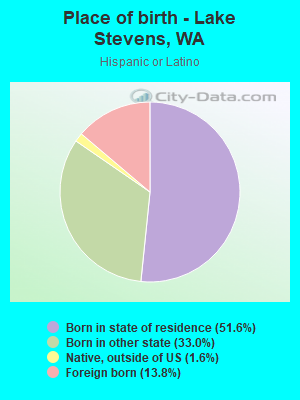
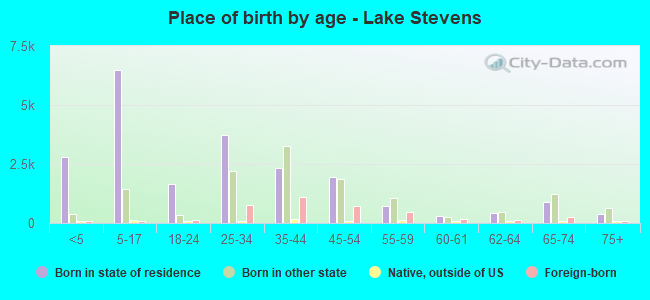
Place of birth - Born in state of residence (%)
Place of birth - Born in state of residence (%) - White
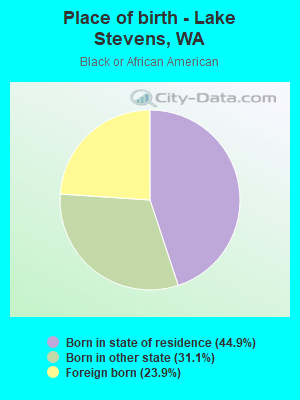
Place of birth - Born in state of residence (%) - Black or African American
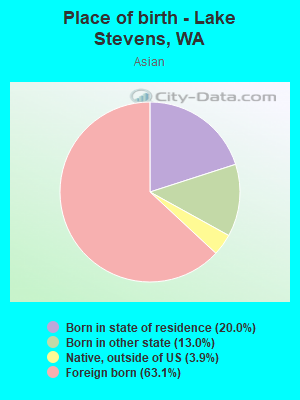
Place of birth - Born in state of residence (%) - Asian
Place of birth - Born in state of residence (%) - Hispanic or Latino
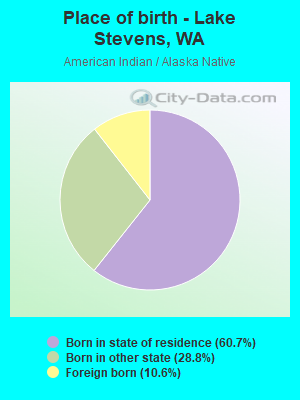
Place of birth - Born in state of residence (%) - American Indian and Alaska Native
Place of birth - Born in state of residence (%) - Multirace
Place of birth - Born in state of residence (%) - Other Race
Place of birth - Born in other state (%)
Place of birth - Born in other state (%) - White
Place of birth - Born in other state (%) - Black or African American
Place of birth - Born in other state (%) - Asian
Place of birth - Born in other state (%) - Hispanic or Latino
Place of birth - Born in other state (%) - American Indian and Alaska Native
Place of birth - Born in other state (%) - Multirace
Place of birth - Born in other state (%) - Other Race
Place of birth - Native, outside of US (%)
Place of birth - Native, outside of US (%) - White
Place of birth - Native, outside of US (%) - Black or African American
Place of birth - Native, outside of US (%) - Asian
Place of birth - Native, outside of US (%) - Hispanic or Latino
Place of birth - Native, outside of US (%) - American Indian and Alaska Native
Place of birth - Native, outside of US (%) - Multirace
Place of birth - Native, outside of US (%) - Other Race
Place of birth - Foreign born (%)
Place of birth - Foreign born (%) - White
Place of birth - Foreign born (%) - Black or African American
Place of birth - Foreign born (%) - Asian
Place of birth - Foreign born (%) - Hispanic or Latino
Place of birth - Foreign born (%) - American Indian and Alaska Native
Place of birth - Foreign born (%) - Multirace
Place of birth - Foreign born (%) - Other Race
Residents speaking English at home (%)
Residents speaking English at home - Born in the United States (%)
Residents speaking English at home - Native, born elsewhere (%)
Residents speaking English at home - Foreign born (%)
Residents speaking Spanish at home (%)
Residents speaking Spanish at home - Born in the United States (%)
Residents speaking Spanish at home - Native, born elsewhere (%)
Residents speaking Spanish at home - Foreign born (%)
Residents speaking other language at home (%)
Residents speaking other language at home - Born in the United States (%)
Residents speaking other language at home - Native, born elsewhere (%)
Residents speaking other language at home - Foreign born (%)
Marital status - Never married (%)
Marital status - Now married (%)
Marital status - Separated (%)
Marital status - Widowed (%)
Marital status - Divorced (%)
Ancestries Reported - Arab (%)
Ancestries Reported - Czech (%)
Ancestries Reported - Danish (%)
Ancestries Reported - Dutch (%)
Ancestries Reported - English (%)
Ancestries Reported - French (%)
Ancestries Reported - French Canadian (%)
Ancestries Reported - German (%)
Ancestries Reported - Greek (%)
Ancestries Reported - Hungarian (%)
Ancestries Reported - Irish (%)
Ancestries Reported - Italian (%)
Ancestries Reported - Lithuanian (%)
Ancestries Reported - Norwegian (%)
Ancestries Reported - Polish (%)
Ancestries Reported - Portuguese (%)
Ancestries Reported - Russian (%)
Ancestries Reported - Scotch-Irish (%)
Ancestries Reported - Scottish (%)
Ancestries Reported - Slovak (%)
Ancestries Reported - Subsaharan African (%)
Ancestries Reported - Swedish (%)
Ancestries Reported - Swiss (%)
Ancestries Reported - Ukrainian (%)
Ancestries Reported - United States (%)
Ancestries Reported - Welsh (%)
Ancestries Reported - West Indian (%)
Ancestries Reported - Other (%)
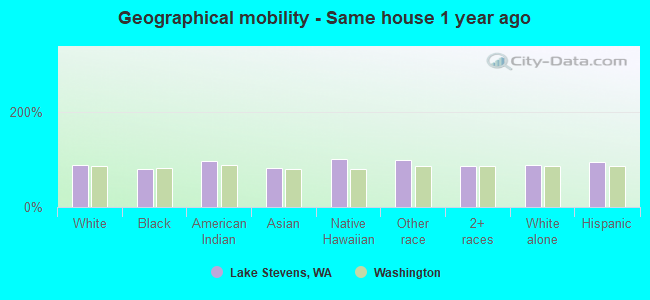
Geographical mobility - Same house 1 year ago (%)
Geographical mobility - Same house 1 year ago (%) - White
Geographical mobility - Same house 1 year ago (%) - Black or African American
Geographical mobility - Same house 1 year ago (%) - Asian
Geographical mobility - Same house 1 year ago (%) - Hispanic or Latino
Geographical mobility - Same house 1 year ago (%) - American Indian and Alaska Native
Geographical mobility - Same house 1 year ago (%) - Multirace
Geographical mobility - Same house 1 year ago (%) - Other Race
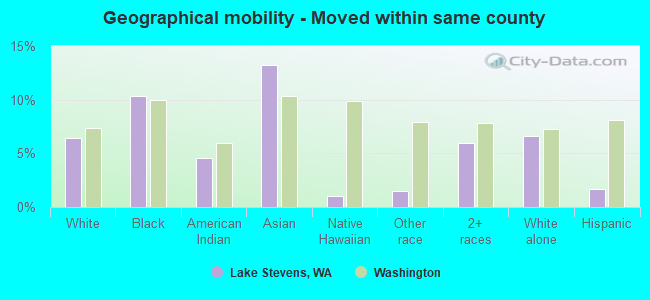
Geographical mobility - Moved within same county (%)
Geographical mobility - Moved within same county (%) - White
Geographical mobility - Moved within same county (%) - Black or African American
Geographical mobility - Moved within same county (%) - Asian
Geographical mobility - Moved within same county (%) - Hispanic or Latino
Geographical mobility - Moved within same county (%) - American Indian and Alaska Native
Geographical mobility - Moved within same county (%) - Multirace
Geographical mobility - Moved within same county (%) - Other Race
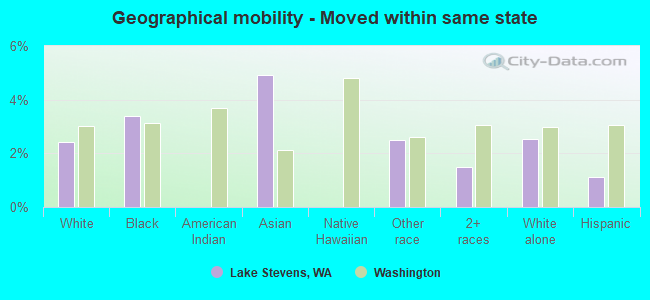
Geographical mobility - Moved from different county within same state (%)
Geographical mobility - Moved from different county within same state (%) - White
Geographical mobility - Moved from different county within same state (%) - Black or African American
Geographical mobility - Moved from different county within same state (%) - Asian
Geographical mobility - Moved from different county within same state (%) - Hispanic or Latino
Geographical mobility - Moved from different county within same state (%) - American Indian and Alaska Native
Geographical mobility - Moved from different county within same state (%) - Multirace
Geographical mobility - Moved from different county within same state (%) - Other Race
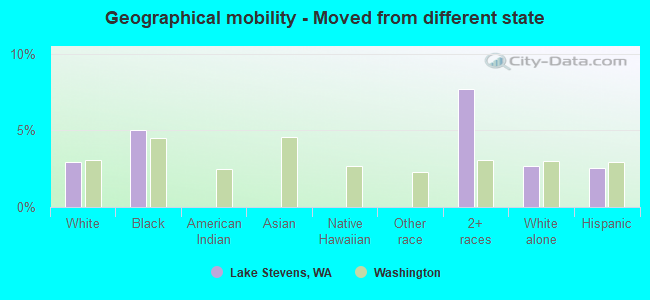
Geographical mobility - Moved from different state (%)
Geographical mobility - Moved from different state (%) - White
Geographical mobility - Moved from different state (%) - Black or African American
Geographical mobility - Moved from different state (%) - Asian
Geographical mobility - Moved from different state (%) - Hispanic or Latino
Geographical mobility - Moved from different state (%) - American Indian and Alaska Native
Geographical mobility - Moved from different state (%) - Multirace
Geographical mobility - Moved from different state (%) - Other Race
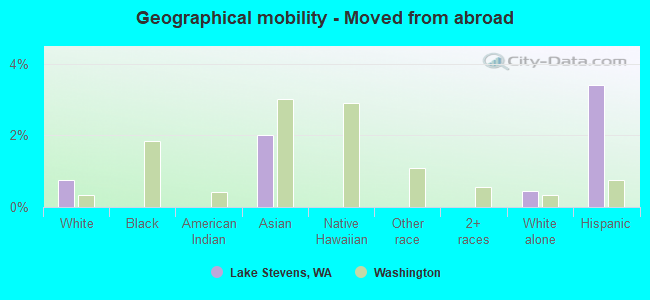
Geographical mobility - Moved from abroad (%)
Geographical mobility - Moved from abroad (%) - White
Geographical mobility - Moved from abroad (%) - Black or African American
Geographical mobility - Moved from abroad (%) - Asian
Geographical mobility - Moved from abroad (%) - Hispanic or Latino
Geographical mobility - Moved from abroad (%) - American Indian and Alaska Native
Geographical mobility - Moved from abroad (%) - Multirace
Geographical mobility - Moved from abroad (%) - Other Race
Place of birth for the foreign-born population - Ireland (%)
Place of birth for the foreign-born population - Denmark (%)
Place of birth for the foreign-born population - Norway (%)
Place of birth for the foreign-born population - Sweden (%)
Place of birth for the foreign-born population - United Kingdom (%)
Place of birth for the foreign-born population - England (%)
Place of birth for the foreign-born population - Scotland (%)
Place of birth for the foreign-born population - Other Northern Europe (%)
Place of birth for the foreign-born population - Austria (%)
Place of birth for the foreign-born population - Belgium (%)
Place of birth for the foreign-born population - France (%)
Place of birth for the foreign-born population - Germany (%)
Place of birth for the foreign-born population - Netherlands (%)
Place of birth for the foreign-born population - Switzerland (%)
Place of birth for the foreign-born population - Other Western Europe (%)
Place of birth for the foreign-born population - Greece (%)
Place of birth for the foreign-born population - Italy (%)
Place of birth for the foreign-born population - Portugal (%)
Place of birth for the foreign-born population - Spain (%)
Place of birth for the foreign-born population - Other Southern Europe (%)
Place of birth for the foreign-born population - Albania (%)
Place of birth for the foreign-born population - Belarus (%)
Place of birth for the foreign-born population - Bosnia and Herzegovina (%)
Place of birth for the foreign-born population - Bulgaria (%)
Place of birth for the foreign-born population - Croatia (%)
Place of birth for the foreign-born population - Czechoslovakia (%)
Place of birth for the foreign-born population - Hungary (%)
Place of birth for the foreign-born population - Latvia (%)
Place of birth for the foreign-born population - Lithuania (%)
Place of birth for the foreign-born population - North Macedonia (Macedonia) (%)
Place of birth for the foreign-born population - Moldova (%)
Place of birth for the foreign-born population - Poland (%)
Place of birth for the foreign-born population - Romania (%)
Place of birth for the foreign-born population - Russia (%)
Place of birth for the foreign-born population - Serbia (%)
Place of birth for the foreign-born population - Ukraine (%)
Place of birth for the foreign-born population - Other Eastern Europe (%)
Place of birth for the foreign-born population - China (%)
Place of birth for the foreign-born population - Hong Kong (%)
Place of birth for the foreign-born population - Taiwan (%)
Place of birth for the foreign-born population - Japan (%)
Place of birth for the foreign-born population - Korea (%)
Place of birth for the foreign-born population - Other Eastern Asia (%)
Place of birth for the foreign-born population - Afghanistan (%)
Place of birth for the foreign-born population - Bangladesh (%)
Place of birth for the foreign-born population - India (%)
Place of birth for the foreign-born population - Iran (%)
Place of birth for the foreign-born population - Kazakhstan (%)
Place of birth for the foreign-born population - Nepal (%)
Place of birth for the foreign-born population - Pakistan (%)
Place of birth for the foreign-born population - Sri Lanka (%)
Place of birth for the foreign-born population - Uzbekistan (%)
Place of birth for the foreign-born population - Other South Central Asia (%)
Place of birth for the foreign-born population - Burma (%)
Place of birth for the foreign-born population - Cambodia (%)
Place of birth for the foreign-born population - Indonesia (%)
Place of birth for the foreign-born population - Laos (%)
Place of birth for the foreign-born population - Malaysia (%)
Place of birth for the foreign-born population - Philippines (%)
Place of birth for the foreign-born population - Singapore (%)
Place of birth for the foreign-born population - Thailand (%)
Place of birth for the foreign-born population - Vietnam (%)
Place of birth for the foreign-born population - Other South Eastern Asia (%)
Place of birth for the foreign-born population - Armenia (%)
Place of birth for the foreign-born population - Iraq (%)
Place of birth for the foreign-born population - Israel (%)
Place of birth for the foreign-born population - Jordan (%)
Place of birth for the foreign-born population - Kuwait (%)
Place of birth for the foreign-born population - Lebanon (%)
Place of birth for the foreign-born population - Saudi Arabia (%)
Place of birth for the foreign-born population - Syria (%)
Place of birth for the foreign-born population - Turkey (%)
Place of birth for the foreign-born population - Yemen (%)
Place of birth for the foreign-born population - Other Western Asia (%)
Place of birth for the foreign-born population - Eritrea (%)
Place of birth for the foreign-born population - Ethiopia (%)
Place of birth for the foreign-born population - Kenya (%)
Place of birth for the foreign-born population - Somalia (%)
Place of birth for the foreign-born population - Uganda (%)
Place of birth for the foreign-born population - Zimbabwe (%)
Place of birth for the foreign-born population - Other Eastern Africa (%)
Place of birth for the foreign-born population - Cameroon (%)
Place of birth for the foreign-born population - Congo (%)
Place of birth for the foreign-born population - Democratic Republic of Congo (Zaire) (%)
Place of birth for the foreign-born population - Other Middle Africa (%)
Place of birth for the foreign-born population - Egypt (%)
Place of birth for the foreign-born population - Morocco (%)
Place of birth for the foreign-born population - Sudan (%)
Place of birth for the foreign-born population - Other Northern Africa (%)
Place of birth for the foreign-born population - South Africa (%)
Place of birth for the foreign-born population - Other Southern Africa (%)
Place of birth for the foreign-born population - Cabo Verde (%)
Place of birth for the foreign-born population - Ghana (%)
Place of birth for the foreign-born population - Liberia (%)
Place of birth for the foreign-born population - Nigeria (%)
Place of birth for the foreign-born population - Senegal (%)
Place of birth for the foreign-born population - Sierra Leone (%)
Place of birth for the foreign-born population - Other Western Africa (%)
Place of birth for the foreign-born population - Australia (%)
Place of birth for the foreign-born population - New Zealand (%)
Place of birth for the foreign-born population - Fiji (%)
Place of birth for the foreign-born population - Micronesia (%)
Place of birth for the foreign-born population - Bahamas (%)
Place of birth for the foreign-born population - Barbados (%)
Place of birth for the foreign-born population - Cuba (%)
Place of birth for the foreign-born population - Dominica (%)
Place of birth for the foreign-born population - Dominican Republic (%)
Place of birth for the foreign-born population - Grenada (%)
Place of birth for the foreign-born population - Haiti (%)
Place of birth for the foreign-born population - Jamaica (%)
Place of birth for the foreign-born population - St. Vincent and the Grenadines (%)
Place of birth for the foreign-born population - Trinidad and Tobago (%)
Place of birth for the foreign-born population - West Indies (%)
Place of birth for the foreign-born population - Other Caribbean (%)
Place of birth for the foreign-born population - Belize (%)
Place of birth for the foreign-born population - Costa Rica (%)
Place of birth for the foreign-born population - El Salvador (%)
Place of birth for the foreign-born population - Guatemala (%)
Place of birth for the foreign-born population - Honduras (%)
Place of birth for the foreign-born population - Mexico (%)
Place of birth for the foreign-born population - Nicaragua (%)
Place of birth for the foreign-born population - Panama (%)
Place of birth for the foreign-born population - Other Central America (%)
Place of birth for the foreign-born population - Argentina (%)
Place of birth for the foreign-born population - Bolivia (%)
Place of birth for the foreign-born population - Brazil (%)
Place of birth for the foreign-born population - Chile (%)
Place of birth for the foreign-born population - Colombia (%)
Place of birth for the foreign-born population - Ecuador (%)
Place of birth for the foreign-born population - Guyana (%)
Place of birth for the foreign-born population - Peru (%)
Place of birth for the foreign-born population - Uruguay (%)
Place of birth for the foreign-born population - Venezuela (%)
Place of birth for the foreign-born population - Other South America (%)
Place of birth for the foreign-born population - Canada (%)
Place of birth for the foreign-born population - Other Northern America (%)
Place of birth for the foreign-born population - Other (%)
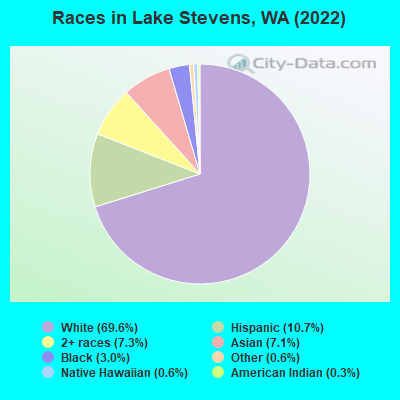
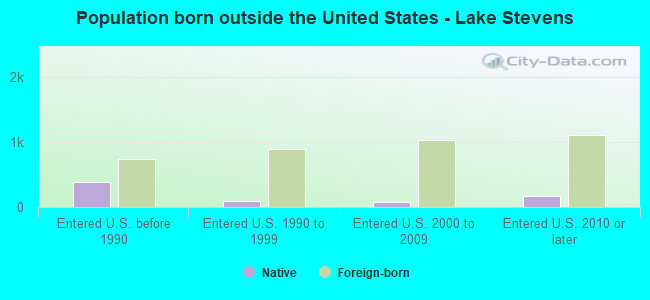
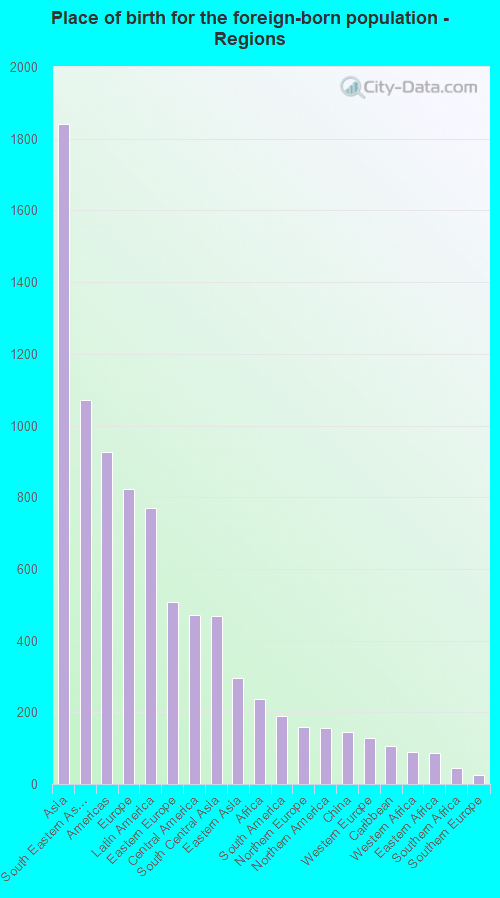
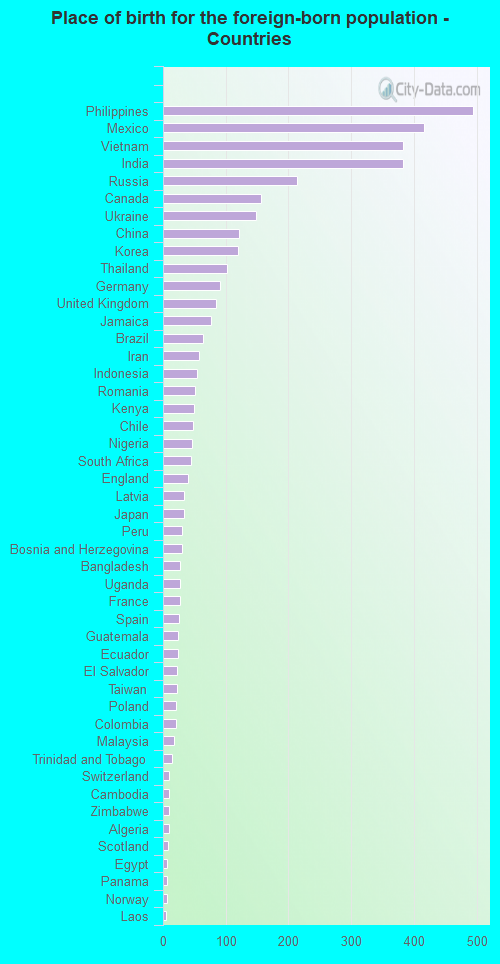
According to 2022 data, the most numerous races in Lake Stevens, WA are White alone (27,392 residents), Hispanic (4,202 residents), and Asian alone (2,784 residents). 87.4% of Lake Stevens residents speak English at home. 9.7% of Lake Stevens, WA residents are foreign-born (4.6% born in Asia, 2.0% born in Europe, 1.9% born in Latin America), which is 54.1% less than the foreign-born rate of 15.0% across the entire state of Washington.
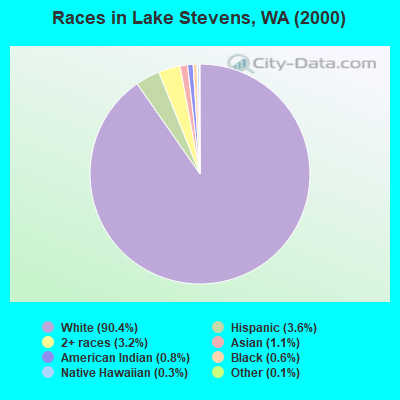
Race distribution in Lake Stevens
2000 2022
4,652,490 78.9% White alone 441,509 7.5% Hispanic 319,401 5.4% Asian alone 184,631 3.1% Black alone 175,926 3.0% Two or more races 85,396 1.4% American Indian alone 22,779 0.4% Native Hawaiian and Other 11,989 0.2% Other race alone
4,941,456 63.5% White alone 1,093,313 14.0% Hispanic 755,832 9.7% Asian alone 523,448 6.7% Two or more races 299,537 3.8% Black alone 69,024 0.9% American Indian alone 52,231 0.7% Native Hawaiian and Other 50,945 0.7% Other race alone
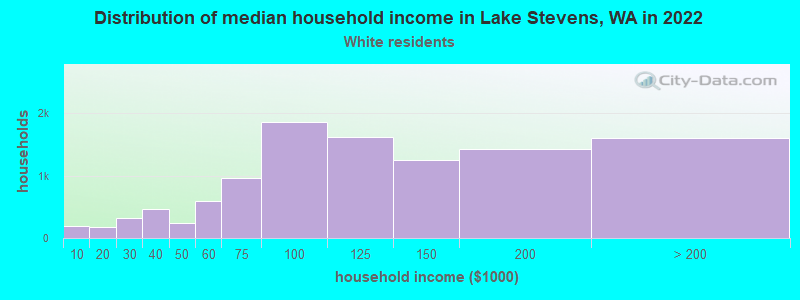
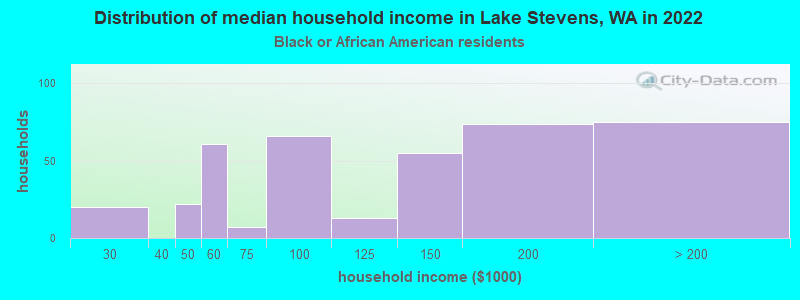
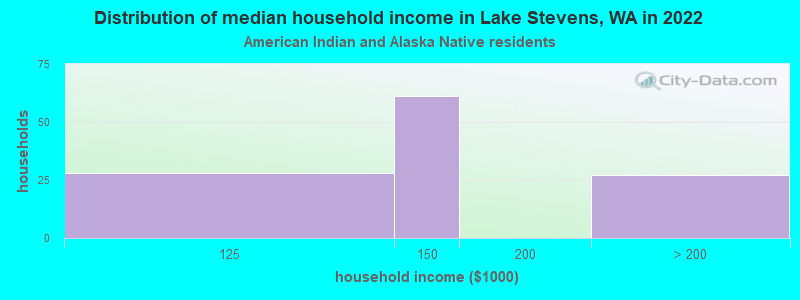
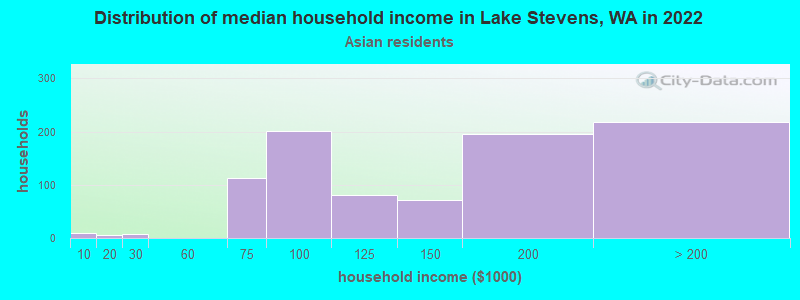
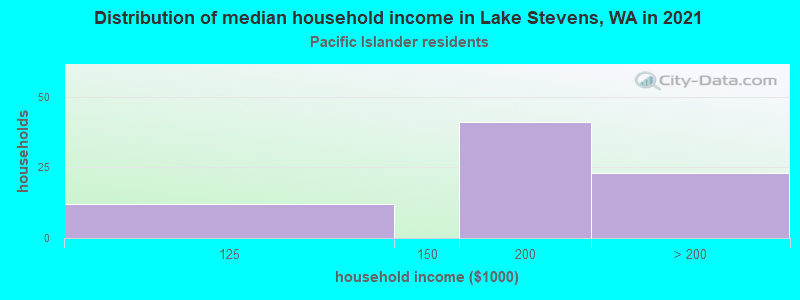
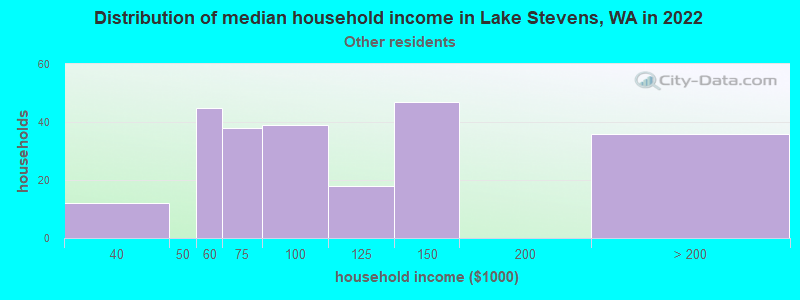
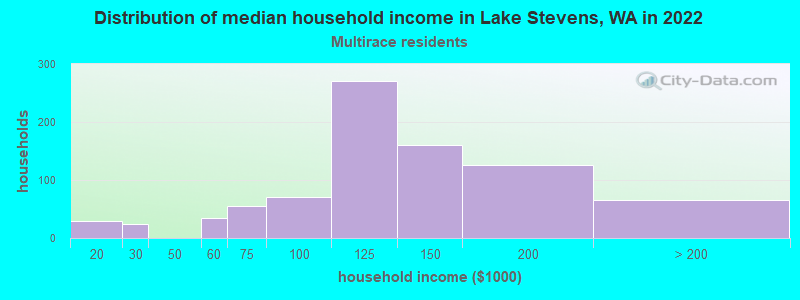
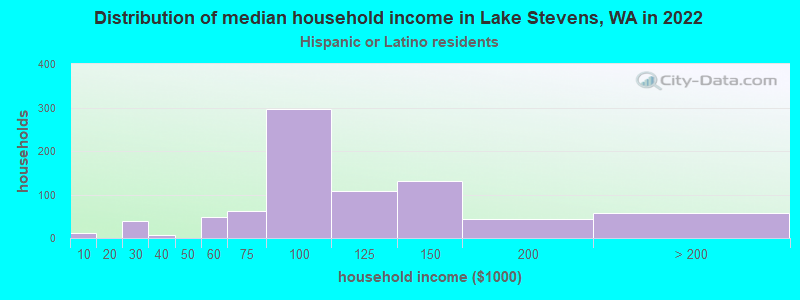
Income and house value in Lake Stevens Median household income in 2022 $105,901 White non-Hispanic householders$113,239 Black householders$173,470 American Indian and Alaska Native householders$133,353 Asian householdersover $200,000 Native Hawaiian and other Pacific Islander householders$78,808 Some other race householders$127,260 Two or more races householders$91,633 Hispanic or Latino race householdersMedian 2022 house value $616,616 White Non-Hispanic householders$686,947 Black or African American householders$323,519 American Indian or Alaska Native householders$531,566 Some other race householders$708,863 Two or more races householders$712,789 Hispanic or Latino householders
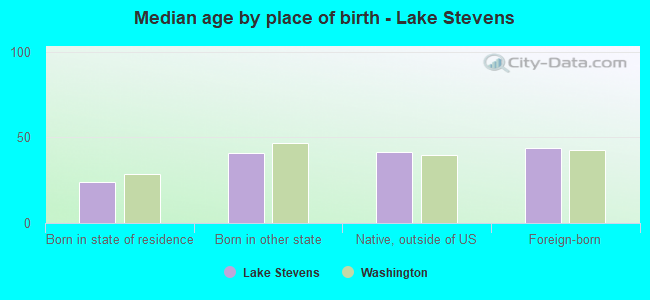
Median age by race in Lake Stevens
36.8 Median age for White residents37.6 35.9 32.4 Median age for Black or African American residents27.7 38.6 39.1 Median age for American Indian / Alaska Native residents31.6 37.4 36.3 Median age for Asian residents36.6 35.9 22.3 Median age for Native Hawaiian / Pacific Islander residents30.2 22.0 19.2 Median age for Other race residents14.0 23.4 15.5 Median age for Two or more races residents16.0 16.7 37.1 Median age for White alone residents38.1 36.0 17.5 Median age for Hispanic or Latino residents14.6 25.3
Owner/renter occupied households by race in Lake Stevens
House owners and renters - White residents 8,100 75.1% Owner occupied2,693 24.9% Renter occupiedHouse owners and renters - Black or African American residents 188 57.3% Owner occupied141 42.7% Renter occupiedHouse owners and renters - American Indian / Alaska Native residents 77 78.6% Owner occupied21 21.4% Renter occupiedHouse owners and renters - Asian residents 803 87.8% Owner occupied112 12.2% Renter occupiedHouse owners and renters - Native Hawaiian / Pacific Islander residents 71 100.0% Owner occupiedHouse owners and renters - Other race residents 147 66.6% Owner occupied74 33.4% Renter occupiedHouse owners and renters - Two or more races residents 623 81.0% Owner occupied146 19.0% Renter occupiedHouse owners and renters - White alone residents 8,023 75.9% Owner occupied2,545 24.1% Renter occupiedHouse owners and renters - Hispanic or Latino residents 395 52.1% Owner occupied364 47.9% Renter occupied
Language usage in Lake Stevens
English speakers - Total 87.4% of residents of Lake Stevens speak English at home.
3.7% of residents speak Spanish at home 910 68.5% Speak English very well419 31.5% Speak English less than very well8.9% of residents speak other language at home 2,124 65.8% Speak English very well1,104 34.2% Speak English less than very well
English speakers - Born in the United States 95.3% of residents of Lake Stevens speak English at home.
2.5% of residents speak Spanish at home 308 96.2% Speak English very well12 3.8% Speak English less than very well2.1% of residents speak other language at home 187 69.0% Speak English very well84 31.0% Speak English less than very well
English speakers - Native, born elsewhere 75.2% of residents of Lake Stevens speak English at home.
5.1% of residents speak Spanish at home 27 75.0% Speak English very well9 25.0% Speak English less than very well22.1% of residents speak other language at home 154 98.1% Speak English very well3 1.9% Speak English less than very well
English speakers - Foreign-born 26.4% of residents of Lake Stevens speak English at home.
14.7% of residents speak Spanish at home 277 48.8% Speak English very well291 51.2% Speak English less than very well60.2% of residents speak other language at home 1,433 61.6% Speak English very well893 38.4% Speak English less than very well
White (Caucasian) - Speak only English Native:
97.6% (24,995)Foreign-born:
30.4% (329)
White (Caucasian) - Speak another language Native:
2.6% (676)Foreign-born:
69.6% (751)
Black or African American - Speak only English Native:
100.0% (888)Foreign-born:
100.0% (276)
Black or African American - Speak another language Native:
2.8% (25)Foreign-born:
34.9% (96)
American Indian / Alaska Native - Speak another language Native:
15.5% (45)Foreign-born:
100.0% (33)
Asian - Speak only English Native:
54.6% (433)Foreign-born:
18.3% (333)
Asian - Speak another language Native:
45.4% (360)Foreign-born:
82.5% (1,503)
Native Hawaiian / Pacific Islander - Speak another language Native:
23.6% (44)Foreign-born:
74.1% (3)
Other race - Speak another language Native:
54.3% (344)Foreign-born:
96.4% (287)
Two or more races - Speak only English Native:
95.9% (3,450)Foreign-born:
42.9% (85)
Two or more races - Speak another language Native:
4.8% (173)Foreign-born:
62.1% (124)
White alone - Speak only English Native:
97.9% (24,141)Foreign-born:
30.4% (319)
White alone - Speak another language Native:
2.1% (513)Foreign-born:
69.6% (730)
Hispanic or Latino - Speak only English Native:
80.4% (2,489)Foreign-born:
8.6% (51)
Hispanic or Latino - Speak another language Native:
22.6% (701)Foreign-born:
91.4% (540)
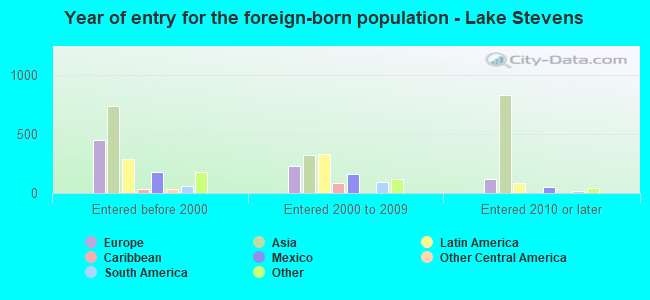
Foreign-born residents in Lake Stevens 3,831 residents are foreign born (4.6% Asia , 2.0% Europe , 1.9% Latin America ).
This city:
9.7%Washington:
14.9%
Marital status for residents in Lake Stevens Marital status - White (Caucasian) population 15 years and over
Males 27.3% Never married58.8% Now married1.6% Separated1.1% Widowed11.3% DivorcedFemales 23.7% Never married57.9% Now married1.6% Separated3.6% Widowed13.2% DivorcedWomen who gave birth in the past 12 months Now married:
83.8% (436)Unmarried:
16.2% (85)
Women who did not give birth in the past 12 months Now married:
56.6% (3,744)Unmarried:
43.4% (2,872)
Marital status - Black or African American population 15 years and over
Males 31.0% Never married61.1% Now married0.0% Separated0.0% Widowed7.9% DivorcedFemales 12.9% Never married62.1% Now married0.0% Separated12.9% Widowed12.1% DivorcedWomen who did not give birth in the past 12 months Now married:
66.5% (194)Unmarried:
33.5% (97)
Marital status - American Indian / Alaska Native population 15 years and over
Males 42.1% Never married57.9% Now married0.0% Separated0.0% Widowed0.0% DivorcedFemales 13.7% Never married67.2% Now married19.1% Separated0.0% Widowed0.0% DivorcedWomen who did not give birth in the past 12 months Now married:
74.3% (75)Unmarried:
25.7% (26)
Marital status - Asian population 15 years and over
Males 40.1% Never married59.8% Now married0.1% Separated0.0% Widowed0.0% DivorcedFemales 19.0% Never married69.2% Now married0.0% Separated1.7% Widowed10.1% DivorcedWomen who gave birth in the past 12 months Now married:
94.0% (88)Unmarried:
6.0% (6)
Women who did not give birth in the past 12 months Now married:
57.3% (437)Unmarried:
42.7% (326)
Marital status - Native Hawaiian / Pacific Islander population 15 years and over
Males 43.4% Never married56.6% Now married0.0% Separated0.0% Widowed0.0% DivorcedFemales 43.5% Never married52.2% Now married0.0% Separated4.3% Widowed0.0% DivorcedWomen who did not give birth in the past 12 months Now married:
54.5% (26)Unmarried:
45.5% (21)
Marital status - Other race population 15 years and over
Males 12.5% Never married87.5% Now married0.0% Separated0.0% Widowed0.0% DivorcedFemales 38.1% Never married56.1% Now married0.0% Separated0.0% Widowed5.8% DivorcedWomen who gave birth in the past 12 months Now married:
100.0% (31)Unmarried:
0.0% (0)
Women who did not give birth in the past 12 months Now married:
47.8% (107)Unmarried:
52.2% (117)
Marital status - Two or more races population 15 years and over
Males 50.2% Never married46.5% Now married0.0% Separated0.0% Widowed3.4% DivorcedFemales 35.0% Never married55.1% Now married0.0% Separated0.0% Widowed9.9% DivorcedWomen who gave birth in the past 12 months Now married:
27.3% (13)Unmarried:
72.7% (35)
Women who did not give birth in the past 12 months Now married:
50.1% (389)Unmarried:
49.9% (388)
Marital status - White alone, not Hispanic / Latino population 15 years and over
Males 26.8% Never married58.9% Now married1.6% Separated1.1% Widowed11.6% DivorcedFemales 23.1% Never married57.8% Now married1.6% Separated3.8% Widowed13.7% DivorcedWomen who gave birth in the past 12 months Now married:
83.1% (424)Unmarried:
16.9% (86)
Women who did not give birth in the past 12 months Now married:
56.6% (3,603)Unmarried:
43.4% (2,765)
Marital status - Hispanic or Latino population 15 years and over
Males 36.7% Never married60.8% Now married0.0% Separated0.0% Widowed2.5% DivorcedFemales 34.1% Never married57.1% Now married2.0% Separated0.0% Widowed6.8% DivorcedWomen who gave birth in the past 12 months Now married:
73.1% (93)Unmarried:
26.9% (34)
Women who did not give birth in the past 12 months Now married:
54.6% (514)Unmarried:
45.4% (427)
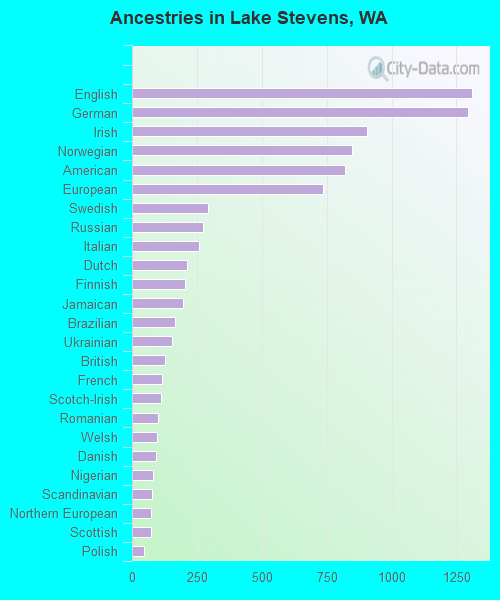
Ancestries in Lake Stevens
1,310 8.6% English1,296 8.5% German905 5.9% Irish846 5.6% Norwegian819 5.4% American734 4.8% European291 1.9% Swedish274 1.8% Russian258 1.7% Italian213 1.4% Dutch205 1.3% Finnish196 1.3% Jamaican165 1.1% Brazilian153 1.0% Ukrainian129 0.8% British114 0.7% French110 0.7% Scotch-Irish100 0.7% Romanian98 0.6% Welsh92 0.6% Danish79 0.5% Nigerian77 0.5% Scandinavian75 0.5% Northern European72 0.5% Scottish45 0.3% Polish45 0.3% Swiss42 0.3% Lithuanian41 0.3% French Canadian38 0.2% Egyptian37 0.2% Iranian33 0.2% Kenyan27 0.2% Ethiopian27 0.2% South African27 0.2% Icelander23 0.2% Portuguese23 0.2% West Indian21 0.1% Senegalese20 0.1% Palestinian18 0.1% Canadian18 0.1% Yugoslavian10 0.07% Czech9 0.06% Eastern European8 0.05% Hungarian8 0.05% Latvian7 0.05% Greek7 0.05% Croatian5 0.03% Bulgarian1 0.01% African
Geographical mobility in Lake Stevens Same house 1 year ago 24,554 87.4% White (Caucasian)930 79.0% Black or African American324 97.0% American Indian / Alaska Native2,307 80.7% Asian181 100.0% Native Hawaiian / Pacific Islander1,083 98.5% Other race3,765 85.0% Two or more races23,702 87.5% White alone, not Hispanic / Latino3,898 94.5% Hispanic or LatinoMoved within same county 1,797 6.4% White / Caucasian122 10.4% Black or African American15 4.5% American Indian / Alaska Native379 13.3% Asian2 1.0% Native Hawaiian / Pacific Islander16 1.5% Other race263 5.9% Two or more races1,793 6.6% White alone, not Hispanic / Latino69 1.7% Hispanic or LatinoMoved within same state 685 2.4% White / Caucasian40 3.4% Black or African American141 4.9% Asian27 2.5% Other race66 1.5% Two or more races689 2.5% White alone, not Hispanic / Latino45 1.1% Hispanic or LatinoMoved from different state 825 2.9% White / Caucasian59 5.0% Black or African American342 7.7% Two or more races716 2.6% White alone, not Hispanic / Latino105 2.5% Hispanic or LatinoMoved from abroad 211 0.7% White58 2.0% Asian121 0.4% White alone, not Hispanic / Latino141 3.4% Hispanic or Latino
Children Nativity (place of birth) in Lake Stevens
Children under 6 years - Living with two parents Both parents native 2,712 100.0% NativeBoth parents foreign-born 414 100.0% NativeOne native, one foreign-born parent 430 100.0% NativeChildren under 6 years - Living with one parent Native parent 392 100.0% NativeForeign-born parent 7 100.0% NativeChildren 6 to 17 years - Living with two parents Both parents native 3,940 99.8% Native7 0.2% Foreign-bornBoth parents foreign-born 550 92.1% Native47 7.9% Foreign-bornOne native, one foreign-born parent 626 100.0% NativeChildren 6 to 17 years - Living with one parent Native parent 1,971 100.0% NativeForeign-born parent 85 49.1% Native88 50.9% Foreign-born
Grandparents responsible for own grandchildren in Lake Stevens
Grandparents (30 to 59 years) White / Caucasian 10 4.9% Responsible for grandchildren189 95.1% Not responsible for grandchildrenAsian 6 100.0% Not responsible for grandchildrenTwo or more races 23 100.0% Responsible for grandchildrenWhite alone, not Hispanic / Latino 10 4.9% Responsible for grandchildren199 95.1% Not responsible for grandchildrenGrandparents (60 years and over) White / Caucasian 48 13.2% Responsible for grandchildren318 86.8% Not responsible for grandchildrenAsian 21 35.2% Responsible for grandchildren39 64.8% Not responsible for grandchildrenTwo or more races 47 100.0% Not responsible for grandchildrenWhite alone, not Hispanic / Latino 48 13.3% Responsible for grandchildren314 86.7% Not responsible for grandchildren