Races in Lake Stickney, Washington (WA) Detailed Stats
Data:
Races - White alone (%)
Races - White alone (% change since 2000)
Races - Black alone (%)
Races - Black alone (% change since 2000)
Races - American Indian alone (%)
Races - American Indian alone (% change since 2000)
Races - Asian alone (%)
Races - Asian alone (% change since 2000)
Races - Hispanic (%)
Races - Hispanic (% change since 2000)
Races - Native Hawaiian and Other Pacific Islander alone (%)
Races - Native Hawaiian and Other Pacific Islander alone (% change since 2000)
Races - Two or more races(%)
Races - Two or more races(% change since 2000)
Races - Other race alone (%)
Races - Other race alone (% change since 2000)
Racial diversity
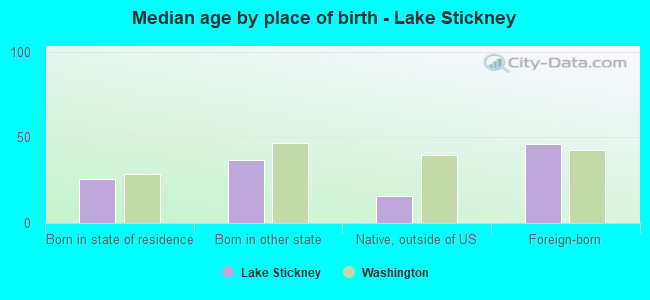
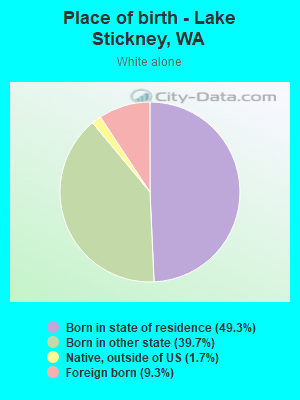
Place of birth - Born in state of residence (%)
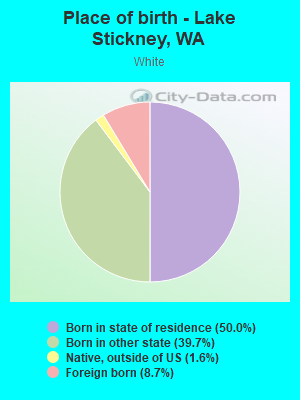
Place of birth - Born in state of residence (%) - White
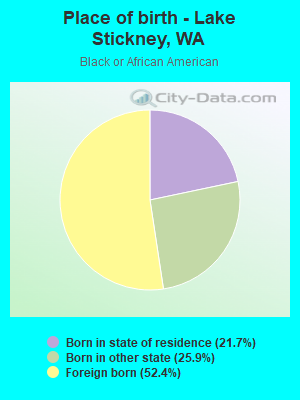
Place of birth - Born in state of residence (%) - Black or African American
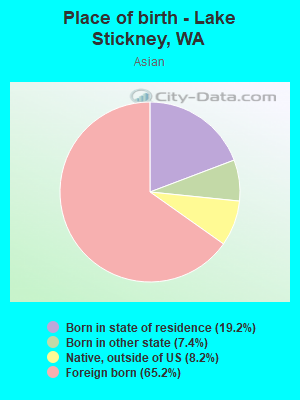
Place of birth - Born in state of residence (%) - Asian
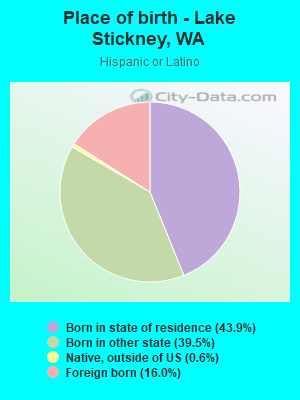
Place of birth - Born in state of residence (%) - Hispanic or Latino
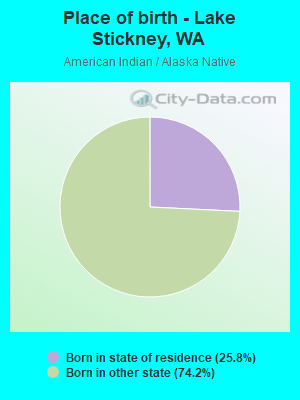
Place of birth - Born in state of residence (%) - American Indian and Alaska Native
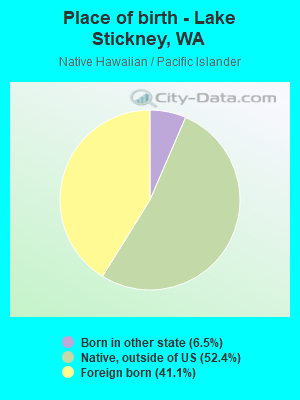
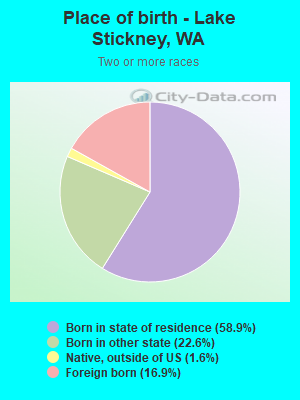
Place of birth - Born in state of residence (%) - Multirace
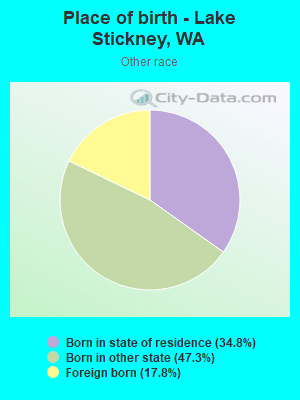
Place of birth - Born in state of residence (%) - Other Race
Place of birth - Born in other state (%)
Place of birth - Born in other state (%) - White
Place of birth - Born in other state (%) - Black or African American
Place of birth - Born in other state (%) - Asian
Place of birth - Born in other state (%) - Hispanic or Latino
Place of birth - Born in other state (%) - American Indian and Alaska Native
Place of birth - Born in other state (%) - Multirace
Place of birth - Born in other state (%) - Other Race
Place of birth - Native, outside of US (%)
Place of birth - Native, outside of US (%) - White
Place of birth - Native, outside of US (%) - Black or African American
Place of birth - Native, outside of US (%) - Asian
Place of birth - Native, outside of US (%) - Hispanic or Latino
Place of birth - Native, outside of US (%) - American Indian and Alaska Native
Place of birth - Native, outside of US (%) - Multirace
Place of birth - Native, outside of US (%) - Other Race
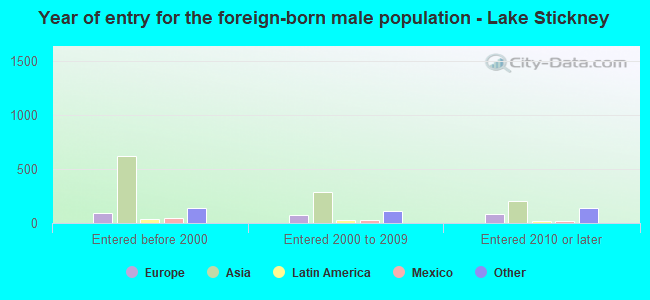
Place of birth - Foreign born (%)
Place of birth - Foreign born (%) - White
Place of birth - Foreign born (%) - Black or African American
Place of birth - Foreign born (%) - Asian
Place of birth - Foreign born (%) - Hispanic or Latino
Place of birth - Foreign born (%) - American Indian and Alaska Native
Place of birth - Foreign born (%) - Multirace
Place of birth - Foreign born (%) - Other Race
Residents speaking English at home (%)
Residents speaking English at home - Born in the United States (%)
Residents speaking English at home - Native, born elsewhere (%)
Residents speaking English at home - Foreign born (%)
Residents speaking Spanish at home (%)
Residents speaking Spanish at home - Born in the United States (%)
Residents speaking Spanish at home - Native, born elsewhere (%)
Residents speaking Spanish at home - Foreign born (%)
Residents speaking other language at home (%)
Residents speaking other language at home - Born in the United States (%)
Residents speaking other language at home - Native, born elsewhere (%)
Residents speaking other language at home - Foreign born (%)
Marital status - Never married (%)
Marital status - Now married (%)
Marital status - Separated (%)
Marital status - Widowed (%)
Marital status - Divorced (%)
Ancestries Reported - Arab (%)
Ancestries Reported - Czech (%)
Ancestries Reported - Danish (%)
Ancestries Reported - Dutch (%)
Ancestries Reported - English (%)
Ancestries Reported - French (%)
Ancestries Reported - French Canadian (%)
Ancestries Reported - German (%)
Ancestries Reported - Greek (%)
Ancestries Reported - Hungarian (%)
Ancestries Reported - Irish (%)
Ancestries Reported - Italian (%)
Ancestries Reported - Lithuanian (%)
Ancestries Reported - Norwegian (%)
Ancestries Reported - Polish (%)
Ancestries Reported - Portuguese (%)
Ancestries Reported - Russian (%)
Ancestries Reported - Scotch-Irish (%)
Ancestries Reported - Scottish (%)
Ancestries Reported - Slovak (%)
Ancestries Reported - Subsaharan African (%)
Ancestries Reported - Swedish (%)
Ancestries Reported - Swiss (%)
Ancestries Reported - Ukrainian (%)
Ancestries Reported - United States (%)
Ancestries Reported - Welsh (%)
Ancestries Reported - West Indian (%)
Ancestries Reported - Other (%)
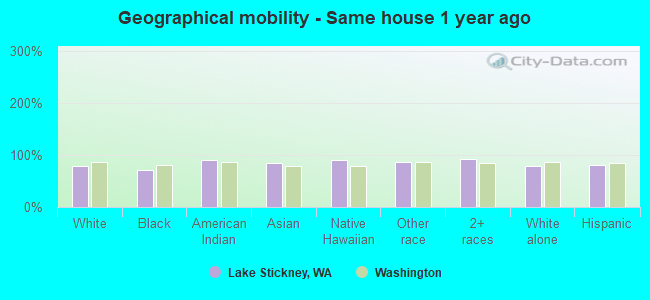
Geographical mobility - Same house 1 year ago (%)
Geographical mobility - Same house 1 year ago (%) - White
Geographical mobility - Same house 1 year ago (%) - Black or African American
Geographical mobility - Same house 1 year ago (%) - Asian
Geographical mobility - Same house 1 year ago (%) - Hispanic or Latino
Geographical mobility - Same house 1 year ago (%) - American Indian and Alaska Native
Geographical mobility - Same house 1 year ago (%) - Multirace
Geographical mobility - Same house 1 year ago (%) - Other Race
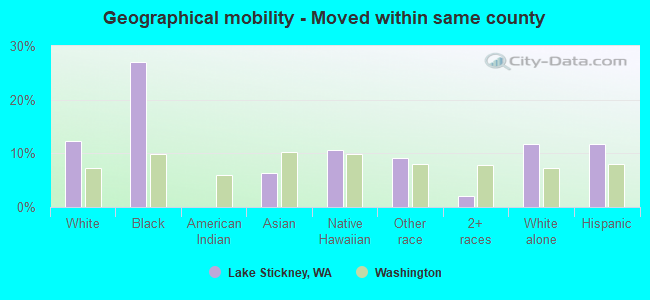
Geographical mobility - Moved within same county (%)
Geographical mobility - Moved within same county (%) - White
Geographical mobility - Moved within same county (%) - Black or African American
Geographical mobility - Moved within same county (%) - Asian
Geographical mobility - Moved within same county (%) - Hispanic or Latino
Geographical mobility - Moved within same county (%) - American Indian and Alaska Native
Geographical mobility - Moved within same county (%) - Multirace
Geographical mobility - Moved within same county (%) - Other Race
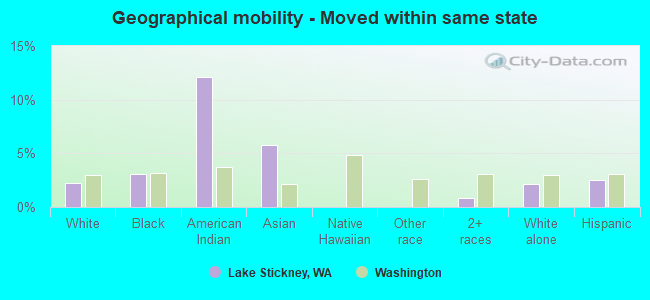
Geographical mobility - Moved from different county within same state (%)
Geographical mobility - Moved from different county within same state (%) - White
Geographical mobility - Moved from different county within same state (%) - Black or African American
Geographical mobility - Moved from different county within same state (%) - Asian
Geographical mobility - Moved from different county within same state (%) - Hispanic or Latino
Geographical mobility - Moved from different county within same state (%) - American Indian and Alaska Native
Geographical mobility - Moved from different county within same state (%) - Multirace
Geographical mobility - Moved from different county within same state (%) - Other Race
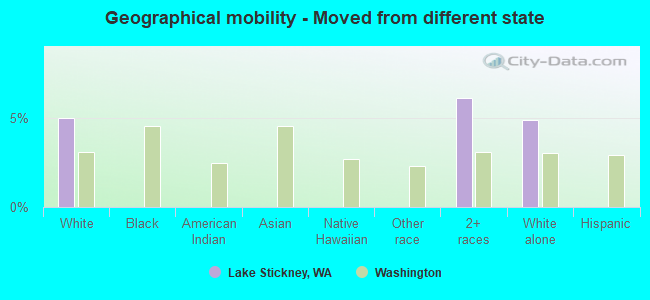
Geographical mobility - Moved from different state (%)
Geographical mobility - Moved from different state (%) - White
Geographical mobility - Moved from different state (%) - Black or African American
Geographical mobility - Moved from different state (%) - Asian
Geographical mobility - Moved from different state (%) - Hispanic or Latino
Geographical mobility - Moved from different state (%) - American Indian and Alaska Native
Geographical mobility - Moved from different state (%) - Multirace
Geographical mobility - Moved from different state (%) - Other Race
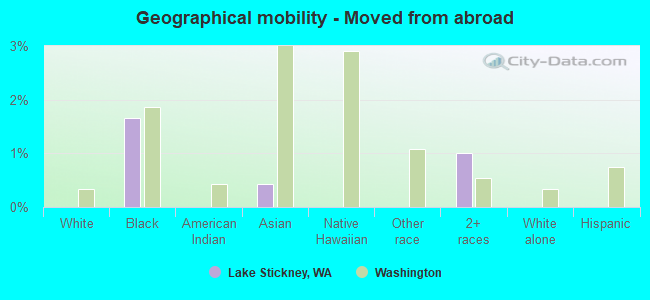
Geographical mobility - Moved from abroad (%)
Geographical mobility - Moved from abroad (%) - White
Geographical mobility - Moved from abroad (%) - Black or African American
Geographical mobility - Moved from abroad (%) - Asian
Geographical mobility - Moved from abroad (%) - Hispanic or Latino
Geographical mobility - Moved from abroad (%) - American Indian and Alaska Native
Geographical mobility - Moved from abroad (%) - Multirace
Geographical mobility - Moved from abroad (%) - Other Race
Place of birth for the foreign-born population - Ireland (%)
Place of birth for the foreign-born population - Denmark (%)
Place of birth for the foreign-born population - Norway (%)
Place of birth for the foreign-born population - Sweden (%)
Place of birth for the foreign-born population - United Kingdom (%)
Place of birth for the foreign-born population - England (%)
Place of birth for the foreign-born population - Scotland (%)
Place of birth for the foreign-born population - Other Northern Europe (%)
Place of birth for the foreign-born population - Austria (%)
Place of birth for the foreign-born population - Belgium (%)
Place of birth for the foreign-born population - France (%)
Place of birth for the foreign-born population - Germany (%)
Place of birth for the foreign-born population - Netherlands (%)
Place of birth for the foreign-born population - Switzerland (%)
Place of birth for the foreign-born population - Other Western Europe (%)
Place of birth for the foreign-born population - Greece (%)
Place of birth for the foreign-born population - Italy (%)
Place of birth for the foreign-born population - Portugal (%)
Place of birth for the foreign-born population - Spain (%)
Place of birth for the foreign-born population - Other Southern Europe (%)
Place of birth for the foreign-born population - Albania (%)
Place of birth for the foreign-born population - Belarus (%)
Place of birth for the foreign-born population - Bosnia and Herzegovina (%)
Place of birth for the foreign-born population - Bulgaria (%)
Place of birth for the foreign-born population - Croatia (%)
Place of birth for the foreign-born population - Czechoslovakia (%)
Place of birth for the foreign-born population - Hungary (%)
Place of birth for the foreign-born population - Latvia (%)
Place of birth for the foreign-born population - Lithuania (%)
Place of birth for the foreign-born population - North Macedonia (Macedonia) (%)
Place of birth for the foreign-born population - Moldova (%)
Place of birth for the foreign-born population - Poland (%)
Place of birth for the foreign-born population - Romania (%)
Place of birth for the foreign-born population - Russia (%)
Place of birth for the foreign-born population - Serbia (%)
Place of birth for the foreign-born population - Ukraine (%)
Place of birth for the foreign-born population - Other Eastern Europe (%)
Place of birth for the foreign-born population - China (%)
Place of birth for the foreign-born population - Hong Kong (%)
Place of birth for the foreign-born population - Taiwan (%)
Place of birth for the foreign-born population - Japan (%)
Place of birth for the foreign-born population - Korea (%)
Place of birth for the foreign-born population - Other Eastern Asia (%)
Place of birth for the foreign-born population - Afghanistan (%)
Place of birth for the foreign-born population - Bangladesh (%)
Place of birth for the foreign-born population - India (%)
Place of birth for the foreign-born population - Iran (%)
Place of birth for the foreign-born population - Kazakhstan (%)
Place of birth for the foreign-born population - Nepal (%)
Place of birth for the foreign-born population - Pakistan (%)
Place of birth for the foreign-born population - Sri Lanka (%)
Place of birth for the foreign-born population - Uzbekistan (%)
Place of birth for the foreign-born population - Other South Central Asia (%)
Place of birth for the foreign-born population - Burma (%)
Place of birth for the foreign-born population - Cambodia (%)
Place of birth for the foreign-born population - Indonesia (%)
Place of birth for the foreign-born population - Laos (%)
Place of birth for the foreign-born population - Malaysia (%)
Place of birth for the foreign-born population - Philippines (%)
Place of birth for the foreign-born population - Singapore (%)
Place of birth for the foreign-born population - Thailand (%)
Place of birth for the foreign-born population - Vietnam (%)
Place of birth for the foreign-born population - Other South Eastern Asia (%)
Place of birth for the foreign-born population - Armenia (%)
Place of birth for the foreign-born population - Iraq (%)
Place of birth for the foreign-born population - Israel (%)
Place of birth for the foreign-born population - Jordan (%)
Place of birth for the foreign-born population - Kuwait (%)
Place of birth for the foreign-born population - Lebanon (%)
Place of birth for the foreign-born population - Saudi Arabia (%)
Place of birth for the foreign-born population - Syria (%)
Place of birth for the foreign-born population - Turkey (%)
Place of birth for the foreign-born population - Yemen (%)
Place of birth for the foreign-born population - Other Western Asia (%)
Place of birth for the foreign-born population - Eritrea (%)
Place of birth for the foreign-born population - Ethiopia (%)
Place of birth for the foreign-born population - Kenya (%)
Place of birth for the foreign-born population - Somalia (%)
Place of birth for the foreign-born population - Uganda (%)
Place of birth for the foreign-born population - Zimbabwe (%)
Place of birth for the foreign-born population - Other Eastern Africa (%)
Place of birth for the foreign-born population - Cameroon (%)
Place of birth for the foreign-born population - Congo (%)
Place of birth for the foreign-born population - Democratic Republic of Congo (Zaire) (%)
Place of birth for the foreign-born population - Other Middle Africa (%)
Place of birth for the foreign-born population - Egypt (%)
Place of birth for the foreign-born population - Morocco (%)
Place of birth for the foreign-born population - Sudan (%)
Place of birth for the foreign-born population - Other Northern Africa (%)
Place of birth for the foreign-born population - South Africa (%)
Place of birth for the foreign-born population - Other Southern Africa (%)
Place of birth for the foreign-born population - Cabo Verde (%)
Place of birth for the foreign-born population - Ghana (%)
Place of birth for the foreign-born population - Liberia (%)
Place of birth for the foreign-born population - Nigeria (%)
Place of birth for the foreign-born population - Senegal (%)
Place of birth for the foreign-born population - Sierra Leone (%)
Place of birth for the foreign-born population - Other Western Africa (%)
Place of birth for the foreign-born population - Australia (%)
Place of birth for the foreign-born population - New Zealand (%)
Place of birth for the foreign-born population - Fiji (%)
Place of birth for the foreign-born population - Micronesia (%)
Place of birth for the foreign-born population - Bahamas (%)
Place of birth for the foreign-born population - Barbados (%)
Place of birth for the foreign-born population - Cuba (%)
Place of birth for the foreign-born population - Dominica (%)
Place of birth for the foreign-born population - Dominican Republic (%)
Place of birth for the foreign-born population - Grenada (%)
Place of birth for the foreign-born population - Haiti (%)
Place of birth for the foreign-born population - Jamaica (%)
Place of birth for the foreign-born population - St. Vincent and the Grenadines (%)
Place of birth for the foreign-born population - Trinidad and Tobago (%)
Place of birth for the foreign-born population - West Indies (%)
Place of birth for the foreign-born population - Other Caribbean (%)
Place of birth for the foreign-born population - Belize (%)
Place of birth for the foreign-born population - Costa Rica (%)
Place of birth for the foreign-born population - El Salvador (%)
Place of birth for the foreign-born population - Guatemala (%)
Place of birth for the foreign-born population - Honduras (%)
Place of birth for the foreign-born population - Mexico (%)
Place of birth for the foreign-born population - Nicaragua (%)
Place of birth for the foreign-born population - Panama (%)
Place of birth for the foreign-born population - Other Central America (%)
Place of birth for the foreign-born population - Argentina (%)
Place of birth for the foreign-born population - Bolivia (%)
Place of birth for the foreign-born population - Brazil (%)
Place of birth for the foreign-born population - Chile (%)
Place of birth for the foreign-born population - Colombia (%)
Place of birth for the foreign-born population - Ecuador (%)
Place of birth for the foreign-born population - Guyana (%)
Place of birth for the foreign-born population - Peru (%)
Place of birth for the foreign-born population - Uruguay (%)
Place of birth for the foreign-born population - Venezuela (%)
Place of birth for the foreign-born population - Other South America (%)
Place of birth for the foreign-born population - Canada (%)
Place of birth for the foreign-born population - Other Northern America (%)
Place of birth for the foreign-born population - Other (%)
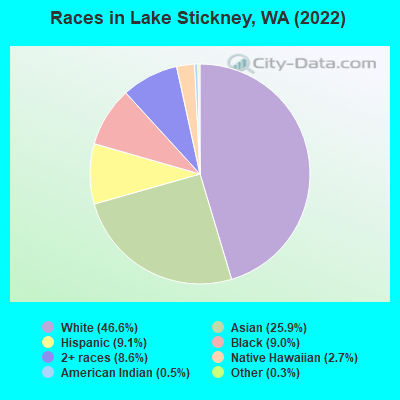
According to 2022 data, the most numerous races in Lake Stickney, WA are White alone (6,938 residents), Hispanic (1,347 residents), and Asian alone (3,851 residents). 60.0% of Lake Stickney residents speak English at home.
Race distribution in Lake Stickney 6,938 46.6% White alone 3,851 25.9% Asian alone 1,347 9.1% Hispanic 1,332 9.0% Black alone 1,276 8.6% Two or more races 397 2.7% Native Hawaiian and Other 68 0.5% American Indian alone 40 0.3% Other race alone
2000 2022
4,652,490 78.9% White alone 441,509 7.5% Hispanic 319,401 5.4% Asian alone 184,631 3.1% Black alone 175,926 3.0% Two or more races 85,396 1.4% American Indian alone 22,779 0.4% Native Hawaiian and Other 11,989 0.2% Other race alone
4,941,456 63.5% White alone 1,093,313 14.0% Hispanic 755,832 9.7% Asian alone 523,448 6.7% Two or more races 299,537 3.8% Black alone 69,024 0.9% American Indian alone 52,231 0.7% Native Hawaiian and Other 50,945 0.7% Other race alone
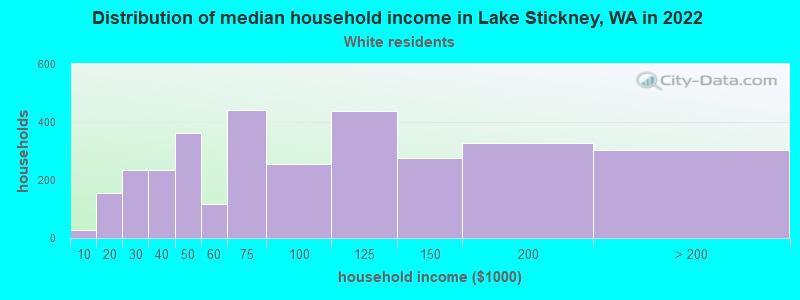
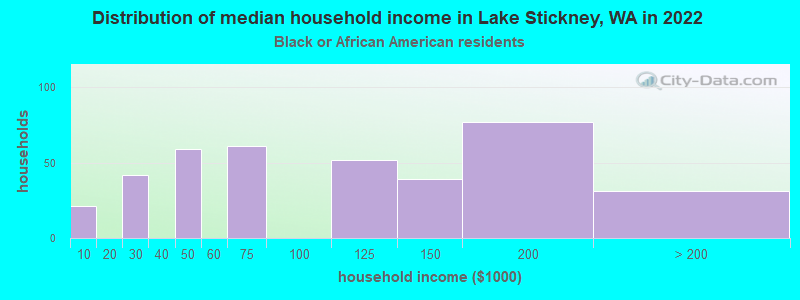
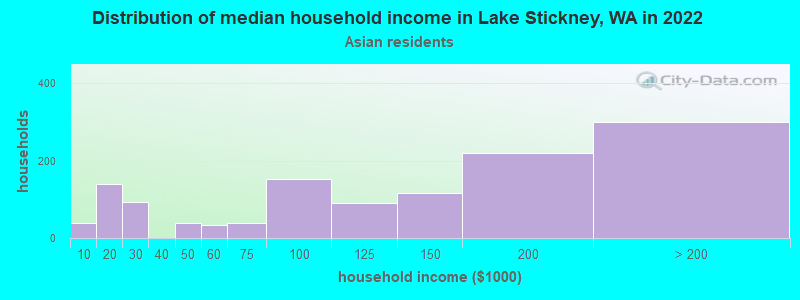
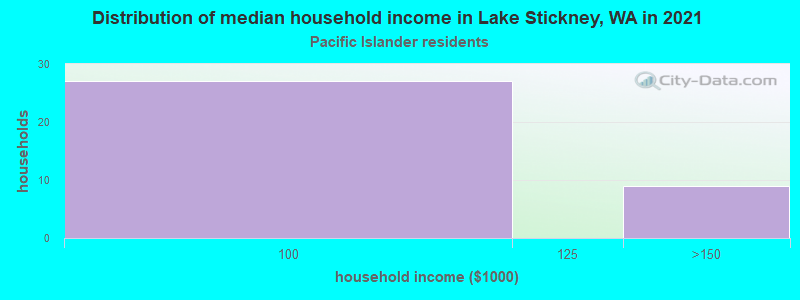
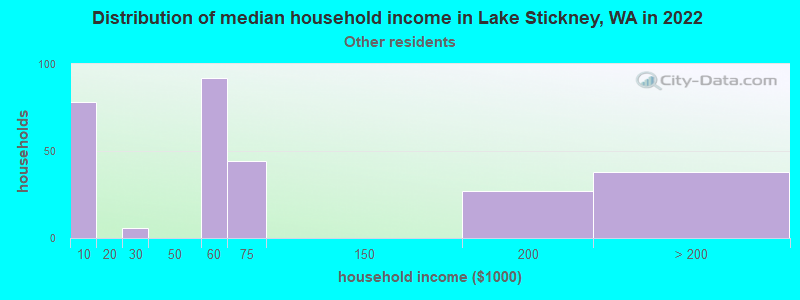
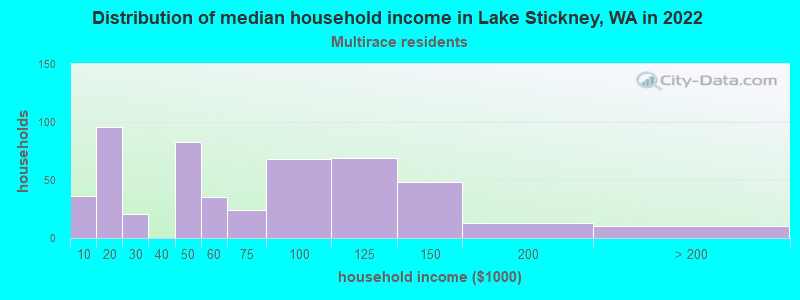
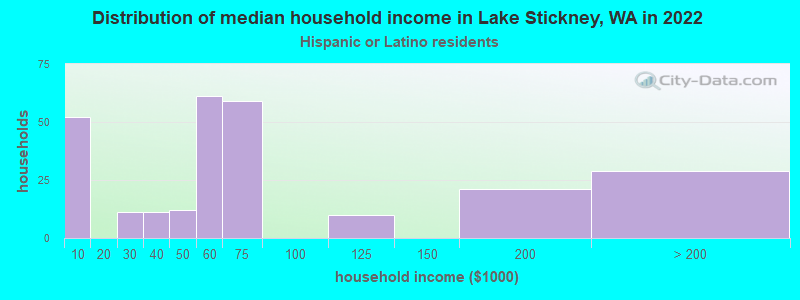
Income and house value in Lake Stickney Median household income in 2022 $72,150 White non-Hispanic householders$117,750 Black householders$108,599 Asian householders$55,646 Some other race householders$57,064 Two or more races householders$53,339 Hispanic or Latino race householders
Median age by race in Lake Stickney
38.0 Median age for White residents35.8 41.6 29.8 Median age for Black or African American residents37.6 28.7 46.4 Median age for American Indian / Alaska Native residents52.4 -589,658,965.3 36.3 Median age for Asian residents39.7 34.5 24.0 Median age for Native Hawaiian / Pacific Islander residents13.8 30.0 29.4 Median age for Other race residents23.7 35.3 23.1 Median age for Two or more races residents19.9 28.2 38.0 Median age for White alone residents37.0 41.0 17.7 Median age for Hispanic or Latino residents12.8 34.9
Owner/renter occupied households by race in Lake Stickney
House owners and renters - White residents 1,590 47.3% Owner occupied1,771 52.7% Renter occupiedHouse owners and renters - Black or African American residents 190 52.8% Owner occupied170 47.2% Renter occupiedHouse owners and renters - American Indian / Alaska Native residents 12 100.0% Owner occupiedHouse owners and renters - Asian residents 1,049 72.8% Owner occupied392 27.2% Renter occupiedHouse owners and renters - Native Hawaiian / Pacific Islander residents 30 28.6% Owner occupied74 71.4% Renter occupiedHouse owners and renters - Other race residents 93 35.3% Owner occupied170 64.7% Renter occupiedHouse owners and renters - Two or more races residents 216 41.5% Owner occupied304 58.5% Renter occupiedHouse owners and renters - White alone residents 1,613 47.9% Owner occupied1,753 52.1% Renter occupiedHouse owners and renters - Hispanic or Latino residents 88 32.2% Owner occupied186 67.8% Renter occupied
Language usage in Lake Stickney
English speakers - Total 60.0% of residents of Lake Stickney speak English at home.
5.9% of residents speak Spanish at home 612 73.9% Speak English very well216 26.1% Speak English less than very well34.3% of residents speak other language at home 2,950 61.1% Speak English very well1,876 38.9% Speak English less than very well
English speakers - Born in the United States 89.3% of residents of Lake Stickney speak English at home.
5.1% of residents speak Spanish at home 209 100.0% Speak English very well5.5% of residents speak other language at home 161 71.2% Speak English very well65 28.8% Speak English less than very well
English speakers - Native, born elsewhere 36.9% of residents of Lake Stickney speak English at home.
1.7% of residents speak Spanish at home 11 100.0% Speak English less than very well66.2% of residents speak other language at home 409 93.8% Speak English very well27 6.2% Speak English less than very well
English speakers - Foreign-born 13.7% of residents of Lake Stickney speak English at home.
4.7% of residents speak Spanish at home 69 33.8% Speak English very well135 66.2% Speak English less than very well81.6% of residents speak other language at home 1,901 53.4% Speak English very well1,659 46.6% Speak English less than very well
White (Caucasian) - Speak only English Native:
90.3% (5,565)Foreign-born:
27.3% (168)
White (Caucasian) - Speak another language Native:
8.5% (521)Foreign-born:
72.5% (445)
Black or African American - Speak only English Native:
76.6% (417)Foreign-born:
24.4% (175)
Black or African American - Speak another language Native:
27.6% (150)Foreign-born:
71.9% (515)
Asian - Speak only English Native:
39.8% (432)Foreign-born:
10.3% (260)
Asian - Speak another language Native:
60.5% (657)Foreign-born:
89.2% (2,243)
Native Hawaiian / Pacific Islander - Speak another language Native:
84.7% (180)Foreign-born:
74.1% (120)
Other race - Speak another language Native:
42.2% (272)Foreign-born:
96.4% (146)
Two or more races - Speak only English Native:
87.6% (1,050)Foreign-born:
9.4% (25)
Two or more races - Speak another language Native:
12.0% (144)Foreign-born:
88.5% (235)
White alone - Speak only English Native:
91.6% (5,507)Foreign-born:
24.1% (155)
White alone - Speak another language Native:
8.2% (491)Foreign-born:
76.7% (492)
Hispanic or Latino - Speak only English Native:
56.8% (525)Foreign-born:
14.2% (31)
Hispanic or Latino - Speak another language Native:
42.3% (390)Foreign-born:
86.2% (190)
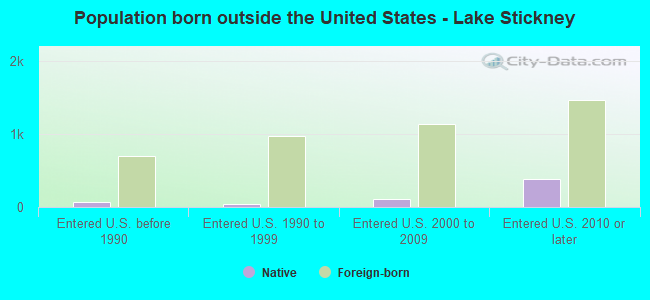
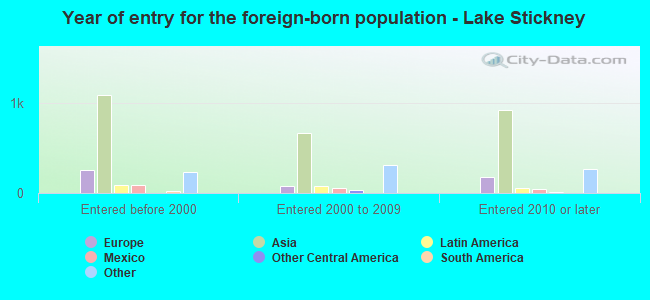
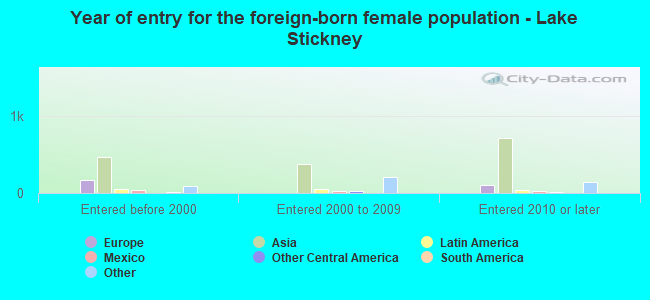
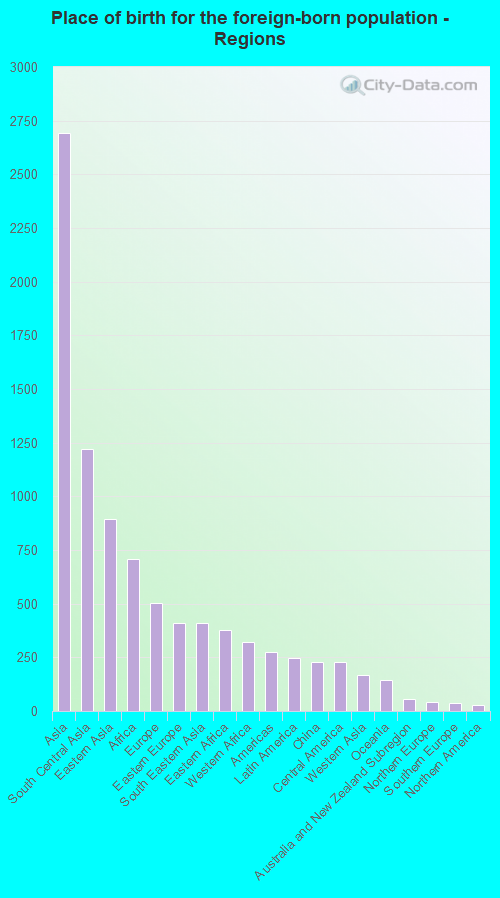
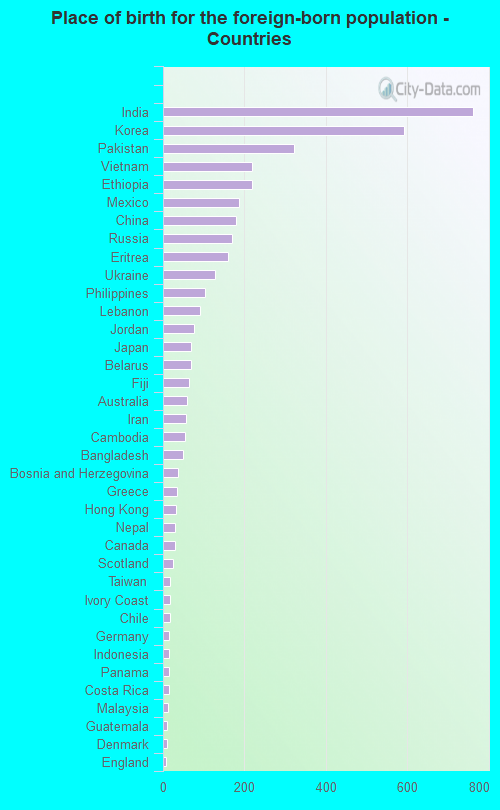
Foreign-born residents in Lake Stickney
Marital status for residents in Lake Stickney Marital status - White (Caucasian) population 15 years and over
Males 43.9% Never married43.5% Now married0.6% Separated1.7% Widowed10.4% DivorcedFemales 28.6% Never married40.5% Now married1.6% Separated7.4% Widowed21.8% DivorcedWomen who gave birth in the past 12 months Now married:
100.0% (64)Unmarried:
0.0% (0)
Women who did not give birth in the past 12 months Now married:
43.5% (744)Unmarried:
56.5% (967)
Marital status - Black or African American population 15 years and over
Males 23.4% Never married53.6% Now married5.9% Separated0.3% Widowed16.8% DivorcedFemales 42.4% Never married43.8% Now married0.0% Separated10.4% Widowed3.3% DivorcedWomen who gave birth in the past 12 months Now married:
0.0% (0)Unmarried:
100.0% (16)
Women who did not give birth in the past 12 months Now married:
36.1% (123)Unmarried:
63.9% (217)
Marital status - American Indian / Alaska Native population 15 years and over
Males 12.8% Never married61.5% Now married0.0% Separated0.0% Widowed25.6% DivorcedFemales 0.0% Never married100.0% Now married0.0% Separated0.0% Widowed0.0% DivorcedMarital status - Asian population 15 years and over
Males 21.4% Never married71.8% Now married0.0% Separated0.0% Widowed6.8% DivorcedFemales 19.0% Never married64.3% Now married0.0% Separated8.2% Widowed8.5% DivorcedWomen who gave birth in the past 12 months Now married:
51.3% (22)Unmarried:
48.7% (21)
Women who did not give birth in the past 12 months Now married:
68.1% (738)Unmarried:
31.9% (345)
Marital status - Native Hawaiian / Pacific Islander population 15 years and over
Males 0.0% Never married100.0% Now married0.0% Separated0.0% Widowed0.0% DivorcedFemales 58.2% Never married29.6% Now married0.0% Separated12.2% Widowed0.0% DivorcedWomen who did not give birth in the past 12 months Now married:
16.7% (24)Unmarried:
83.3% (118)
Marital status - Other race population 15 years and over
Males 65.0% Never married20.0% Now married15.0% Separated0.0% Widowed0.0% DivorcedFemales 52.9% Never married20.6% Now married0.0% Separated0.0% Widowed26.5% DivorcedWomen who gave birth in the past 12 months Now married:
0.0% (0)Unmarried:
100.0% (20)
Women who did not give birth in the past 12 months Now married:
23.0% (39)Unmarried:
77.0% (133)
Marital status - Two or more races population 15 years and over
Males 64.1% Never married22.8% Now married0.0% Separated0.0% Widowed13.1% DivorcedFemales 37.6% Never married44.9% Now married5.7% Separated11.8% Widowed0.0% DivorcedWomen who did not give birth in the past 12 months Now married:
42.6% (126)Unmarried:
57.4% (170)
Marital status - White alone, not Hispanic / Latino population 15 years and over
Males 43.8% Never married43.4% Now married0.6% Separated1.7% Widowed10.5% DivorcedFemales 28.6% Never married39.6% Now married1.7% Separated7.7% Widowed22.4% DivorcedWomen who gave birth in the past 12 months Now married:
100.0% (49)Unmarried:
0.0% (0)
Women who did not give birth in the past 12 months Now married:
43.7% (746)Unmarried:
56.3% (961)
Marital status - Hispanic or Latino population 15 years and over
Males 66.6% Never married22.7% Now married10.7% Separated0.0% Widowed0.0% DivorcedFemales 34.5% Never married53.4% Now married0.0% Separated0.0% Widowed12.2% DivorcedWomen who gave birth in the past 12 months Now married:
37.8% (18)Unmarried:
62.2% (30)
Women who did not give birth in the past 12 months Now married:
44.4% (94)Unmarried:
55.6% (118)
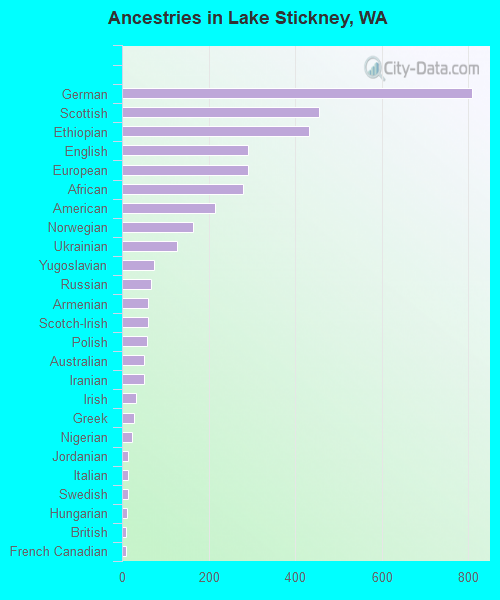
Ancestries in Lake Stickney
808 9.5% German456 5.4% Scottish432 5.1% Ethiopian291 3.4% English291 3.4% European279 3.3% African215 2.5% American165 1.9% Norwegian126 1.5% Ukrainian74 0.9% Yugoslavian67 0.8% Russian60 0.7% Armenian60 0.7% Scotch-Irish57 0.7% Polish52 0.6% Australian50 0.6% Iranian32 0.4% Irish27 0.3% Greek22 0.3% Nigerian13 0.2% Jordanian13 0.2% Italian13 0.2% Swedish11 0.1% Hungarian9 0.1% British9 0.1% French Canadian8 0.09% Egyptian8 0.09% Canadian2 0.02% French1 0.01% Romanian
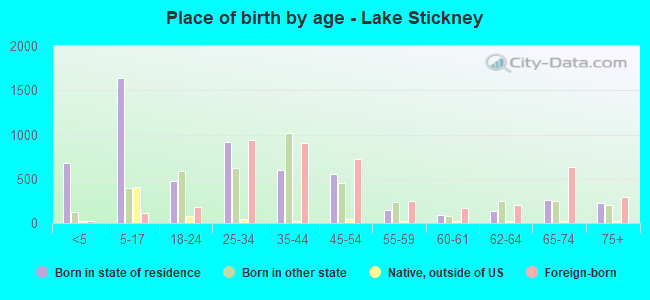
Children Nativity (place of birth) in Lake Stickney
Children under 6 years - Living with two parents Both parents native 409 100.0% NativeBoth parents foreign-born 229 100.0% NativeOne native, one foreign-born parent 78 100.0% NativeChildren under 6 years - Living with one parent Native parent 110 100.0% NativeForeign-born parent 29 100.0% NativeChildren 6 to 17 years - Living with two parents Both parents native 673 100.0% NativeBoth parents foreign-born 668 87.3% Native97 12.7% Foreign-bornOne native, one foreign-born parent 224 100.0% NativeChildren 6 to 17 years - Living with one parent Native parent 425 100.0% NativeForeign-born parent 262 51.3% Native248 48.7% Foreign-born
Grandparents responsible for own grandchildren in Lake Stickney
Grandparents (30 to 59 years) White / Caucasian 24 34.4% Responsible for grandchildren45 65.6% Not responsible for grandchildrenBlack or African American 17 100.0% Responsible for grandchildrenAsian 13 100.0% Not responsible for grandchildrenTwo or more races 28 100.0% Responsible for grandchildrenWhite alone, not Hispanic / Latino 25 34.5% Responsible for grandchildren48 65.5% Not responsible for grandchildrenGrandparents (60 years and over) White / Caucasian 10 16.4% Responsible for grandchildren51 83.6% Not responsible for grandchildrenBlack or African American 51 100.0% Not responsible for grandchildrenAsian 80 100.0% Not responsible for grandchildrenTwo or more races 28 100.0% Not responsible for grandchildrenWhite alone, not Hispanic / Latino 10 15.9% Responsible for grandchildren53 84.1% Not responsible for grandchildren