Races in Lake Tomahawk, Wisconsin (WI) Detailed Stats
Ancestries, Foreign-born residents, place of birth

Data:
1.0% of Lake Tomahawk, WI residents are foreign-born , which is 383.3% less than the foreign-born rate of 5.0% across the entire state of Wisconsin.
Race distribution in Lake Tomahawk

- 1,08993.9%White alone
- 484.1%Black alone
- 80.7%Hispanic
- 80.7%American Indian alone
- 40.3%Two or more races
- 30.3%Asian alone
2000
2022
-
- 4,681,63087.3%White alone
- 300,2455.6%Black alone
- 192,9213.6%Hispanic
- 87,9951.6%Asian alone
- 51,9211.0%Two or more races
- 43,9800.8%American Indian alone
- 3,6370.07%Other race alone
- 1,3460.03%Native Hawaiian and Other
Pacific Islander alone
-
- 4,654,03179.0%White alone
- 447,0227.6%Hispanic
- 345,6785.9%Black alone
- 217,5323.7%Two or more races
- 172,2422.9%Asian alone
- 33,7620.6%American Indian alone
- 19,6800.3%Other race alone
- 2,5920.04%Native Hawaiian and Other
Pacific Islander alone
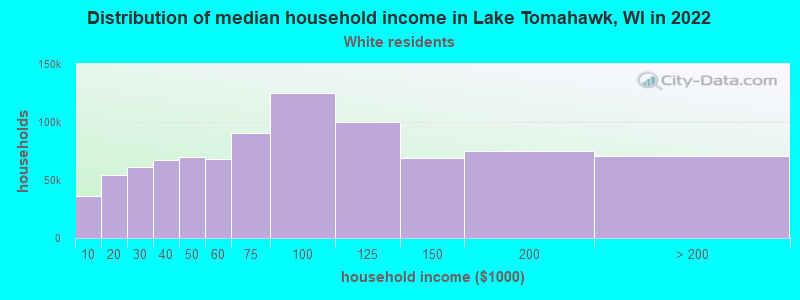
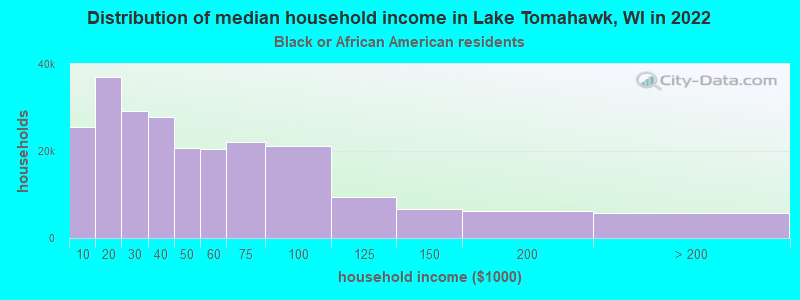
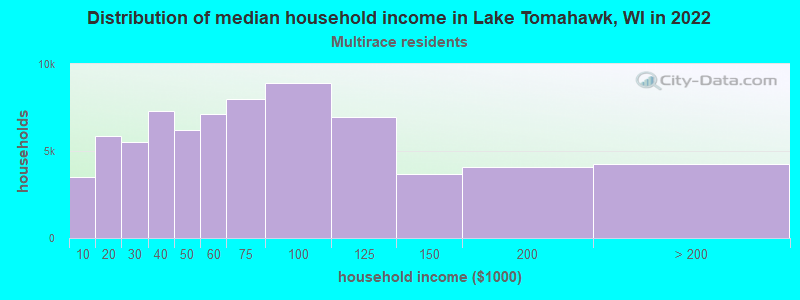
Income and house value in Lake Tomahawk
- Median household income in 2022
- $64,384White non-Hispanic householders
- $35,765Black householders
- $66,548Two or more races householders
- Median 2022 house value
- $255,198White Non-Hispanic householders
- $28,355Black or African American householders
Foreign-born residents in Lake Tomahawk
12 residents are foreign born
| This city: | 1.0% |
| Wisconsin: | 3.6% |
Ancestries in Lake Tomahawk

- 51236.7%German
- 1329.5%Other
- 1198.5%Polish
- 1148.2%Irish
- 1017.2%English
- 926.6%Norwegian
- 493.5%Italian
- 443.2%United States
- 412.9%Czech
- 402.9%Swedish
- 352.5%French
- 211.5%Dutch
- 191.4%French Canadian
- 171.2%Scotch-Irish
- 151.1%Lithuanian
- 100.7%Danish
- 100.7%Scottish
- 100.7%Swiss
- 90.6%Welsh
- 30.2%Russian
- 10.07%Slovak