Races in Lake Wales, Florida (FL) Detailed Stats
Data:
Races - White alone (%)
Races - White alone (% change since 2000)
Races - Black alone (%)
Races - Black alone (% change since 2000)
Races - American Indian alone (%)
Races - American Indian alone (% change since 2000)
Races - Asian alone (%)
Races - Asian alone (% change since 2000)
Races - Hispanic (%)
Races - Hispanic (% change since 2000)
Races - Native Hawaiian and Other Pacific Islander alone (%)
Races - Native Hawaiian and Other Pacific Islander alone (% change since 2000)
Races - Two or more races(%)
Races - Two or more races(% change since 2000)
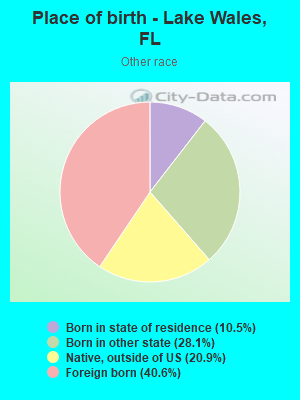
Races - Other race alone (%)
Races - Other race alone (% change since 2000)
Racial diversity
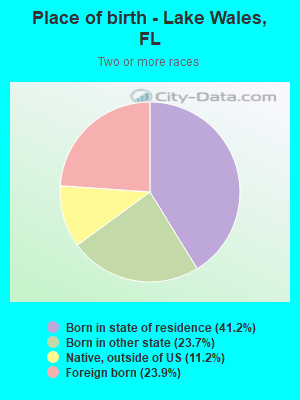
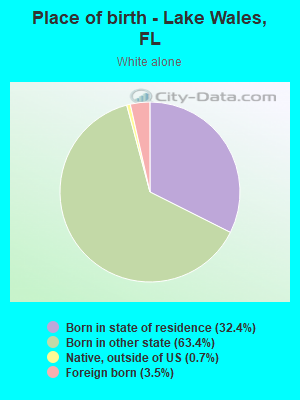
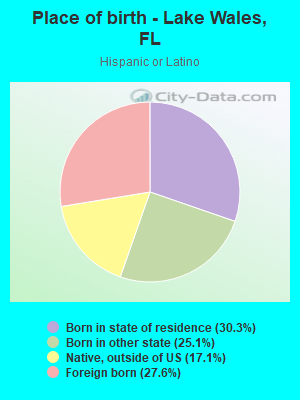
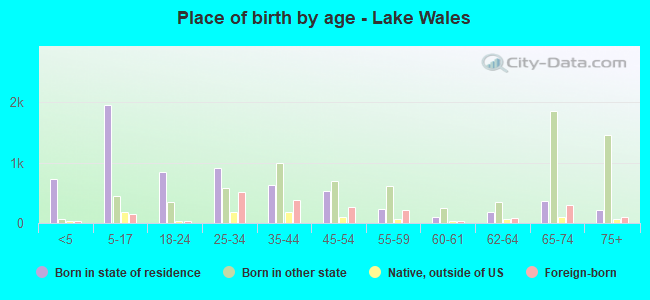
Place of birth - Born in state of residence (%)
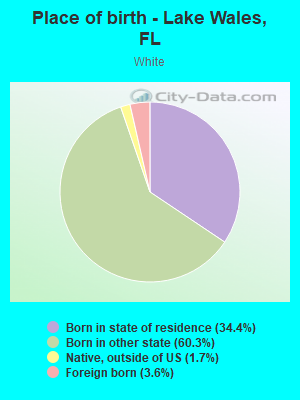
Place of birth - Born in state of residence (%) - White
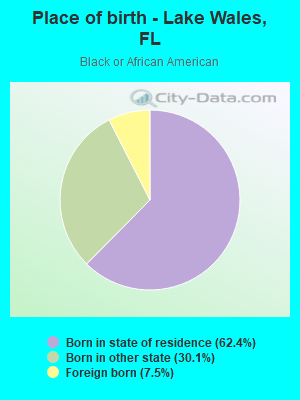
Place of birth - Born in state of residence (%) - Black or African American
Place of birth - Born in state of residence (%) - Asian
Place of birth - Born in state of residence (%) - Hispanic or Latino
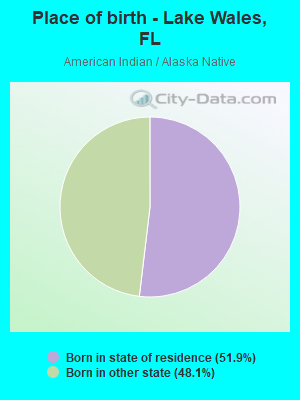
Place of birth - Born in state of residence (%) - American Indian and Alaska Native
Place of birth - Born in state of residence (%) - Multirace
Place of birth - Born in state of residence (%) - Other Race
Place of birth - Born in other state (%)
Place of birth - Born in other state (%) - White
Place of birth - Born in other state (%) - Black or African American
Place of birth - Born in other state (%) - Asian
Place of birth - Born in other state (%) - Hispanic or Latino
Place of birth - Born in other state (%) - American Indian and Alaska Native
Place of birth - Born in other state (%) - Multirace
Place of birth - Born in other state (%) - Other Race
Place of birth - Native, outside of US (%)
Place of birth - Native, outside of US (%) - White
Place of birth - Native, outside of US (%) - Black or African American
Place of birth - Native, outside of US (%) - Asian
Place of birth - Native, outside of US (%) - Hispanic or Latino
Place of birth - Native, outside of US (%) - American Indian and Alaska Native
Place of birth - Native, outside of US (%) - Multirace
Place of birth - Native, outside of US (%) - Other Race
Place of birth - Foreign born (%)
Place of birth - Foreign born (%) - White
Place of birth - Foreign born (%) - Black or African American
Place of birth - Foreign born (%) - Asian
Place of birth - Foreign born (%) - Hispanic or Latino
Place of birth - Foreign born (%) - American Indian and Alaska Native
Place of birth - Foreign born (%) - Multirace
Place of birth - Foreign born (%) - Other Race
Residents speaking English at home (%)
Residents speaking English at home - Born in the United States (%)
Residents speaking English at home - Native, born elsewhere (%)
Residents speaking English at home - Foreign born (%)
Residents speaking Spanish at home (%)
Residents speaking Spanish at home - Born in the United States (%)
Residents speaking Spanish at home - Native, born elsewhere (%)
Residents speaking Spanish at home - Foreign born (%)
Residents speaking other language at home (%)
Residents speaking other language at home - Born in the United States (%)
Residents speaking other language at home - Native, born elsewhere (%)
Residents speaking other language at home - Foreign born (%)
Marital status - Never married (%)
Marital status - Now married (%)
Marital status - Separated (%)
Marital status - Widowed (%)
Marital status - Divorced (%)
Ancestries Reported - Arab (%)
Ancestries Reported - Czech (%)
Ancestries Reported - Danish (%)
Ancestries Reported - Dutch (%)
Ancestries Reported - English (%)
Ancestries Reported - French (%)
Ancestries Reported - French Canadian (%)
Ancestries Reported - German (%)
Ancestries Reported - Greek (%)
Ancestries Reported - Hungarian (%)
Ancestries Reported - Irish (%)
Ancestries Reported - Italian (%)
Ancestries Reported - Lithuanian (%)
Ancestries Reported - Norwegian (%)
Ancestries Reported - Polish (%)
Ancestries Reported - Portuguese (%)
Ancestries Reported - Russian (%)
Ancestries Reported - Scotch-Irish (%)
Ancestries Reported - Scottish (%)
Ancestries Reported - Slovak (%)
Ancestries Reported - Subsaharan African (%)
Ancestries Reported - Swedish (%)
Ancestries Reported - Swiss (%)
Ancestries Reported - Ukrainian (%)
Ancestries Reported - United States (%)
Ancestries Reported - Welsh (%)
Ancestries Reported - West Indian (%)
Ancestries Reported - Other (%)
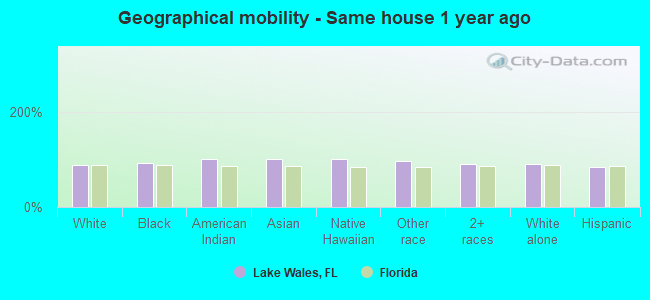
Geographical mobility - Same house 1 year ago (%)
Geographical mobility - Same house 1 year ago (%) - White
Geographical mobility - Same house 1 year ago (%) - Black or African American
Geographical mobility - Same house 1 year ago (%) - Asian
Geographical mobility - Same house 1 year ago (%) - Hispanic or Latino
Geographical mobility - Same house 1 year ago (%) - American Indian and Alaska Native
Geographical mobility - Same house 1 year ago (%) - Multirace
Geographical mobility - Same house 1 year ago (%) - Other Race
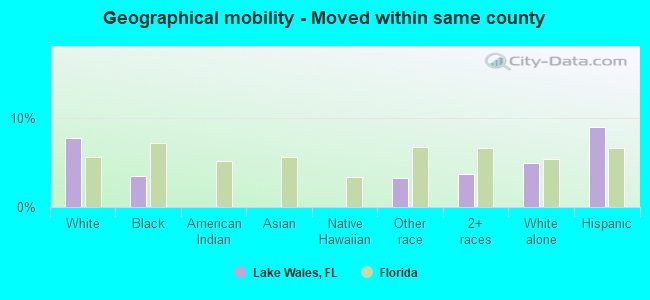
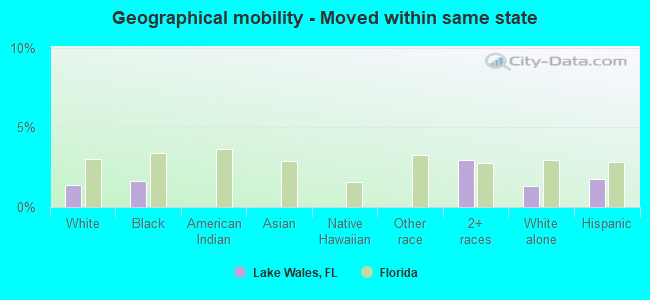
Geographical mobility - Moved within same county (%)
Geographical mobility - Moved within same county (%) - White
Geographical mobility - Moved within same county (%) - Black or African American
Geographical mobility - Moved within same county (%) - Asian
Geographical mobility - Moved within same county (%) - Hispanic or Latino
Geographical mobility - Moved within same county (%) - American Indian and Alaska Native
Geographical mobility - Moved within same county (%) - Multirace
Geographical mobility - Moved within same county (%) - Other Race
Geographical mobility - Moved from different county within same state (%)
Geographical mobility - Moved from different county within same state (%) - White
Geographical mobility - Moved from different county within same state (%) - Black or African American
Geographical mobility - Moved from different county within same state (%) - Asian
Geographical mobility - Moved from different county within same state (%) - Hispanic or Latino
Geographical mobility - Moved from different county within same state (%) - American Indian and Alaska Native
Geographical mobility - Moved from different county within same state (%) - Multirace
Geographical mobility - Moved from different county within same state (%) - Other Race
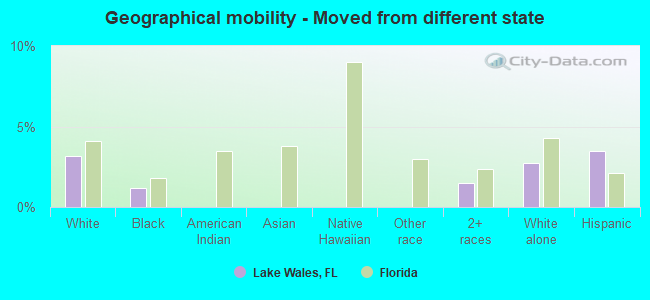
Geographical mobility - Moved from different state (%)
Geographical mobility - Moved from different state (%) - White
Geographical mobility - Moved from different state (%) - Black or African American
Geographical mobility - Moved from different state (%) - Asian
Geographical mobility - Moved from different state (%) - Hispanic or Latino
Geographical mobility - Moved from different state (%) - American Indian and Alaska Native
Geographical mobility - Moved from different state (%) - Multirace
Geographical mobility - Moved from different state (%) - Other Race
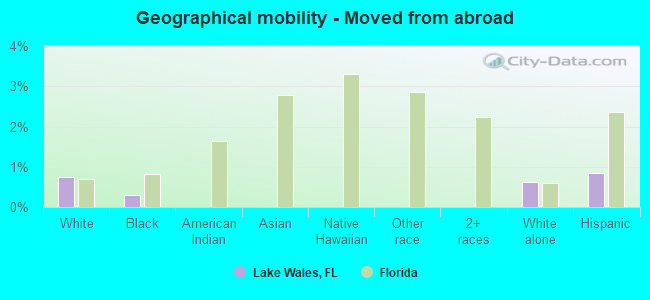
Geographical mobility - Moved from abroad (%)
Geographical mobility - Moved from abroad (%) - White
Geographical mobility - Moved from abroad (%) - Black or African American
Geographical mobility - Moved from abroad (%) - Asian
Geographical mobility - Moved from abroad (%) - Hispanic or Latino
Geographical mobility - Moved from abroad (%) - American Indian and Alaska Native
Geographical mobility - Moved from abroad (%) - Multirace
Geographical mobility - Moved from abroad (%) - Other Race
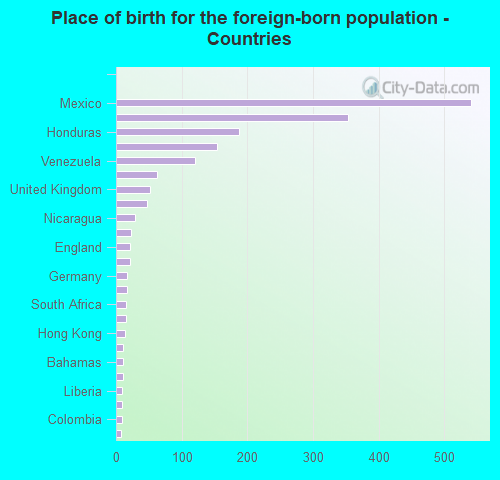
Place of birth for the foreign-born population - Ireland (%)
Place of birth for the foreign-born population - Denmark (%)
Place of birth for the foreign-born population - Norway (%)
Place of birth for the foreign-born population - Sweden (%)
Place of birth for the foreign-born population - United Kingdom (%)
Place of birth for the foreign-born population - England (%)
Place of birth for the foreign-born population - Scotland (%)
Place of birth for the foreign-born population - Other Northern Europe (%)
Place of birth for the foreign-born population - Austria (%)
Place of birth for the foreign-born population - Belgium (%)
Place of birth for the foreign-born population - France (%)
Place of birth for the foreign-born population - Germany (%)
Place of birth for the foreign-born population - Netherlands (%)
Place of birth for the foreign-born population - Switzerland (%)
Place of birth for the foreign-born population - Other Western Europe (%)
Place of birth for the foreign-born population - Greece (%)
Place of birth for the foreign-born population - Italy (%)
Place of birth for the foreign-born population - Portugal (%)
Place of birth for the foreign-born population - Spain (%)
Place of birth for the foreign-born population - Other Southern Europe (%)
Place of birth for the foreign-born population - Albania (%)
Place of birth for the foreign-born population - Belarus (%)
Place of birth for the foreign-born population - Bosnia and Herzegovina (%)
Place of birth for the foreign-born population - Bulgaria (%)
Place of birth for the foreign-born population - Croatia (%)
Place of birth for the foreign-born population - Czechoslovakia (%)
Place of birth for the foreign-born population - Hungary (%)
Place of birth for the foreign-born population - Latvia (%)
Place of birth for the foreign-born population - Lithuania (%)
Place of birth for the foreign-born population - North Macedonia (Macedonia) (%)
Place of birth for the foreign-born population - Moldova (%)
Place of birth for the foreign-born population - Poland (%)
Place of birth for the foreign-born population - Romania (%)
Place of birth for the foreign-born population - Russia (%)
Place of birth for the foreign-born population - Serbia (%)
Place of birth for the foreign-born population - Ukraine (%)
Place of birth for the foreign-born population - Other Eastern Europe (%)
Place of birth for the foreign-born population - China (%)
Place of birth for the foreign-born population - Hong Kong (%)
Place of birth for the foreign-born population - Taiwan (%)
Place of birth for the foreign-born population - Japan (%)
Place of birth for the foreign-born population - Korea (%)
Place of birth for the foreign-born population - Other Eastern Asia (%)
Place of birth for the foreign-born population - Afghanistan (%)
Place of birth for the foreign-born population - Bangladesh (%)
Place of birth for the foreign-born population - India (%)
Place of birth for the foreign-born population - Iran (%)
Place of birth for the foreign-born population - Kazakhstan (%)
Place of birth for the foreign-born population - Nepal (%)
Place of birth for the foreign-born population - Pakistan (%)
Place of birth for the foreign-born population - Sri Lanka (%)
Place of birth for the foreign-born population - Uzbekistan (%)
Place of birth for the foreign-born population - Other South Central Asia (%)
Place of birth for the foreign-born population - Burma (%)
Place of birth for the foreign-born population - Cambodia (%)
Place of birth for the foreign-born population - Indonesia (%)
Place of birth for the foreign-born population - Laos (%)
Place of birth for the foreign-born population - Malaysia (%)
Place of birth for the foreign-born population - Philippines (%)
Place of birth for the foreign-born population - Singapore (%)
Place of birth for the foreign-born population - Thailand (%)
Place of birth for the foreign-born population - Vietnam (%)
Place of birth for the foreign-born population - Other South Eastern Asia (%)
Place of birth for the foreign-born population - Armenia (%)
Place of birth for the foreign-born population - Iraq (%)
Place of birth for the foreign-born population - Israel (%)
Place of birth for the foreign-born population - Jordan (%)
Place of birth for the foreign-born population - Kuwait (%)
Place of birth for the foreign-born population - Lebanon (%)
Place of birth for the foreign-born population - Saudi Arabia (%)
Place of birth for the foreign-born population - Syria (%)
Place of birth for the foreign-born population - Turkey (%)
Place of birth for the foreign-born population - Yemen (%)
Place of birth for the foreign-born population - Other Western Asia (%)
Place of birth for the foreign-born population - Eritrea (%)
Place of birth for the foreign-born population - Ethiopia (%)
Place of birth for the foreign-born population - Kenya (%)
Place of birth for the foreign-born population - Somalia (%)
Place of birth for the foreign-born population - Uganda (%)
Place of birth for the foreign-born population - Zimbabwe (%)
Place of birth for the foreign-born population - Other Eastern Africa (%)
Place of birth for the foreign-born population - Cameroon (%)
Place of birth for the foreign-born population - Congo (%)
Place of birth for the foreign-born population - Democratic Republic of Congo (Zaire) (%)
Place of birth for the foreign-born population - Other Middle Africa (%)
Place of birth for the foreign-born population - Egypt (%)
Place of birth for the foreign-born population - Morocco (%)
Place of birth for the foreign-born population - Sudan (%)
Place of birth for the foreign-born population - Other Northern Africa (%)
Place of birth for the foreign-born population - South Africa (%)
Place of birth for the foreign-born population - Other Southern Africa (%)
Place of birth for the foreign-born population - Cabo Verde (%)
Place of birth for the foreign-born population - Ghana (%)
Place of birth for the foreign-born population - Liberia (%)
Place of birth for the foreign-born population - Nigeria (%)
Place of birth for the foreign-born population - Senegal (%)
Place of birth for the foreign-born population - Sierra Leone (%)
Place of birth for the foreign-born population - Other Western Africa (%)
Place of birth for the foreign-born population - Australia (%)
Place of birth for the foreign-born population - New Zealand (%)
Place of birth for the foreign-born population - Fiji (%)
Place of birth for the foreign-born population - Micronesia (%)
Place of birth for the foreign-born population - Bahamas (%)
Place of birth for the foreign-born population - Barbados (%)
Place of birth for the foreign-born population - Cuba (%)
Place of birth for the foreign-born population - Dominica (%)
Place of birth for the foreign-born population - Dominican Republic (%)
Place of birth for the foreign-born population - Grenada (%)
Place of birth for the foreign-born population - Haiti (%)
Place of birth for the foreign-born population - Jamaica (%)
Place of birth for the foreign-born population - St. Vincent and the Grenadines (%)
Place of birth for the foreign-born population - Trinidad and Tobago (%)
Place of birth for the foreign-born population - West Indies (%)
Place of birth for the foreign-born population - Other Caribbean (%)
Place of birth for the foreign-born population - Belize (%)
Place of birth for the foreign-born population - Costa Rica (%)
Place of birth for the foreign-born population - El Salvador (%)
Place of birth for the foreign-born population - Guatemala (%)
Place of birth for the foreign-born population - Honduras (%)
Place of birth for the foreign-born population - Mexico (%)
Place of birth for the foreign-born population - Nicaragua (%)
Place of birth for the foreign-born population - Panama (%)
Place of birth for the foreign-born population - Other Central America (%)
Place of birth for the foreign-born population - Argentina (%)
Place of birth for the foreign-born population - Bolivia (%)
Place of birth for the foreign-born population - Brazil (%)
Place of birth for the foreign-born population - Chile (%)
Place of birth for the foreign-born population - Colombia (%)
Place of birth for the foreign-born population - Ecuador (%)
Place of birth for the foreign-born population - Guyana (%)
Place of birth for the foreign-born population - Peru (%)
Place of birth for the foreign-born population - Uruguay (%)
Place of birth for the foreign-born population - Venezuela (%)
Place of birth for the foreign-born population - Other South America (%)
Place of birth for the foreign-born population - Canada (%)
Place of birth for the foreign-born population - Other Northern America (%)
Place of birth for the foreign-born population - Other (%)
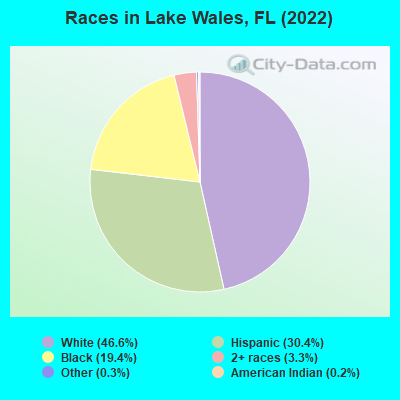
According to 2022 data, the most numerous races in Lake Wales, FL are White alone (8,201 residents), Hispanic (5,353 residents), and Black alone (3,407 residents). 74.6% of Lake Wales residents speak English at home. 10.1% of Lake Wales, FL residents are foreign-born (8.5% born in Latin America, 1.2% born in Europe), which is 108.8% less than the foreign-born rate of 21.0% across the entire state of Florida.
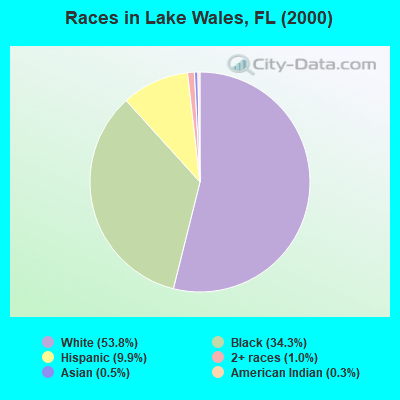
Race distribution in Lake Wales
2000 2022
10,458,509 65.4% White alone 2,682,715 16.8% Hispanic 2,264,268 14.2% Black alone 261,693 1.6% Asian alone 236,954 1.5% Two or more races 42,358 0.3% American Indian alone 28,994 0.2% Other race alone 6,887 0.04% Native Hawaiian and Other
11,309,403 50.8% White alone 6,025,039 27.1% Hispanic 3,241,015 14.6% Black alone 861,630 3.9% Two or more races 623,692 2.8% Asian alone 152,054 0.7% Other race alone 22,504 0.1% American Indian alone 9,486 0.04% Native Hawaiian and Other
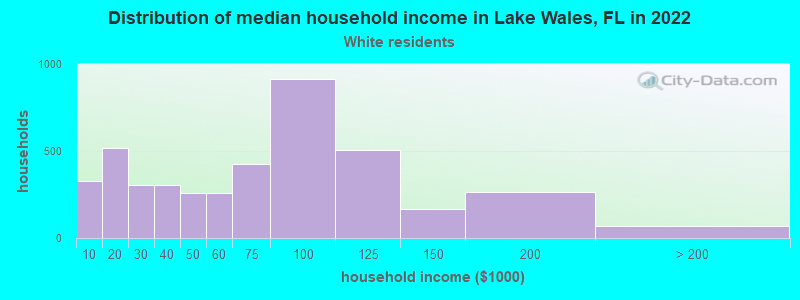
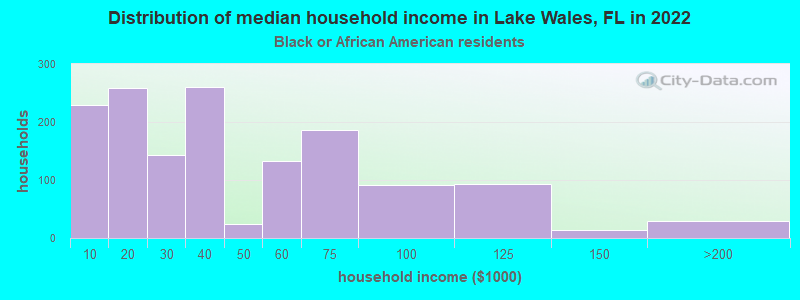
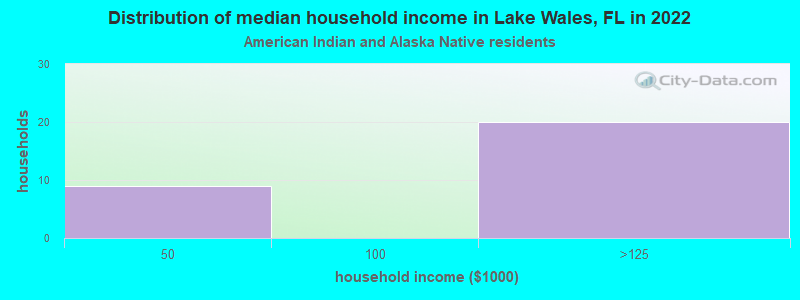
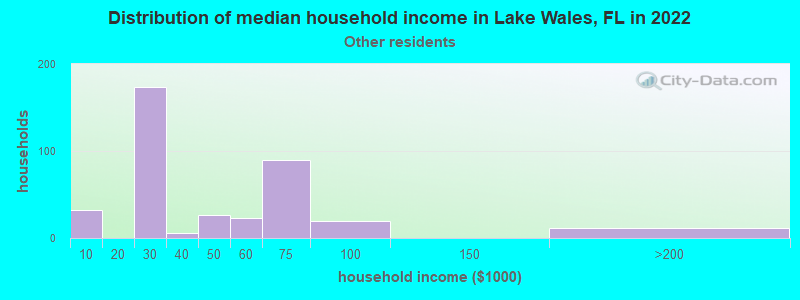
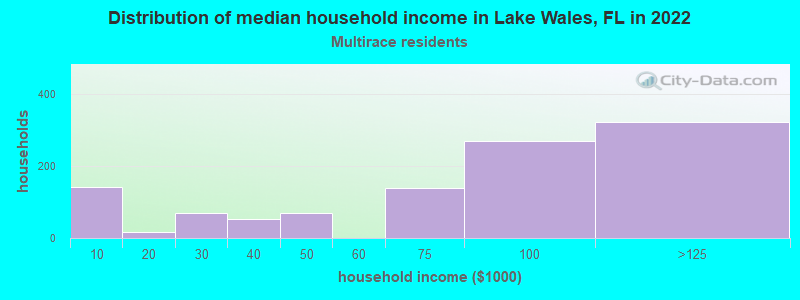
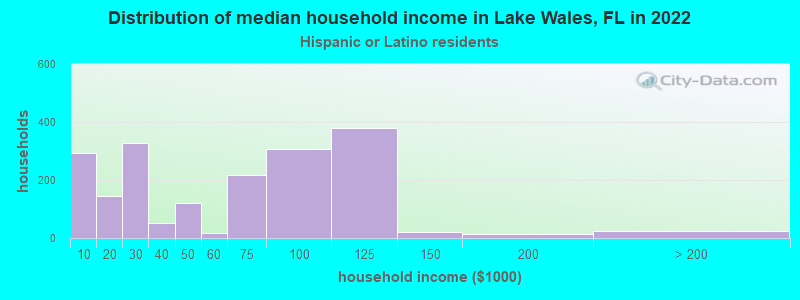
Income and house value in Lake Wales Median household income in 2022 $67,462 White non-Hispanic householders$31,867 Black householders$78,271 Two or more races householders$50,059 Hispanic or Latino race householdersMedian 2022 house value $285,450 White Non-Hispanic householders$180,961 Black or African American householders$215,412 Some other race householders$210,491 Two or more races householders$218,062 Hispanic or Latino householders
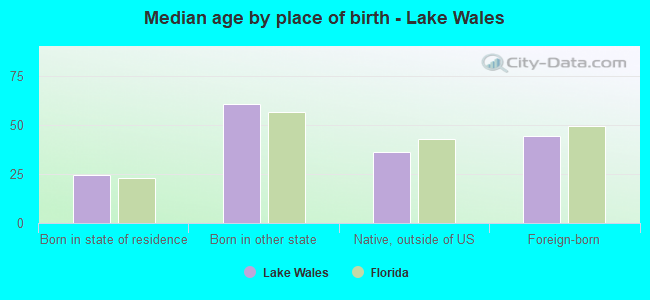
Median age by race in Lake Wales
57.3 Median age for White residents53.6 61.5 38.0 Median age for Black or African American residents31.9 40.9 50.3 Median age for American Indian / Alaska Native residents-899,908,171.7 44.8 -691,075,514.2 Median age for Asian residents-651,924,651.3 -671,071,952.3 -679,849,340.2 Median age for Native Hawaiian / Pacific Islander residents-858,307,848.3 -443,298,968.6 35.7 Median age for Other race residents25.5 37.4 35.9 Median age for Two or more races residents38.7 35.3 60.3 Median age for White alone residents59.4 60.6 34.6 Median age for Hispanic or Latino residents30.9 36.0
Owner/renter occupied households by race in Lake Wales
House owners and renters - White residents 2,980 69.2% Owner occupied1,325 30.8% Renter occupiedHouse owners and renters - Black or African American residents 708 49.8% Owner occupied714 50.2% Renter occupiedHouse owners and renters - American Indian / Alaska Native residents 38 100.0% Owner occupiedHouse owners and renters - Asian residents 4 100.0% Renter occupiedHouse owners and renters - Native Hawaiian / Pacific Islander residents 10 100.0% Renter occupiedHouse owners and renters - Other race residents 162 33.0% Owner occupied330 67.0% Renter occupiedHouse owners and renters - Two or more races residents 601 53.1% Owner occupied531 46.9% Renter occupiedHouse owners and renters - White alone residents 2,706 67.9% Owner occupied1,278 32.1% Renter occupiedHouse owners and renters - Hispanic or Latino residents 1,027 55.4% Owner occupied827 44.6% Renter occupied
Language usage in Lake Wales
English speakers - Total 74.6% of residents of Lake Wales speak English at home.
23.5% of residents speak Spanish at home 2,074 52.6% Speak English very well1,871 47.4% Speak English less than very well1.7% of residents speak other language at home 264 93.3% Speak English very well19 6.7% Speak English less than very well
English speakers - Born in the United States 88.5% of residents of Lake Wales speak English at home.
11.4% of residents speak Spanish at home 736 84.5% Speak English very well135 15.5% Speak English less than very well
English speakers - Native, born elsewhere 7.3% of residents of Lake Wales speak English at home.
91.0% of residents speak Spanish at home 397 44.6% Speak English very well494 55.4% Speak English less than very well
English speakers - Foreign-born 22.1% of residents of Lake Wales speak English at home.
70.6% of residents speak Spanish at home 309 21.4% Speak English very well1,136 78.6% Speak English less than very well8.2% of residents speak other language at home 159 95.2% Speak English very well8 4.8% Speak English less than very well
White (Caucasian) - Speak only English Native:
95.2% (7,929)Foreign-born:
57.2% (182)
White (Caucasian) - Speak another language Native:
5.3% (442)Foreign-born:
48.3% (154)
Black or African American - Speak only English Native:
97.1% (2,964)Foreign-born:
69.1% (169)
Black or African American - Speak another language Native:
3.0% (91)Foreign-born:
25.2% (62)
Other race - Speak another language Native:
61.0% (774)Foreign-born:
100.0% (828)
Two or more races - Speak only English Native:
32.7% (657)Foreign-born:
13.3% (111)
Two or more races - Speak another language Native:
68.2% (1,370)Foreign-born:
85.1% (706)
White alone - Speak only English Native:
98.2% (7,673)Foreign-born:
68.3% (196)
White alone - Speak another language Native:
1.8% (141)Foreign-born:
32.8% (94)
Hispanic or Latino - Speak only English Native:
28.3% (924)Foreign-born:
4.5% (65)
Hispanic or Latino - Speak another language Native:
71.5% (2,334)Foreign-born:
95.3% (1,383)
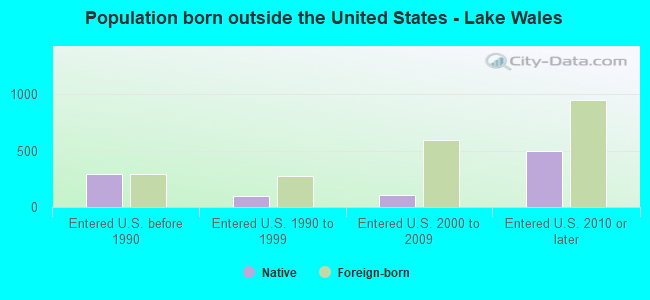
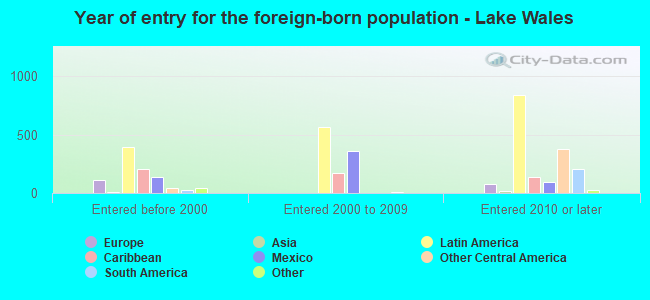
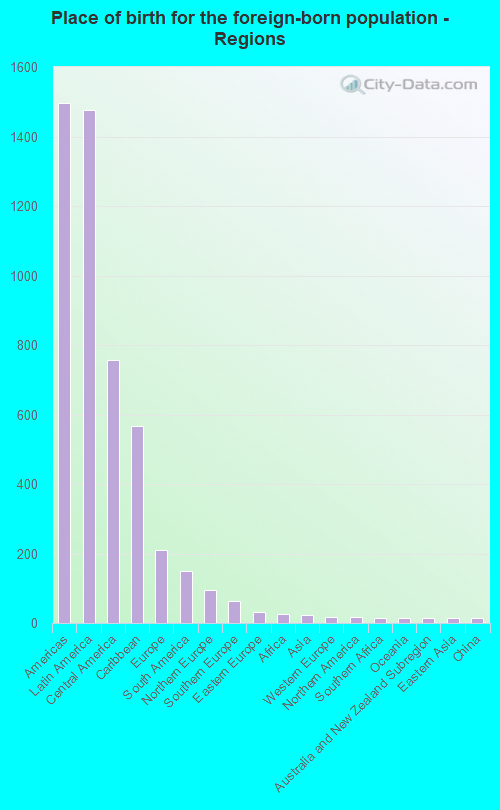
Foreign-born residents in Lake Wales 1,770 residents are foreign born (8.5% Latin America , 1.2% Europe ).
This city:
10.1%Florida:
21.1%
Marital status for residents in Lake Wales Marital status - White (Caucasian) population 15 years and over
Males 28.4% Never married53.2% Now married1.0% Separated4.0% Widowed13.4% DivorcedFemales 18.4% Never married51.9% Now married2.1% Separated11.3% Widowed16.3% DivorcedWomen who gave birth in the past 12 months Now married:
81.3% (87)Unmarried:
18.7% (20)
Women who did not give birth in the past 12 months Now married:
42.9% (543)Unmarried:
57.1% (724)
Marital status - Black or African American population 15 years and over
Males 40.0% Never married44.1% Now married2.6% Separated1.1% Widowed12.2% DivorcedFemales 49.9% Never married23.5% Now married6.8% Separated5.5% Widowed14.3% DivorcedWomen who gave birth in the past 12 months Now married:
78.0% (43)Unmarried:
22.0% (12)
Women who did not give birth in the past 12 months Now married:
26.2% (277)Unmarried:
73.8% (780)
Marital status - American Indian / Alaska Native population 15 years and over
Males 0.0% Never married100.0% Now married0.0% Separated0.0% Widowed0.0% DivorcedFemales 0.0% Never married57.9% Now married0.0% Separated15.8% Widowed26.3% DivorcedWomen who gave birth in the past 12 months Now married:
100.0% (23)Unmarried:
0.0% (0)
Women who did not give birth in the past 12 months Now married:
0.0% (0)Unmarried:
100.0% (16)
Marital status - Asian population 15 years and over
Males 0.0% Never married100.0% Now married0.0% Separated0.0% Widowed0.0% DivorcedFemales 0.0% Never married100.0% Now married0.0% Separated0.0% Widowed0.0% DivorcedMarital status - Other race population 15 years and over
Males 31.1% Never married58.4% Now married5.0% Separated0.0% Widowed5.6% DivorcedFemales 29.2% Never married55.5% Now married11.6% Separated2.6% Widowed1.1% DivorcedWomen who gave birth in the past 12 months Now married:
0.0% (0)Unmarried:
100.0% (12)
Women who did not give birth in the past 12 months Now married:
60.9% (305)Unmarried:
39.1% (195)
Marital status - Two or more races population 15 years and over
Males 47.2% Never married46.3% Now married0.3% Separated0.0% Widowed6.1% DivorcedFemales 38.3% Never married30.1% Now married0.0% Separated15.4% Widowed16.2% DivorcedWomen who did not give birth in the past 12 months Now married:
28.0% (165)Unmarried:
72.0% (424)
Marital status - White alone, not Hispanic / Latino population 15 years and over
Males 27.4% Never married52.5% Now married1.1% Separated4.6% Widowed14.4% DivorcedFemales 18.7% Never married49.2% Now married2.1% Separated12.9% Widowed17.1% DivorcedWomen who gave birth in the past 12 months Now married:
46.5% (20)Unmarried:
53.5% (23)
Women who did not give birth in the past 12 months Now married:
37.9% (449)Unmarried:
62.1% (735)
Marital status - Hispanic or Latino population 15 years and over
Males 39.7% Never married51.8% Now married1.8% Separated0.0% Widowed6.7% DivorcedFemales 27.9% Never married50.3% Now married4.0% Separated8.2% Widowed9.6% DivorcedWomen who gave birth in the past 12 months Now married:
92.0% (95)Unmarried:
8.0% (8)
Women who did not give birth in the past 12 months Now married:
49.5% (494)Unmarried:
50.5% (504)
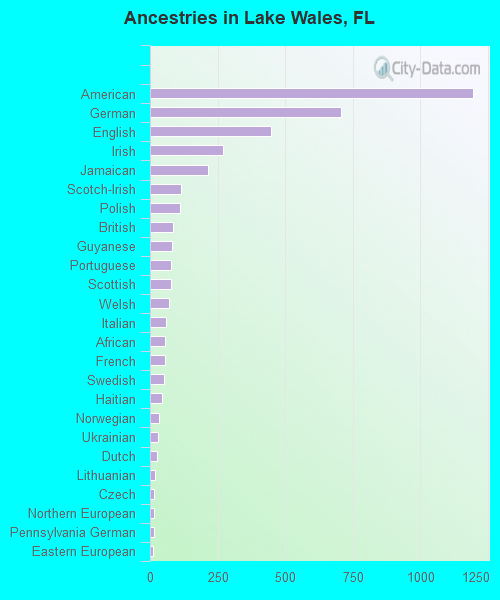
Ancestries in Lake Wales
1,194 12.6% American706 7.5% German447 4.7% English271 2.9% Irish213 2.2% Jamaican114 1.2% Scotch-Irish111 1.2% Polish85 0.9% British82 0.9% Guyanese77 0.8% Portuguese77 0.8% Scottish69 0.7% Welsh58 0.6% Italian55 0.6% African54 0.6% French51 0.5% Swedish45 0.5% Haitian33 0.3% Norwegian29 0.3% Ukrainian27 0.3% Dutch17 0.2% Lithuanian16 0.2% Czech15 0.2% Northern European14 0.1% Pennsylvania German12 0.1% Eastern European11 0.1% Romanian10 0.1% Danish10 0.1% Bahamian9 0.10% Croatian9 0.10% Iranian8 0.08% European6 0.06% Hungarian
Geographical mobility in Lake Wales Same house 1 year ago 7,641 87.2% White (Caucasian)3,107 92.7% Black or African American93 100.0% American Indian / Alaska Native15 100.0% Asian9 100.0% Native Hawaiian / Pacific Islander2,015 96.5% Other race3,141 90.5% Two or more races7,447 90.9% White alone, not Hispanic / Latino4,431 84.4% Hispanic or LatinoMoved within same county 675 7.7% White / Caucasian117 3.5% Black or African American68 3.2% Other race128 3.7% Two or more races399 4.9% White alone, not Hispanic / Latino471 9.0% Hispanic or LatinoMoved within same state 120 1.4% White / Caucasian55 1.6% Black or African American103 3.0% Two or more races107 1.3% White alone, not Hispanic / Latino92 1.7% Hispanic or LatinoMoved from different state 278 3.2% White / Caucasian39 1.2% Black or African American51 1.5% Two or more races225 2.7% White alone, not Hispanic / Latino183 3.5% Hispanic or LatinoMoved from abroad 65 0.7% White10 0.3% Black or African American51 0.6% White alone, not Hispanic / Latino44 0.8% Hispanic or Latino
Children Nativity (place of birth) in Lake Wales
Children under 6 years - Living with two parents Both parents native 298 100.0% NativeBoth parents foreign-born 123 100.0% NativeOne native, one foreign-born parent 6 100.0% NativeChildren under 6 years - Living with one parent Native parent 486 100.0% NativeForeign-born parent 61 100.0% NativeChildren 6 to 17 years - Living with two parents Both parents native 1,028 99.8% Native2 0.2% Foreign-bornBoth parents foreign-born 269 66.2% Native138 33.8% Foreign-bornOne native, one foreign-born parent 128 92.2% Native11 7.8% Foreign-bornChildren 6 to 17 years - Living with one parent Native parent 650 97.4% Native17 2.6% Foreign-bornForeign-born parent 33 100.0% Native
Grandparents responsible for own grandchildren in Lake Wales
Grandparents (30 to 59 years) White / Caucasian 30 100.0% Not responsible for grandchildrenBlack or African American 71 79.7% Responsible for grandchildren18 20.3% Not responsible for grandchildrenOther race 27 100.0% Responsible for grandchildrenWhite alone, not Hispanic / Latino 30 100.0% Not responsible for grandchildrenHispanic or Latino 12 32.6% Responsible for grandchildren24 67.4% Not responsible for grandchildrenGrandparents (60 years and over) White / Caucasian 61 52.2% Responsible for grandchildren56 47.8% Not responsible for grandchildrenBlack or African American 69 100.0% Not responsible for grandchildrenOther race 13 42.6% Responsible for grandchildren18 57.4% Not responsible for grandchildrenWhite alone, not Hispanic / Latino 23 28.1% Responsible for grandchildren58 71.9% Not responsible for grandchildrenHispanic or Latino 80 75.3% Responsible for grandchildren26 24.7% Not responsible for grandchildren