Races in Lake Wylie, South Carolina (SC) Detailed Stats
Data:
Races - White alone (%)
Races - White alone (% change since 2000)
Races - Black alone (%)
Races - Black alone (% change since 2000)
Races - American Indian alone (%)
Races - American Indian alone (% change since 2000)
Races - Asian alone (%)
Races - Asian alone (% change since 2000)
Races - Hispanic (%)
Races - Hispanic (% change since 2000)
Races - Native Hawaiian and Other Pacific Islander alone (%)
Races - Native Hawaiian and Other Pacific Islander alone (% change since 2000)
Races - Two or more races(%)
Races - Two or more races(% change since 2000)
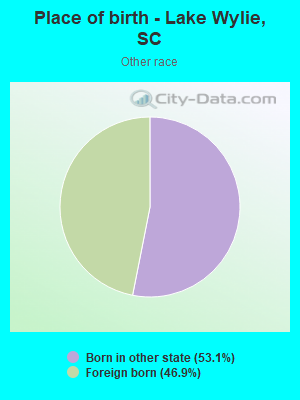
Races - Other race alone (%)
Races - Other race alone (% change since 2000)
Racial diversity
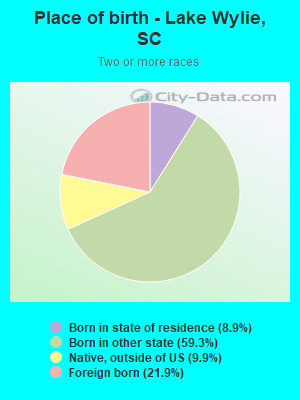
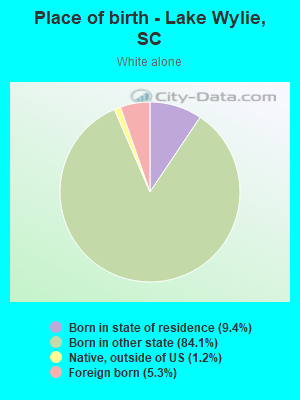
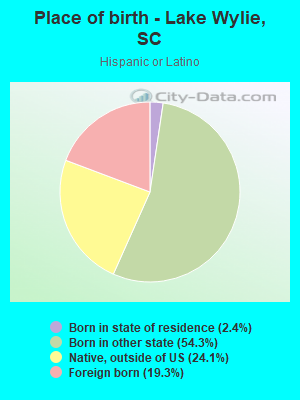
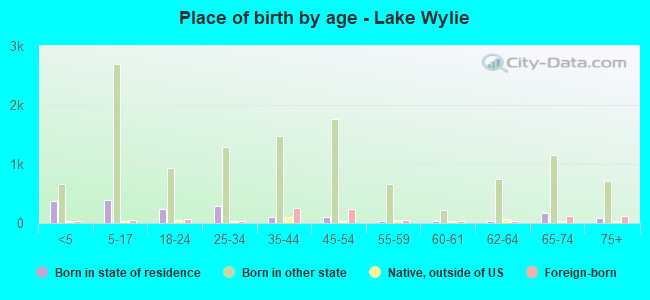
Place of birth - Born in state of residence (%)
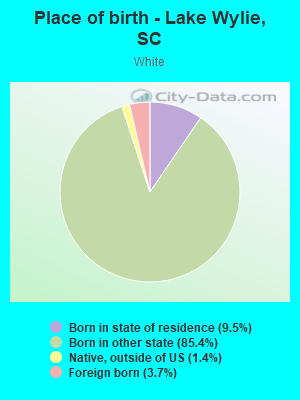
Place of birth - Born in state of residence (%) - White
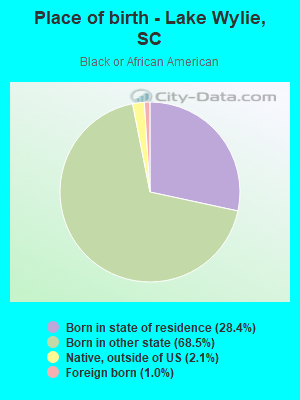
Place of birth - Born in state of residence (%) - Black or African American
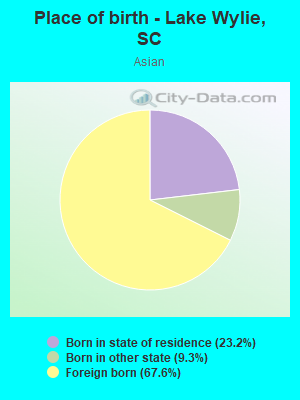
Place of birth - Born in state of residence (%) - Asian
Place of birth - Born in state of residence (%) - Hispanic or Latino
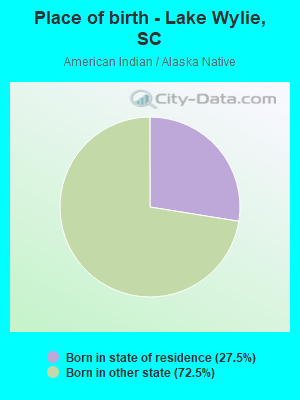
Place of birth - Born in state of residence (%) - American Indian and Alaska Native
Place of birth - Born in state of residence (%) - Multirace
Place of birth - Born in state of residence (%) - Other Race
Place of birth - Born in other state (%)
Place of birth - Born in other state (%) - White
Place of birth - Born in other state (%) - Black or African American
Place of birth - Born in other state (%) - Asian
Place of birth - Born in other state (%) - Hispanic or Latino
Place of birth - Born in other state (%) - American Indian and Alaska Native
Place of birth - Born in other state (%) - Multirace
Place of birth - Born in other state (%) - Other Race
Place of birth - Native, outside of US (%)
Place of birth - Native, outside of US (%) - White
Place of birth - Native, outside of US (%) - Black or African American
Place of birth - Native, outside of US (%) - Asian
Place of birth - Native, outside of US (%) - Hispanic or Latino
Place of birth - Native, outside of US (%) - American Indian and Alaska Native
Place of birth - Native, outside of US (%) - Multirace
Place of birth - Native, outside of US (%) - Other Race
Place of birth - Foreign born (%)
Place of birth - Foreign born (%) - White
Place of birth - Foreign born (%) - Black or African American
Place of birth - Foreign born (%) - Asian
Place of birth - Foreign born (%) - Hispanic or Latino
Place of birth - Foreign born (%) - American Indian and Alaska Native
Place of birth - Foreign born (%) - Multirace
Place of birth - Foreign born (%) - Other Race
Residents speaking English at home (%)
Residents speaking English at home - Born in the United States (%)
Residents speaking English at home - Native, born elsewhere (%)
Residents speaking English at home - Foreign born (%)
Residents speaking Spanish at home (%)
Residents speaking Spanish at home - Born in the United States (%)
Residents speaking Spanish at home - Native, born elsewhere (%)
Residents speaking Spanish at home - Foreign born (%)
Residents speaking other language at home (%)
Residents speaking other language at home - Born in the United States (%)
Residents speaking other language at home - Native, born elsewhere (%)
Residents speaking other language at home - Foreign born (%)
Marital status - Never married (%)
Marital status - Now married (%)
Marital status - Separated (%)
Marital status - Widowed (%)
Marital status - Divorced (%)
Ancestries Reported - Arab (%)
Ancestries Reported - Czech (%)
Ancestries Reported - Danish (%)
Ancestries Reported - Dutch (%)
Ancestries Reported - English (%)
Ancestries Reported - French (%)
Ancestries Reported - French Canadian (%)
Ancestries Reported - German (%)
Ancestries Reported - Greek (%)
Ancestries Reported - Hungarian (%)
Ancestries Reported - Irish (%)
Ancestries Reported - Italian (%)
Ancestries Reported - Lithuanian (%)
Ancestries Reported - Norwegian (%)
Ancestries Reported - Polish (%)
Ancestries Reported - Portuguese (%)
Ancestries Reported - Russian (%)
Ancestries Reported - Scotch-Irish (%)
Ancestries Reported - Scottish (%)
Ancestries Reported - Slovak (%)
Ancestries Reported - Subsaharan African (%)
Ancestries Reported - Swedish (%)
Ancestries Reported - Swiss (%)
Ancestries Reported - Ukrainian (%)
Ancestries Reported - United States (%)
Ancestries Reported - Welsh (%)
Ancestries Reported - West Indian (%)
Ancestries Reported - Other (%)
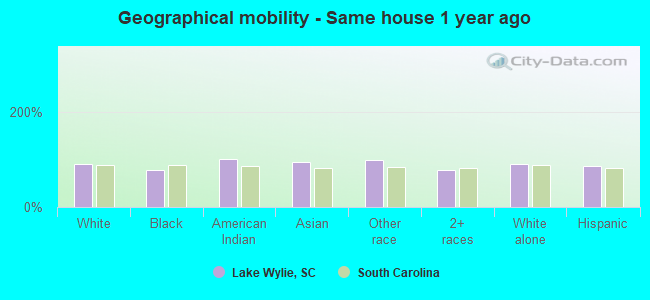
Geographical mobility - Same house 1 year ago (%)
Geographical mobility - Same house 1 year ago (%) - White
Geographical mobility - Same house 1 year ago (%) - Black or African American
Geographical mobility - Same house 1 year ago (%) - Asian
Geographical mobility - Same house 1 year ago (%) - Hispanic or Latino
Geographical mobility - Same house 1 year ago (%) - American Indian and Alaska Native
Geographical mobility - Same house 1 year ago (%) - Multirace
Geographical mobility - Same house 1 year ago (%) - Other Race
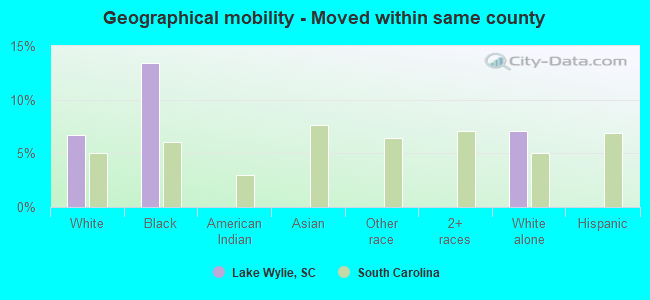
Geographical mobility - Moved within same county (%)
Geographical mobility - Moved within same county (%) - White
Geographical mobility - Moved within same county (%) - Black or African American
Geographical mobility - Moved within same county (%) - Asian
Geographical mobility - Moved within same county (%) - Hispanic or Latino
Geographical mobility - Moved within same county (%) - American Indian and Alaska Native
Geographical mobility - Moved within same county (%) - Multirace
Geographical mobility - Moved within same county (%) - Other Race
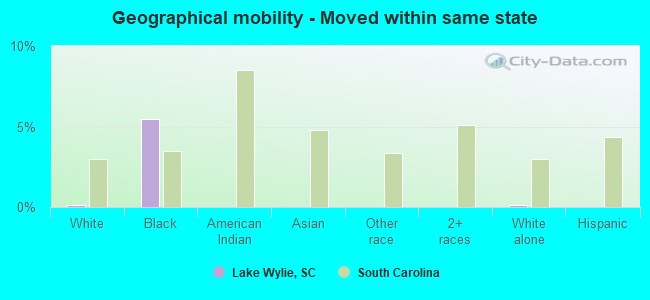
Geographical mobility - Moved from different county within same state (%)
Geographical mobility - Moved from different county within same state (%) - White
Geographical mobility - Moved from different county within same state (%) - Black or African American
Geographical mobility - Moved from different county within same state (%) - Asian
Geographical mobility - Moved from different county within same state (%) - Hispanic or Latino
Geographical mobility - Moved from different county within same state (%) - American Indian and Alaska Native
Geographical mobility - Moved from different county within same state (%) - Multirace
Geographical mobility - Moved from different county within same state (%) - Other Race
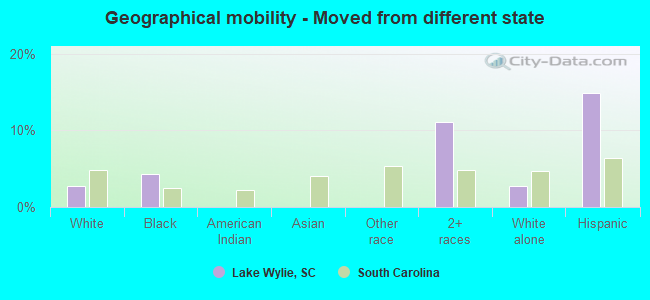
Geographical mobility - Moved from different state (%)
Geographical mobility - Moved from different state (%) - White
Geographical mobility - Moved from different state (%) - Black or African American
Geographical mobility - Moved from different state (%) - Asian
Geographical mobility - Moved from different state (%) - Hispanic or Latino
Geographical mobility - Moved from different state (%) - American Indian and Alaska Native
Geographical mobility - Moved from different state (%) - Multirace
Geographical mobility - Moved from different state (%) - Other Race
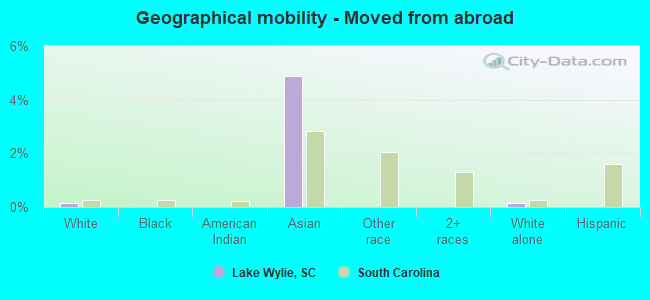
Geographical mobility - Moved from abroad (%)
Geographical mobility - Moved from abroad (%) - White
Geographical mobility - Moved from abroad (%) - Black or African American
Geographical mobility - Moved from abroad (%) - Asian
Geographical mobility - Moved from abroad (%) - Hispanic or Latino
Geographical mobility - Moved from abroad (%) - American Indian and Alaska Native
Geographical mobility - Moved from abroad (%) - Multirace
Geographical mobility - Moved from abroad (%) - Other Race
Place of birth for the foreign-born population - Ireland (%)
Place of birth for the foreign-born population - Denmark (%)
Place of birth for the foreign-born population - Norway (%)
Place of birth for the foreign-born population - Sweden (%)
Place of birth for the foreign-born population - United Kingdom (%)
Place of birth for the foreign-born population - England (%)
Place of birth for the foreign-born population - Scotland (%)
Place of birth for the foreign-born population - Other Northern Europe (%)
Place of birth for the foreign-born population - Austria (%)
Place of birth for the foreign-born population - Belgium (%)
Place of birth for the foreign-born population - France (%)
Place of birth for the foreign-born population - Germany (%)
Place of birth for the foreign-born population - Netherlands (%)
Place of birth for the foreign-born population - Switzerland (%)
Place of birth for the foreign-born population - Other Western Europe (%)
Place of birth for the foreign-born population - Greece (%)
Place of birth for the foreign-born population - Italy (%)
Place of birth for the foreign-born population - Portugal (%)
Place of birth for the foreign-born population - Spain (%)
Place of birth for the foreign-born population - Other Southern Europe (%)
Place of birth for the foreign-born population - Albania (%)
Place of birth for the foreign-born population - Belarus (%)
Place of birth for the foreign-born population - Bosnia and Herzegovina (%)
Place of birth for the foreign-born population - Bulgaria (%)
Place of birth for the foreign-born population - Croatia (%)
Place of birth for the foreign-born population - Czechoslovakia (%)
Place of birth for the foreign-born population - Hungary (%)
Place of birth for the foreign-born population - Latvia (%)
Place of birth for the foreign-born population - Lithuania (%)
Place of birth for the foreign-born population - North Macedonia (Macedonia) (%)
Place of birth for the foreign-born population - Moldova (%)
Place of birth for the foreign-born population - Poland (%)
Place of birth for the foreign-born population - Romania (%)
Place of birth for the foreign-born population - Russia (%)
Place of birth for the foreign-born population - Serbia (%)
Place of birth for the foreign-born population - Ukraine (%)
Place of birth for the foreign-born population - Other Eastern Europe (%)
Place of birth for the foreign-born population - China (%)
Place of birth for the foreign-born population - Hong Kong (%)
Place of birth for the foreign-born population - Taiwan (%)
Place of birth for the foreign-born population - Japan (%)
Place of birth for the foreign-born population - Korea (%)
Place of birth for the foreign-born population - Other Eastern Asia (%)
Place of birth for the foreign-born population - Afghanistan (%)
Place of birth for the foreign-born population - Bangladesh (%)
Place of birth for the foreign-born population - India (%)
Place of birth for the foreign-born population - Iran (%)
Place of birth for the foreign-born population - Kazakhstan (%)
Place of birth for the foreign-born population - Nepal (%)
Place of birth for the foreign-born population - Pakistan (%)
Place of birth for the foreign-born population - Sri Lanka (%)
Place of birth for the foreign-born population - Uzbekistan (%)
Place of birth for the foreign-born population - Other South Central Asia (%)
Place of birth for the foreign-born population - Burma (%)
Place of birth for the foreign-born population - Cambodia (%)
Place of birth for the foreign-born population - Indonesia (%)
Place of birth for the foreign-born population - Laos (%)
Place of birth for the foreign-born population - Malaysia (%)
Place of birth for the foreign-born population - Philippines (%)
Place of birth for the foreign-born population - Singapore (%)
Place of birth for the foreign-born population - Thailand (%)
Place of birth for the foreign-born population - Vietnam (%)
Place of birth for the foreign-born population - Other South Eastern Asia (%)
Place of birth for the foreign-born population - Armenia (%)
Place of birth for the foreign-born population - Iraq (%)
Place of birth for the foreign-born population - Israel (%)
Place of birth for the foreign-born population - Jordan (%)
Place of birth for the foreign-born population - Kuwait (%)
Place of birth for the foreign-born population - Lebanon (%)
Place of birth for the foreign-born population - Saudi Arabia (%)
Place of birth for the foreign-born population - Syria (%)
Place of birth for the foreign-born population - Turkey (%)
Place of birth for the foreign-born population - Yemen (%)
Place of birth for the foreign-born population - Other Western Asia (%)
Place of birth for the foreign-born population - Eritrea (%)
Place of birth for the foreign-born population - Ethiopia (%)
Place of birth for the foreign-born population - Kenya (%)
Place of birth for the foreign-born population - Somalia (%)
Place of birth for the foreign-born population - Uganda (%)
Place of birth for the foreign-born population - Zimbabwe (%)
Place of birth for the foreign-born population - Other Eastern Africa (%)
Place of birth for the foreign-born population - Cameroon (%)
Place of birth for the foreign-born population - Congo (%)
Place of birth for the foreign-born population - Democratic Republic of Congo (Zaire) (%)
Place of birth for the foreign-born population - Other Middle Africa (%)
Place of birth for the foreign-born population - Egypt (%)
Place of birth for the foreign-born population - Morocco (%)
Place of birth for the foreign-born population - Sudan (%)
Place of birth for the foreign-born population - Other Northern Africa (%)
Place of birth for the foreign-born population - South Africa (%)
Place of birth for the foreign-born population - Other Southern Africa (%)
Place of birth for the foreign-born population - Cabo Verde (%)
Place of birth for the foreign-born population - Ghana (%)
Place of birth for the foreign-born population - Liberia (%)
Place of birth for the foreign-born population - Nigeria (%)
Place of birth for the foreign-born population - Senegal (%)
Place of birth for the foreign-born population - Sierra Leone (%)
Place of birth for the foreign-born population - Other Western Africa (%)
Place of birth for the foreign-born population - Australia (%)
Place of birth for the foreign-born population - New Zealand (%)
Place of birth for the foreign-born population - Fiji (%)
Place of birth for the foreign-born population - Micronesia (%)
Place of birth for the foreign-born population - Bahamas (%)
Place of birth for the foreign-born population - Barbados (%)
Place of birth for the foreign-born population - Cuba (%)
Place of birth for the foreign-born population - Dominica (%)
Place of birth for the foreign-born population - Dominican Republic (%)
Place of birth for the foreign-born population - Grenada (%)
Place of birth for the foreign-born population - Haiti (%)
Place of birth for the foreign-born population - Jamaica (%)
Place of birth for the foreign-born population - St. Vincent and the Grenadines (%)
Place of birth for the foreign-born population - Trinidad and Tobago (%)
Place of birth for the foreign-born population - West Indies (%)
Place of birth for the foreign-born population - Other Caribbean (%)
Place of birth for the foreign-born population - Belize (%)
Place of birth for the foreign-born population - Costa Rica (%)
Place of birth for the foreign-born population - El Salvador (%)
Place of birth for the foreign-born population - Guatemala (%)
Place of birth for the foreign-born population - Honduras (%)
Place of birth for the foreign-born population - Mexico (%)
Place of birth for the foreign-born population - Nicaragua (%)
Place of birth for the foreign-born population - Panama (%)
Place of birth for the foreign-born population - Other Central America (%)
Place of birth for the foreign-born population - Argentina (%)
Place of birth for the foreign-born population - Bolivia (%)
Place of birth for the foreign-born population - Brazil (%)
Place of birth for the foreign-born population - Chile (%)
Place of birth for the foreign-born population - Colombia (%)
Place of birth for the foreign-born population - Ecuador (%)
Place of birth for the foreign-born population - Guyana (%)
Place of birth for the foreign-born population - Peru (%)
Place of birth for the foreign-born population - Uruguay (%)
Place of birth for the foreign-born population - Venezuela (%)
Place of birth for the foreign-born population - Other South America (%)
Place of birth for the foreign-born population - Canada (%)
Place of birth for the foreign-born population - Other Northern America (%)
Place of birth for the foreign-born population - Other (%)
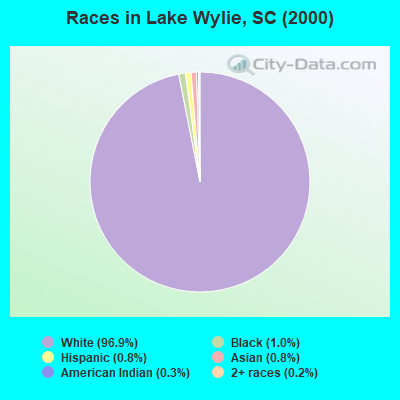
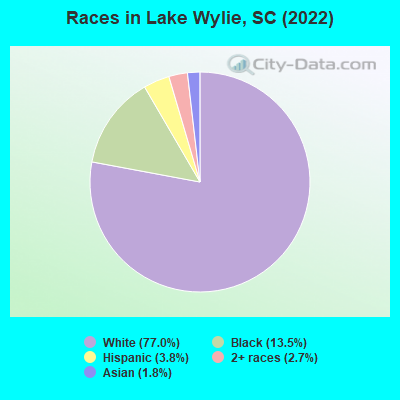
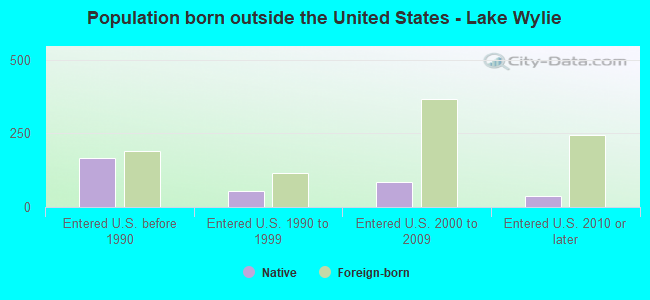
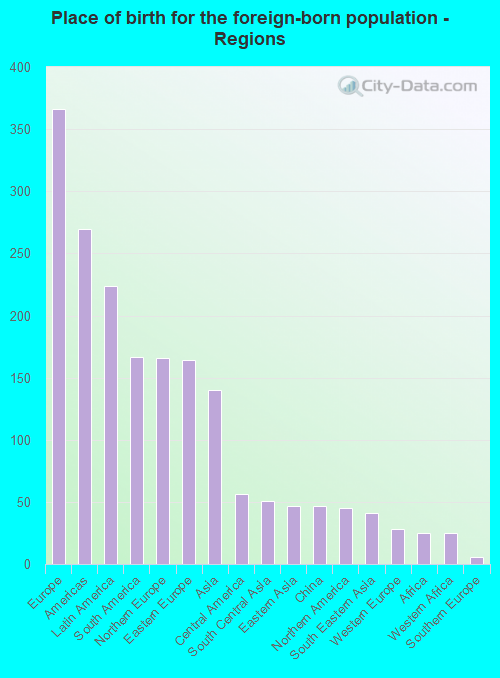
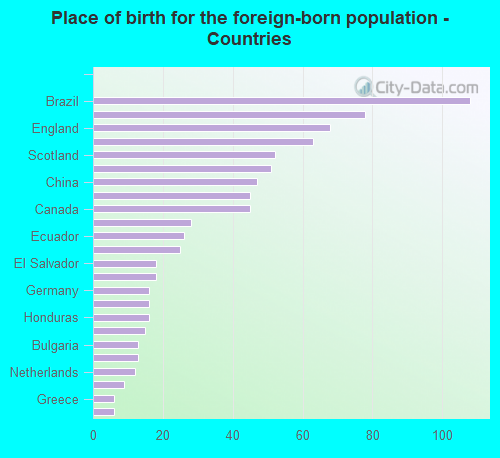
According to 2022 data, the most numerous races in Lake Wylie, SC are White alone (11,514 residents), Black alone (2,019 residents), and Hispanic (575 residents). 92.3% of Lake Wylie residents speak English at home. 5.4% of Lake Wylie, SC residents are foreign-born (2.5% born in Europe, 1.5% born in Latin America, 1.0% born in Asia), which is 6.8% greater than the foreign-born rate of 5.0% across the entire state of South Carolina.
Race distribution in Lake Wylie
2000 2022
2,652,291 66.1% White alone 1,178,486 29.4% Black alone 95,076 2.4% Hispanic 35,568 0.9% Asian alone 33,290 0.8% Two or more races 12,765 0.3% American Indian alone 3,266 0.08% Other race alone 1,270 0.03% Native Hawaiian and Other
3,301,739 62.5% White alone 1,313,290 24.9% Black alone 343,783 6.5% Hispanic 190,508 3.6% Two or more races 89,888 1.7% Asian alone 29,390 0.6% Other race alone 12,112 0.2% American Indian alone 1,924 0.04% Native Hawaiian and Other
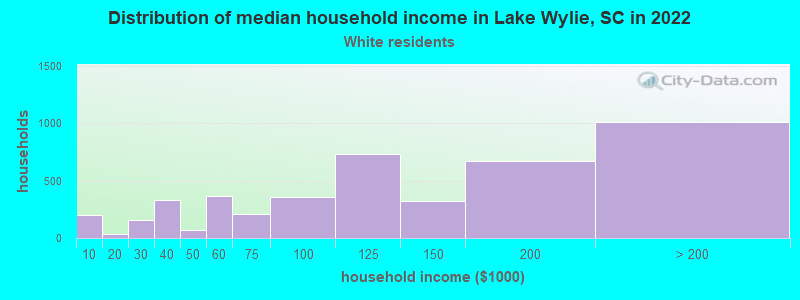
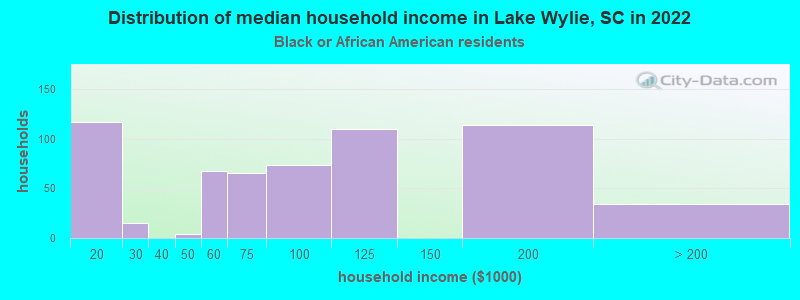
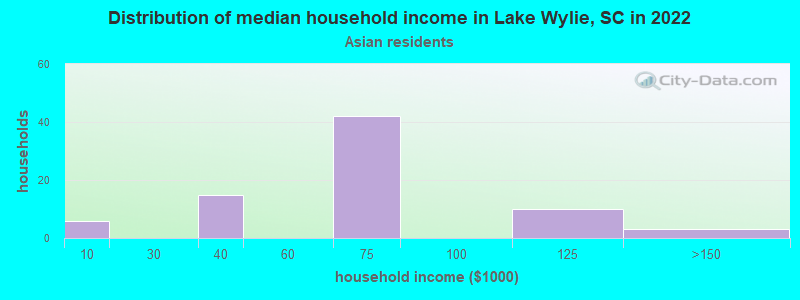
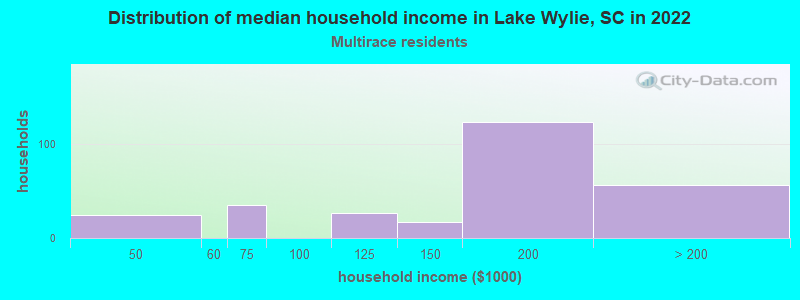
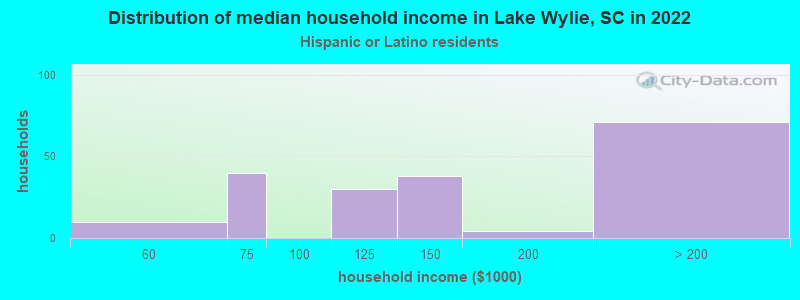
Income and house value in Lake Wylie Median household income in 2022 $116,102 White non-Hispanic householders$87,001 Black householders$68,525 Asian householders$149,438 Two or more races householders$143,513 Hispanic or Latino race householdersMedian 2022 house value $563,689 White Non-Hispanic householders$363,923 Black or African American householders
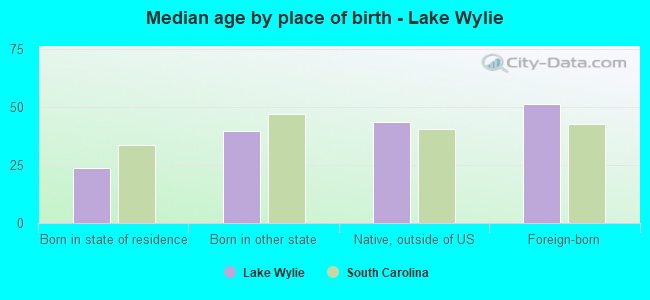
Median age by race in Lake Wylie
41.9 Median age for White residents41.0 42.5 24.0 Median age for Black or African American residents22.0 27.2 18.2 Median age for American Indian / Alaska Native residents-833,333,332.5 15.5 42.4 Median age for Asian residents24.3 49.9 -698,412,697.7 Median age for Native Hawaiian / Pacific Islander residents-666,666,666.0 -1,016,109,044.8 50.3 Median age for Other race residents-734,751,772.3 56.4 35.7 Median age for Two or more races residents30.6 38.0 42.0 Median age for White alone residents40.9 42.3 34.4 Median age for Hispanic or Latino residents31.3 39.7
Owner/renter occupied households by race in Lake Wylie
House owners and renters - White residents 3,549 80.3% Owner occupied873 19.7% Renter occupiedHouse owners and renters - Black or African American residents 340 57.2% Owner occupied255 42.8% Renter occupiedHouse owners and renters - American Indian / Alaska Native residents 23 100.0% Owner occupiedHouse owners and renters - Asian residents 89 93.1% Owner occupied7 6.9% Renter occupiedHouse owners and renters - Two or more races residents 291 100.0% Owner occupiedHouse owners and renters - White alone residents 3,529 80.0% Owner occupied883 20.0% Renter occupiedHouse owners and renters - Hispanic or Latino residents 143 87.5% Owner occupied21 12.5% Renter occupied
Language usage in Lake Wylie
English speakers - Total 92.3% of residents of Lake Wylie speak English at home.
2.9% of residents speak Spanish at home 293 72.3% Speak English very well112 27.7% Speak English less than very well5.1% of residents speak other language at home 412 58.2% Speak English very well296 41.8% Speak English less than very well
English speakers - Born in the United States 98.0% of residents of Lake Wylie speak English at home.
1.8% of residents speak Spanish at home 173 84.4% Speak English very well32 15.6% Speak English less than very well0.6% of residents speak other language at home 33 45.8% Speak English very well39 54.2% Speak English less than very well
English speakers - Native, born elsewhere 61.1% of residents of Lake Wylie speak English at home.
26.3% of residents speak Spanish at home 51 53.1% Speak English very well45 46.9% Speak English less than very well
English speakers - Foreign-born 28.1% of residents of Lake Wylie speak English at home.
12.9% of residents speak Spanish at home 59 50.0% Speak English very well59 50.0% Speak English less than very well61.5% of residents speak other language at home 326 57.8% Speak English very well238 42.2% Speak English less than very well
White (Caucasian) - Speak only English Native:
98.4% (10,247)Foreign-born:
57.8% (253)
White (Caucasian) - Speak another language Native:
1.6% (165)Foreign-born:
43.1% (188)
Black or African American - Speak another language Native:
2.0% (31)Foreign-born:
100.0% (25)
Asian - Speak only English Native:
34.6% (29)Foreign-born:
8.1% (15)
Asian - Speak another language Native:
69.1% (57)Foreign-born:
95.6% (177)
Other race - Speak another language Native:
81.8% (33)Foreign-born:
95.7% (34)
Two or more races - Speak another language Native:
16.2% (75)Foreign-born:
100.0% (159)
White alone - Speak only English Native:
99.0% (10,234)Foreign-born:
41.4% (265)
White alone - Speak another language Native:
1.0% (100)Foreign-born:
50.6% (323)
Hispanic or Latino - Speak another language Native:
53.2% (225)Foreign-born:
94.5% (117)
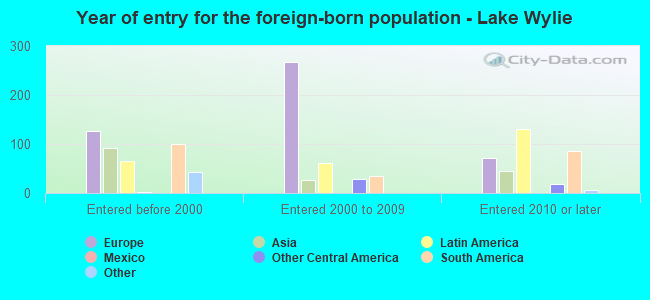
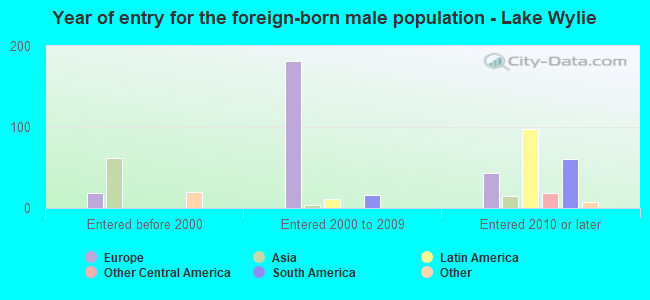
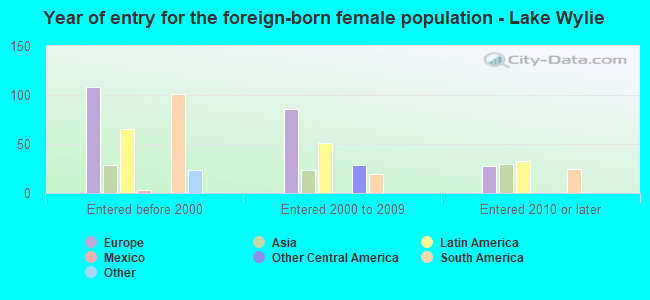
Foreign-born residents in Lake Wylie 802 residents are foreign born (2.5% Europe , 1.5% Latin America , 1.0% Asia ).
This city:
5.4%South Carolina:
5.3%
Marital status for residents in Lake Wylie Marital status - White (Caucasian) population 15 years and over
Males 24.7% Never married60.5% Now married1.0% Separated1.5% Widowed12.2% DivorcedFemales 21.7% Never married58.2% Now married1.2% Separated10.8% Widowed8.1% DivorcedWomen who gave birth in the past 12 months Now married:
100.0% (75)Unmarried:
0.0% (0)
Women who did not give birth in the past 12 months Now married:
52.5% (1,088)Unmarried:
47.5% (986)
Marital status - Black or African American population 15 years and over
Males 40.6% Never married59.4% Now married0.0% Separated0.0% Widowed0.0% DivorcedFemales 33.5% Never married47.7% Now married2.3% Separated5.6% Widowed10.9% DivorcedWomen who gave birth in the past 12 months Now married:
72.2% (57)Unmarried:
27.8% (22)
Women who did not give birth in the past 12 months Now married:
54.3% (236)Unmarried:
45.8% (199)
Marital status - American Indian / Alaska Native population 15 years and over
Males 0.0% Never married100.0% Now married0.0% Separated0.0% Widowed0.0% DivorcedFemales 100.0% Never married0.0% Now married0.0% Separated0.0% Widowed0.0% DivorcedWomen who did not give birth in the past 12 months Now married:
0.0% (0)Unmarried:
100.0% (22)
Marital status - Asian population 15 years and over
Males 55.9% Never married22.4% Now married21.7% Separated0.0% Widowed0.0% DivorcedFemales 0.0% Never married82.9% Now married0.0% Separated0.0% Widowed17.1% DivorcedWomen who did not give birth in the past 12 months Now married:
78.3% (52)Unmarried:
21.7% (14)
Marital status - Two or more races population 15 years and over
Males 33.8% Never married66.2% Now married0.0% Separated0.0% Widowed0.0% DivorcedFemales 33.5% Never married66.5% Now married0.0% Separated0.0% Widowed0.0% DivorcedWomen who gave birth in the past 12 months Now married:
100.0% (17)Unmarried:
0.0% (0)
Women who did not give birth in the past 12 months Now married:
58.4% (142)Unmarried:
41.6% (102)
Marital status - White alone, not Hispanic / Latino population 15 years and over
Males 24.6% Never married60.4% Now married1.0% Separated1.6% Widowed12.4% DivorcedFemales 21.8% Never married58.0% Now married1.2% Separated11.2% Widowed7.8% DivorcedWomen who gave birth in the past 12 months Now married:
100.0% (77)Unmarried:
0.0% (0)
Women who did not give birth in the past 12 months Now married:
51.3% (1,040)Unmarried:
48.7% (987)
Marital status - Hispanic or Latino population 15 years and over
Males 34.2% Never married65.8% Now married0.0% Separated0.0% Widowed0.0% DivorcedFemales 17.9% Never married71.0% Now married0.0% Separated0.0% Widowed11.2% DivorcedWomen who gave birth in the past 12 months Now married:
100.0% (19)Unmarried:
0.0% (0)
Women who did not give birth in the past 12 months Now married:
73.2% (136)Unmarried:
26.8% (50)
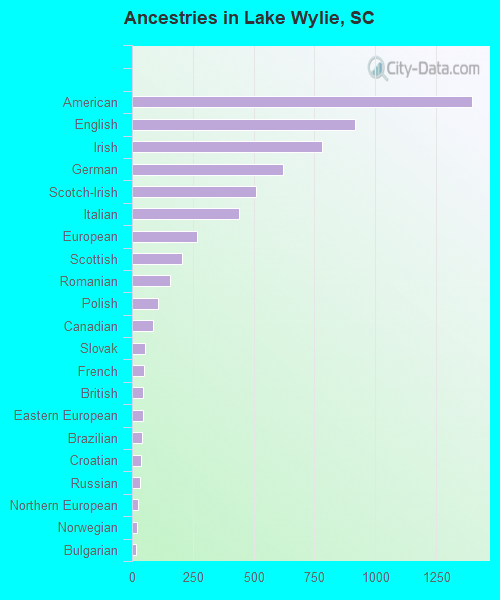
Ancestries in Lake Wylie
1,398 17.3% American916 11.3% English783 9.7% Irish622 7.7% German509 6.3% Scotch-Irish439 5.4% Italian267 3.3% European207 2.6% Scottish157 1.9% Romanian108 1.3% Polish88 1.1% Canadian55 0.7% Slovak51 0.6% French45 0.6% British44 0.5% Eastern European41 0.5% Brazilian37 0.5% Croatian32 0.4% Russian23 0.3% Northern European20 0.2% Norwegian17 0.2% Bulgarian6 0.07% Austrian5 0.06% Greek
Children Nativity (place of birth) in Lake Wylie
Children under 6 years - Living with two parents Both parents native 821 100.0% NativeBoth parents foreign-born 73 100.0% NativeChildren under 6 years - Living with one parent Native parent 289 100.0% NativeChildren 6 to 17 years - Living with two parents Both parents native 2,177 100.0% NativeBoth parents foreign-born 23 28.5% Native58 71.5% Foreign-bornOne native, one foreign-born parent 286 100.0% NativeChildren 6 to 17 years - Living with one parent Native parent 436 100.0% Native
Grandparents responsible for own grandchildren in Lake Wylie
Grandparents (30 to 59 years) White / Caucasian 21 100.0% Responsible for grandchildrenBlack or African American 5 100.0% Not responsible for grandchildrenWhite alone, not Hispanic / Latino 21 100.0% Responsible for grandchildren
Grandparents (60 years and over) White / Caucasian 31 100.0% Not responsible for grandchildrenBlack or African American 37 100.0% Not responsible for grandchildrenWhite alone, not Hispanic / Latino 32 100.0% Not responsible for grandchildren