Races in Lake in the Hills, Illinois (IL) Detailed Stats
Data:
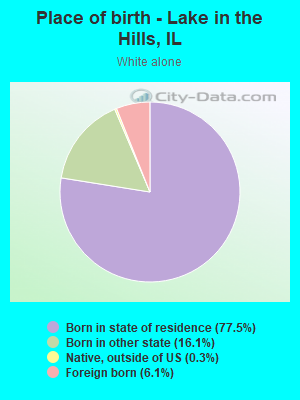
Races - White alone (%)
Races - White alone (% change since 2000)
Races - Black alone (%)
Races - Black alone (% change since 2000)
Races - American Indian alone (%)
Races - American Indian alone (% change since 2000)
Races - Asian alone (%)
Races - Asian alone (% change since 2000)
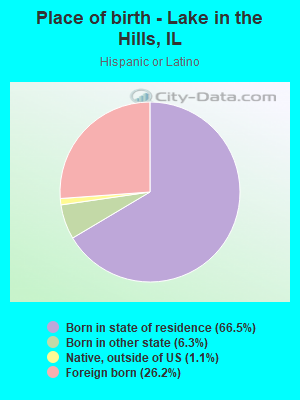
Races - Hispanic (%)
Races - Hispanic (% change since 2000)
Races - Native Hawaiian and Other Pacific Islander alone (%)
Races - Native Hawaiian and Other Pacific Islander alone (% change since 2000)
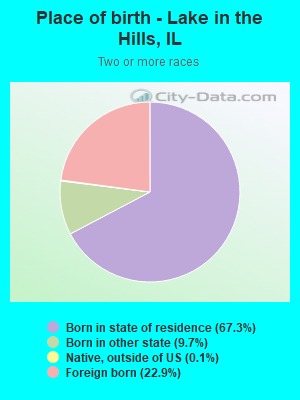
Races - Two or more races(%)
Races - Two or more races(% change since 2000)
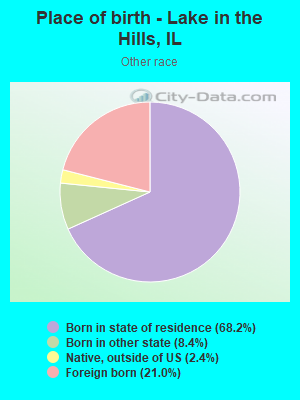
Races - Other race alone (%)
Races - Other race alone (% change since 2000)
Racial diversity
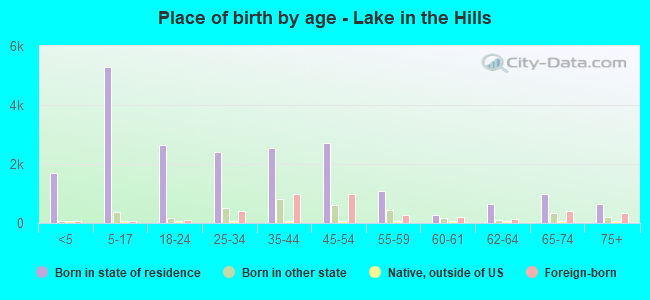
Place of birth - Born in state of residence (%)
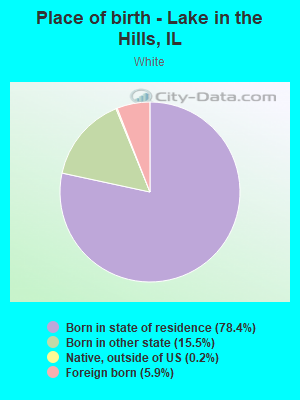
Place of birth - Born in state of residence (%) - White
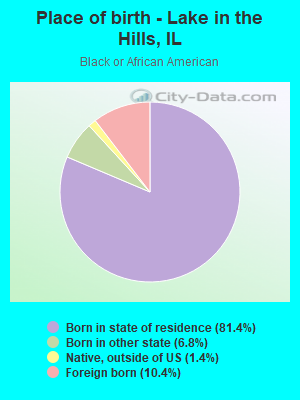
Place of birth - Born in state of residence (%) - Black or African American
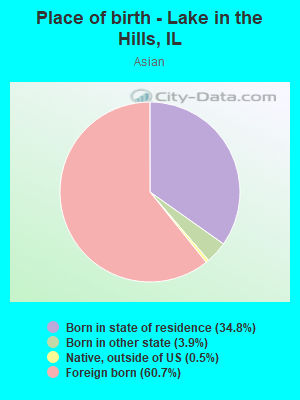
Place of birth - Born in state of residence (%) - Asian
Place of birth - Born in state of residence (%) - Hispanic or Latino
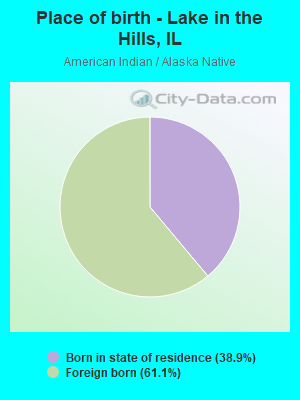
Place of birth - Born in state of residence (%) - American Indian and Alaska Native
Place of birth - Born in state of residence (%) - Multirace
Place of birth - Born in state of residence (%) - Other Race
Place of birth - Born in other state (%)
Place of birth - Born in other state (%) - White
Place of birth - Born in other state (%) - Black or African American
Place of birth - Born in other state (%) - Asian
Place of birth - Born in other state (%) - Hispanic or Latino
Place of birth - Born in other state (%) - American Indian and Alaska Native
Place of birth - Born in other state (%) - Multirace
Place of birth - Born in other state (%) - Other Race
Place of birth - Native, outside of US (%)
Place of birth - Native, outside of US (%) - White
Place of birth - Native, outside of US (%) - Black or African American
Place of birth - Native, outside of US (%) - Asian
Place of birth - Native, outside of US (%) - Hispanic or Latino
Place of birth - Native, outside of US (%) - American Indian and Alaska Native
Place of birth - Native, outside of US (%) - Multirace
Place of birth - Native, outside of US (%) - Other Race
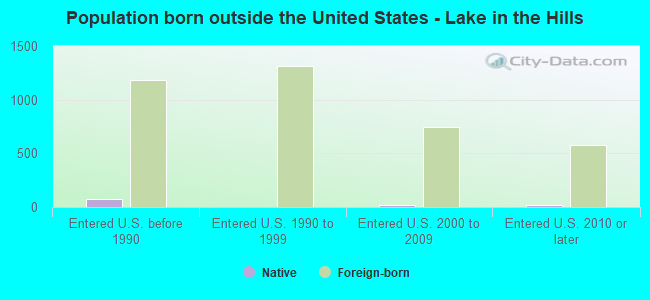
Place of birth - Foreign born (%)
Place of birth - Foreign born (%) - White
Place of birth - Foreign born (%) - Black or African American
Place of birth - Foreign born (%) - Asian
Place of birth - Foreign born (%) - Hispanic or Latino
Place of birth - Foreign born (%) - American Indian and Alaska Native
Place of birth - Foreign born (%) - Multirace
Place of birth - Foreign born (%) - Other Race
Residents speaking English at home (%)
Residents speaking English at home - Born in the United States (%)
Residents speaking English at home - Native, born elsewhere (%)
Residents speaking English at home - Foreign born (%)
Residents speaking Spanish at home (%)
Residents speaking Spanish at home - Born in the United States (%)
Residents speaking Spanish at home - Native, born elsewhere (%)
Residents speaking Spanish at home - Foreign born (%)
Residents speaking other language at home (%)
Residents speaking other language at home - Born in the United States (%)
Residents speaking other language at home - Native, born elsewhere (%)
Residents speaking other language at home - Foreign born (%)
Marital status - Never married (%)
Marital status - Now married (%)
Marital status - Separated (%)
Marital status - Widowed (%)
Marital status - Divorced (%)
Ancestries Reported - Arab (%)
Ancestries Reported - Czech (%)
Ancestries Reported - Danish (%)
Ancestries Reported - Dutch (%)
Ancestries Reported - English (%)
Ancestries Reported - French (%)
Ancestries Reported - French Canadian (%)
Ancestries Reported - German (%)
Ancestries Reported - Greek (%)
Ancestries Reported - Hungarian (%)
Ancestries Reported - Irish (%)
Ancestries Reported - Italian (%)
Ancestries Reported - Lithuanian (%)
Ancestries Reported - Norwegian (%)
Ancestries Reported - Polish (%)
Ancestries Reported - Portuguese (%)
Ancestries Reported - Russian (%)
Ancestries Reported - Scotch-Irish (%)
Ancestries Reported - Scottish (%)
Ancestries Reported - Slovak (%)
Ancestries Reported - Subsaharan African (%)
Ancestries Reported - Swedish (%)
Ancestries Reported - Swiss (%)
Ancestries Reported - Ukrainian (%)
Ancestries Reported - United States (%)
Ancestries Reported - Welsh (%)
Ancestries Reported - West Indian (%)
Ancestries Reported - Other (%)
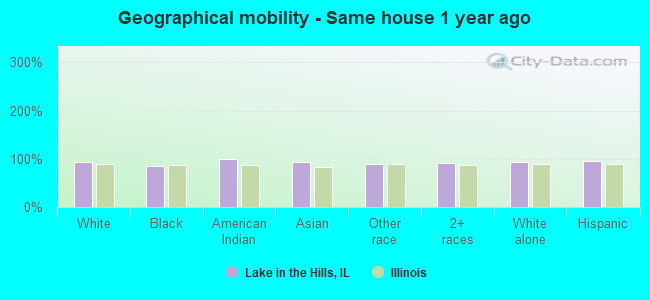
Geographical mobility - Same house 1 year ago (%)
Geographical mobility - Same house 1 year ago (%) - White
Geographical mobility - Same house 1 year ago (%) - Black or African American
Geographical mobility - Same house 1 year ago (%) - Asian
Geographical mobility - Same house 1 year ago (%) - Hispanic or Latino
Geographical mobility - Same house 1 year ago (%) - American Indian and Alaska Native
Geographical mobility - Same house 1 year ago (%) - Multirace
Geographical mobility - Same house 1 year ago (%) - Other Race
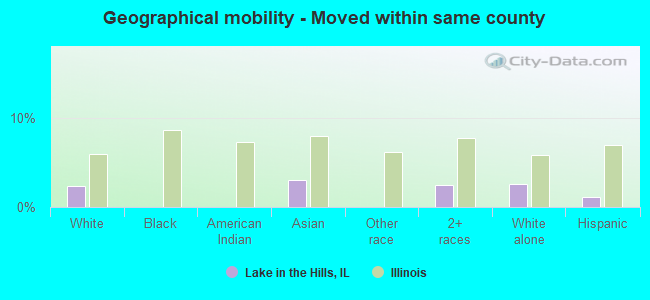
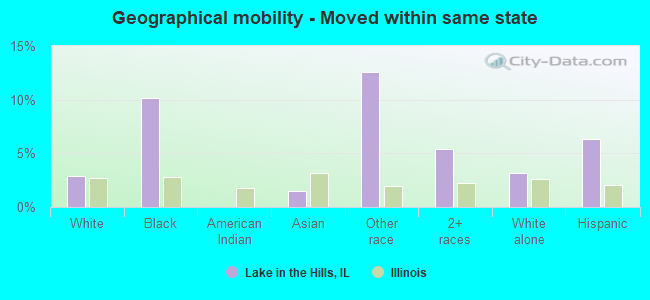
Geographical mobility - Moved within same county (%)
Geographical mobility - Moved within same county (%) - White
Geographical mobility - Moved within same county (%) - Black or African American
Geographical mobility - Moved within same county (%) - Asian
Geographical mobility - Moved within same county (%) - Hispanic or Latino
Geographical mobility - Moved within same county (%) - American Indian and Alaska Native
Geographical mobility - Moved within same county (%) - Multirace
Geographical mobility - Moved within same county (%) - Other Race
Geographical mobility - Moved from different county within same state (%)
Geographical mobility - Moved from different county within same state (%) - White
Geographical mobility - Moved from different county within same state (%) - Black or African American
Geographical mobility - Moved from different county within same state (%) - Asian
Geographical mobility - Moved from different county within same state (%) - Hispanic or Latino
Geographical mobility - Moved from different county within same state (%) - American Indian and Alaska Native
Geographical mobility - Moved from different county within same state (%) - Multirace
Geographical mobility - Moved from different county within same state (%) - Other Race
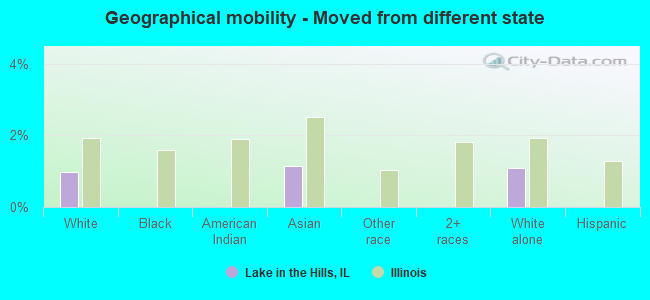
Geographical mobility - Moved from different state (%)
Geographical mobility - Moved from different state (%) - White
Geographical mobility - Moved from different state (%) - Black or African American
Geographical mobility - Moved from different state (%) - Asian
Geographical mobility - Moved from different state (%) - Hispanic or Latino
Geographical mobility - Moved from different state (%) - American Indian and Alaska Native
Geographical mobility - Moved from different state (%) - Multirace
Geographical mobility - Moved from different state (%) - Other Race
Geographical mobility - Moved from abroad (%)
Geographical mobility - Moved from abroad (%) - White
Geographical mobility - Moved from abroad (%) - Black or African American
Geographical mobility - Moved from abroad (%) - Asian
Geographical mobility - Moved from abroad (%) - Hispanic or Latino
Geographical mobility - Moved from abroad (%) - American Indian and Alaska Native
Geographical mobility - Moved from abroad (%) - Multirace
Geographical mobility - Moved from abroad (%) - Other Race
Place of birth for the foreign-born population - Ireland (%)
Place of birth for the foreign-born population - Denmark (%)
Place of birth for the foreign-born population - Norway (%)
Place of birth for the foreign-born population - Sweden (%)
Place of birth for the foreign-born population - United Kingdom (%)
Place of birth for the foreign-born population - England (%)
Place of birth for the foreign-born population - Scotland (%)
Place of birth for the foreign-born population - Other Northern Europe (%)
Place of birth for the foreign-born population - Austria (%)
Place of birth for the foreign-born population - Belgium (%)
Place of birth for the foreign-born population - France (%)
Place of birth for the foreign-born population - Germany (%)
Place of birth for the foreign-born population - Netherlands (%)
Place of birth for the foreign-born population - Switzerland (%)
Place of birth for the foreign-born population - Other Western Europe (%)
Place of birth for the foreign-born population - Greece (%)
Place of birth for the foreign-born population - Italy (%)
Place of birth for the foreign-born population - Portugal (%)
Place of birth for the foreign-born population - Spain (%)
Place of birth for the foreign-born population - Other Southern Europe (%)
Place of birth for the foreign-born population - Albania (%)
Place of birth for the foreign-born population - Belarus (%)
Place of birth for the foreign-born population - Bosnia and Herzegovina (%)
Place of birth for the foreign-born population - Bulgaria (%)
Place of birth for the foreign-born population - Croatia (%)
Place of birth for the foreign-born population - Czechoslovakia (%)
Place of birth for the foreign-born population - Hungary (%)
Place of birth for the foreign-born population - Latvia (%)
Place of birth for the foreign-born population - Lithuania (%)
Place of birth for the foreign-born population - North Macedonia (Macedonia) (%)
Place of birth for the foreign-born population - Moldova (%)
Place of birth for the foreign-born population - Poland (%)
Place of birth for the foreign-born population - Romania (%)
Place of birth for the foreign-born population - Russia (%)
Place of birth for the foreign-born population - Serbia (%)
Place of birth for the foreign-born population - Ukraine (%)
Place of birth for the foreign-born population - Other Eastern Europe (%)
Place of birth for the foreign-born population - China (%)
Place of birth for the foreign-born population - Hong Kong (%)
Place of birth for the foreign-born population - Taiwan (%)
Place of birth for the foreign-born population - Japan (%)
Place of birth for the foreign-born population - Korea (%)
Place of birth for the foreign-born population - Other Eastern Asia (%)
Place of birth for the foreign-born population - Afghanistan (%)
Place of birth for the foreign-born population - Bangladesh (%)
Place of birth for the foreign-born population - India (%)
Place of birth for the foreign-born population - Iran (%)
Place of birth for the foreign-born population - Kazakhstan (%)
Place of birth for the foreign-born population - Nepal (%)
Place of birth for the foreign-born population - Pakistan (%)
Place of birth for the foreign-born population - Sri Lanka (%)
Place of birth for the foreign-born population - Uzbekistan (%)
Place of birth for the foreign-born population - Other South Central Asia (%)
Place of birth for the foreign-born population - Burma (%)
Place of birth for the foreign-born population - Cambodia (%)
Place of birth for the foreign-born population - Indonesia (%)
Place of birth for the foreign-born population - Laos (%)
Place of birth for the foreign-born population - Malaysia (%)
Place of birth for the foreign-born population - Philippines (%)
Place of birth for the foreign-born population - Singapore (%)
Place of birth for the foreign-born population - Thailand (%)
Place of birth for the foreign-born population - Vietnam (%)
Place of birth for the foreign-born population - Other South Eastern Asia (%)
Place of birth for the foreign-born population - Armenia (%)
Place of birth for the foreign-born population - Iraq (%)
Place of birth for the foreign-born population - Israel (%)
Place of birth for the foreign-born population - Jordan (%)
Place of birth for the foreign-born population - Kuwait (%)
Place of birth for the foreign-born population - Lebanon (%)
Place of birth for the foreign-born population - Saudi Arabia (%)
Place of birth for the foreign-born population - Syria (%)
Place of birth for the foreign-born population - Turkey (%)
Place of birth for the foreign-born population - Yemen (%)
Place of birth for the foreign-born population - Other Western Asia (%)
Place of birth for the foreign-born population - Eritrea (%)
Place of birth for the foreign-born population - Ethiopia (%)
Place of birth for the foreign-born population - Kenya (%)
Place of birth for the foreign-born population - Somalia (%)
Place of birth for the foreign-born population - Uganda (%)
Place of birth for the foreign-born population - Zimbabwe (%)
Place of birth for the foreign-born population - Other Eastern Africa (%)
Place of birth for the foreign-born population - Cameroon (%)
Place of birth for the foreign-born population - Congo (%)
Place of birth for the foreign-born population - Democratic Republic of Congo (Zaire) (%)
Place of birth for the foreign-born population - Other Middle Africa (%)
Place of birth for the foreign-born population - Egypt (%)
Place of birth for the foreign-born population - Morocco (%)
Place of birth for the foreign-born population - Sudan (%)
Place of birth for the foreign-born population - Other Northern Africa (%)
Place of birth for the foreign-born population - South Africa (%)
Place of birth for the foreign-born population - Other Southern Africa (%)
Place of birth for the foreign-born population - Cabo Verde (%)
Place of birth for the foreign-born population - Ghana (%)
Place of birth for the foreign-born population - Liberia (%)
Place of birth for the foreign-born population - Nigeria (%)
Place of birth for the foreign-born population - Senegal (%)
Place of birth for the foreign-born population - Sierra Leone (%)
Place of birth for the foreign-born population - Other Western Africa (%)
Place of birth for the foreign-born population - Australia (%)
Place of birth for the foreign-born population - New Zealand (%)
Place of birth for the foreign-born population - Fiji (%)
Place of birth for the foreign-born population - Micronesia (%)
Place of birth for the foreign-born population - Bahamas (%)
Place of birth for the foreign-born population - Barbados (%)
Place of birth for the foreign-born population - Cuba (%)
Place of birth for the foreign-born population - Dominica (%)
Place of birth for the foreign-born population - Dominican Republic (%)
Place of birth for the foreign-born population - Grenada (%)
Place of birth for the foreign-born population - Haiti (%)
Place of birth for the foreign-born population - Jamaica (%)
Place of birth for the foreign-born population - St. Vincent and the Grenadines (%)
Place of birth for the foreign-born population - Trinidad and Tobago (%)
Place of birth for the foreign-born population - West Indies (%)
Place of birth for the foreign-born population - Other Caribbean (%)
Place of birth for the foreign-born population - Belize (%)
Place of birth for the foreign-born population - Costa Rica (%)
Place of birth for the foreign-born population - El Salvador (%)
Place of birth for the foreign-born population - Guatemala (%)
Place of birth for the foreign-born population - Honduras (%)
Place of birth for the foreign-born population - Mexico (%)
Place of birth for the foreign-born population - Nicaragua (%)
Place of birth for the foreign-born population - Panama (%)
Place of birth for the foreign-born population - Other Central America (%)
Place of birth for the foreign-born population - Argentina (%)
Place of birth for the foreign-born population - Bolivia (%)
Place of birth for the foreign-born population - Brazil (%)
Place of birth for the foreign-born population - Chile (%)
Place of birth for the foreign-born population - Colombia (%)
Place of birth for the foreign-born population - Ecuador (%)
Place of birth for the foreign-born population - Guyana (%)
Place of birth for the foreign-born population - Peru (%)
Place of birth for the foreign-born population - Uruguay (%)
Place of birth for the foreign-born population - Venezuela (%)
Place of birth for the foreign-born population - Other South America (%)
Place of birth for the foreign-born population - Canada (%)
Place of birth for the foreign-born population - Other Northern America (%)
Place of birth for the foreign-born population - Other (%)
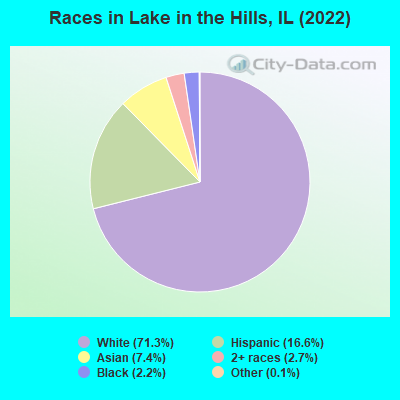
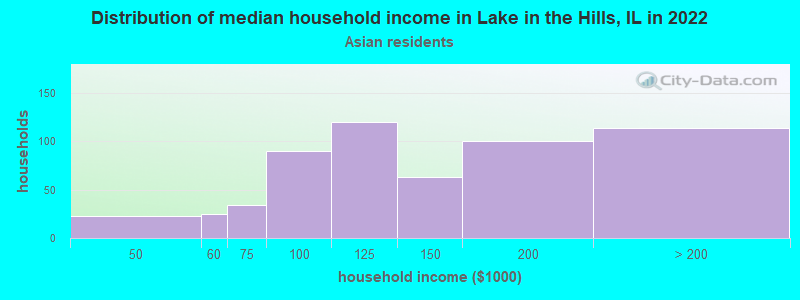
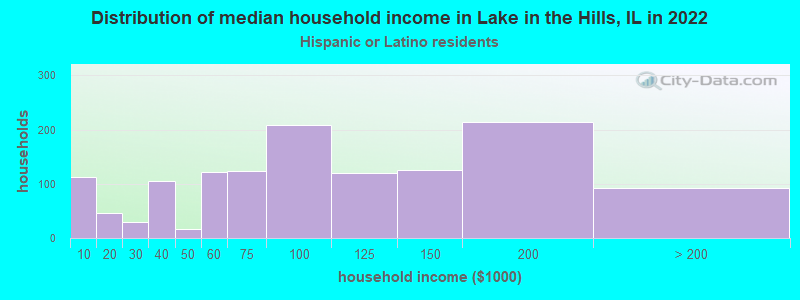
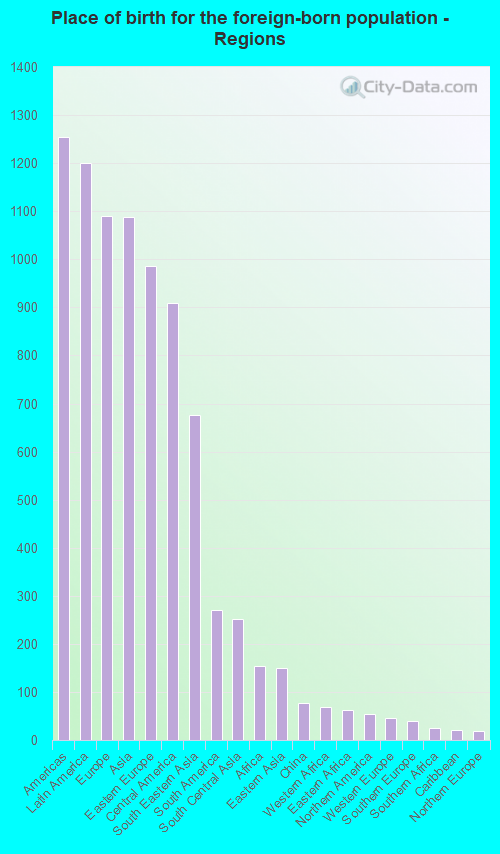
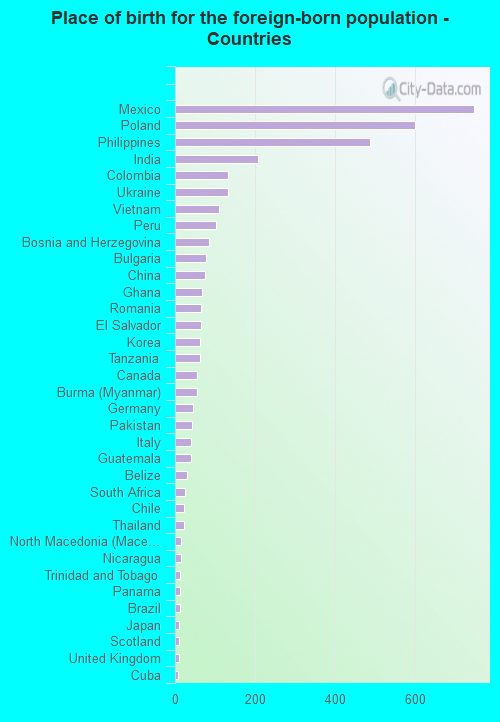
According to 2022 data, the most numerous races in Lake in the Hills, IL are White alone (20,680 residents), Hispanic (4,827 residents), and Black alone (638 residents). 78.8% of Lake in the Hills residents speak English at home. 12.4% of Lake in the Hills, IL residents are foreign-born (4.1% born in Latin America, 3.8% born in Europe, 3.7% born in Asia), which is 13.2% less than the foreign-born rate of 14.0% across the entire state of Illinois.
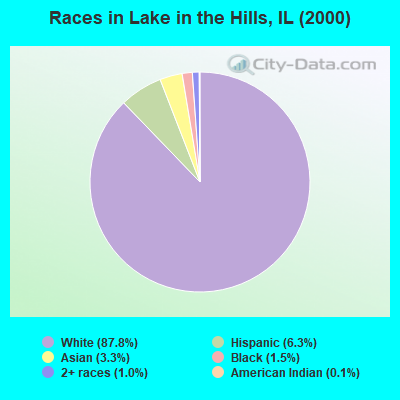
Race distribution in Lake in the Hills
2000 2022
8,424,140 67.8% White alone 1,856,152 14.9% Black alone 1,530,262 12.3% Hispanic 419,916 3.4% Asian alone 153,996 1.2% Two or more races 13,479 0.1% Other race alone 18,232 0.1% American Indian alone 3,116 0.03% Native Hawaiian and Other
7,356,301 58.5% White alone 2,299,726 18.3% Hispanic 1,660,423 13.2% Black alone 747,296 5.9% Asian alone 458,599 3.6% Two or more races 45,386 0.4% Other race alone 10,405 0.08% American Indian alone 3,896 0.03% Native Hawaiian and Other
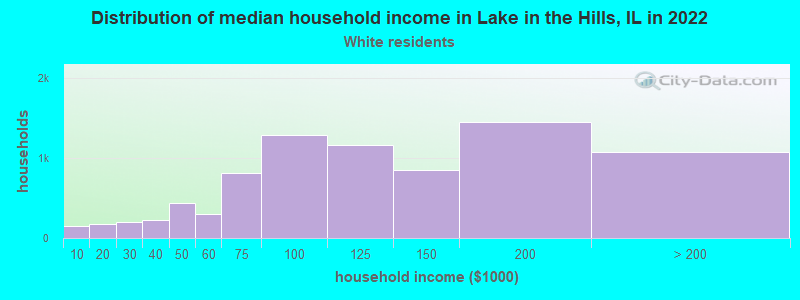
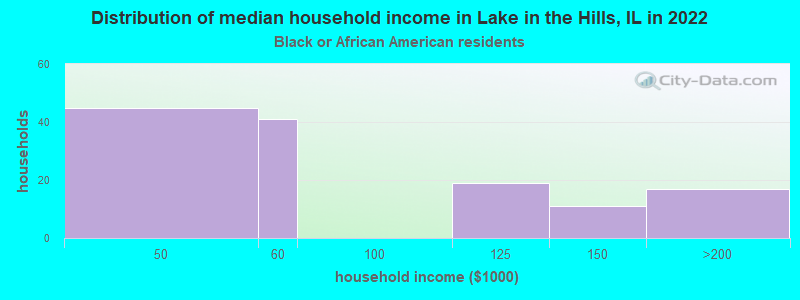
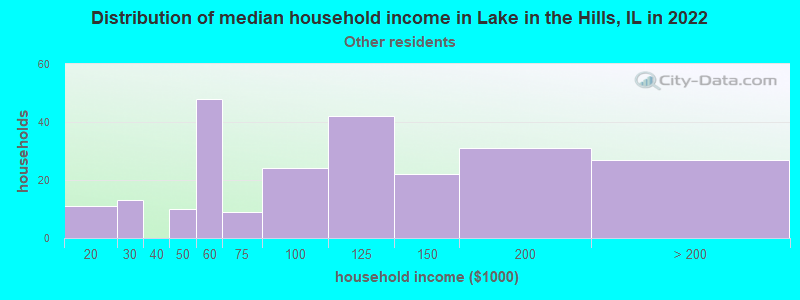
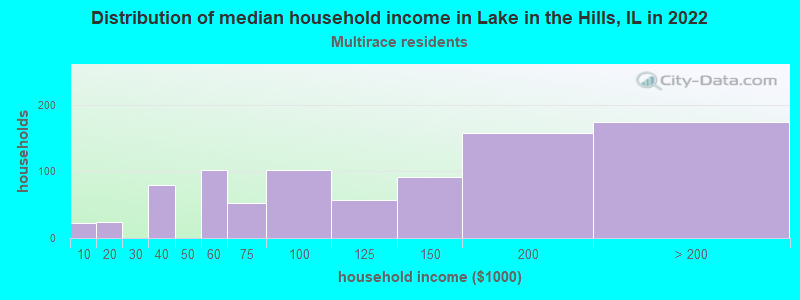
Income and house value in Lake in the Hills Median household income in 2022 $110,836 White non-Hispanic householders$54,526 Black householders$128,128 Asian householders$65,431 Some other race householders$103,389 Two or more races householders$80,686 Hispanic or Latino race householdersMedian 2022 house value $305,466 White Non-Hispanic householders$286,374 Black or African American householders$136,368 American Indian or Alaska Native householders $351,831 Asian householders$368,014 Some other race householders$295,466 Two or more races householders$313,103 Hispanic or Latino householders
Median age by race in Lake in the Hills
38.8 Median age for White residents38.2 39.6 23.1 Median age for Black or African American residents16.8 24.9 41.4 Median age for American Indian / Alaska Native residents-826,666,665.8 21.9 41.7 Median age for Asian residents40.0 40.9 -666,666,666.0 Median age for Native Hawaiian / Pacific Islander residents-666,666,666.0 -666,666,666.0 21.6 Median age for Other race residents13.8 27.7 24.8 Median age for Two or more races residents21.1 27.3 38.7 Median age for White alone residents37.2 40.4 25.0 Median age for Hispanic or Latino residents25.3 23.1
Owner/renter occupied households by race in Lake in the Hills
House owners and renters - White residents 7,193 87.5% Owner occupied1,029 12.5% Renter occupiedHouse owners and renters - Black or African American residents 49 53.3% Owner occupied43 46.7% Renter occupiedHouse owners and renters - American Indian / Alaska Native residents 17 100.0% Owner occupiedHouse owners and renters - Asian residents 745 97.6% Owner occupied18 2.4% Renter occupiedHouse owners and renters - Other race residents 253 97.3% Owner occupied7 2.7% Renter occupiedHouse owners and renters - Two or more races residents 796 82.5% Owner occupied169 17.5% Renter occupiedHouse owners and renters - White alone residents 6,844 86.4% Owner occupied1,073 13.6% Renter occupiedHouse owners and renters - Hispanic or Latino residents 1,288 92.5% Owner occupied105 7.5% Renter occupied
Language usage in Lake in the Hills
English speakers - Total 78.8% of residents of Lake in the Hills speak English at home.
10.4% of residents speak Spanish at home 2,260 79.6% Speak English very well580 20.4% Speak English less than very well11.9% of residents speak other language at home 1,998 61.8% Speak English very well1,234 38.2% Speak English less than very well
English speakers - Born in the United States 92.0% of residents of Lake in the Hills speak English at home.
5.3% of residents speak Spanish at home 201 100.0% Speak English very well2.2% of residents speak other language at home 44 52.4% Speak English very well40 47.6% Speak English less than very well
English speakers - Native, born elsewhere 54.3% of residents of Lake in the Hills speak English at home.
37.1% of residents speak Spanish at home 43 100.0% Speak English very well18.1% of residents speak other language at home 21 100.0% Speak English less than very well
English speakers - Foreign-born 10.9% of residents of Lake in the Hills speak English at home.
34.3% of residents speak Spanish at home 881 66.6% Speak English very well442 33.4% Speak English less than very well58.9% of residents speak other language at home 1,202 52.9% Speak English very well1,071 47.1% Speak English less than very well
White (Caucasian) - Speak only English Native:
96.6% (18,304)Foreign-born:
14.0% (177)
White (Caucasian) - Speak another language Native:
3.5% (659)Foreign-born:
86.7% (1,098)
Black or African American - Speak only English Native:
98.2% (625)Foreign-born:
45.9% (38)
Black or African American - Speak another language Native:
1.8% (11)Foreign-born:
56.0% (46)
American Indian / Alaska Native - Speak another language Native:
69.8% (20)Foreign-born:
100.0% (39)
Asian - Speak only English Native:
40.3% (279)Foreign-born:
18.6% (247)
Asian - Speak another language Native:
61.9% (428)Foreign-born:
81.4% (1,083)
Other race - Speak another language Native:
71.5% (408)Foreign-born:
92.4% (199)
Two or more races - Speak only English Native:
59.9% (1,708)Foreign-born:
0.8% (8)
Two or more races - Speak another language Native:
40.1% (1,145)Foreign-born:
100.0% (959)
White alone - Speak only English Native:
96.5% (17,863)Foreign-born:
14.8% (186)
White alone - Speak another language Native:
3.6% (668)Foreign-born:
91.3% (1,147)
Hispanic or Latino - Speak only English Native:
51.6% (1,554)Foreign-born:
0.6% (7)
Hispanic or Latino - Speak another language Native:
47.0% (1,414)Foreign-born:
100.0% (1,260)
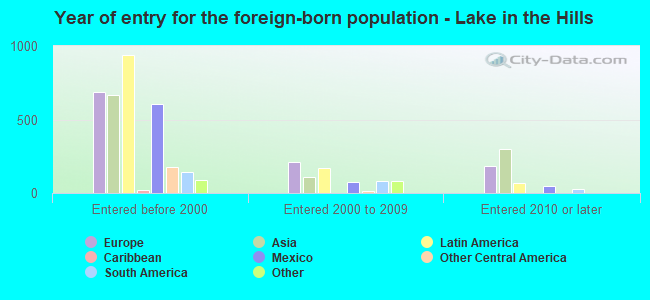
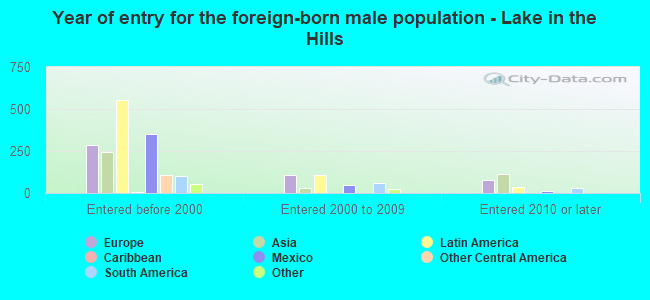
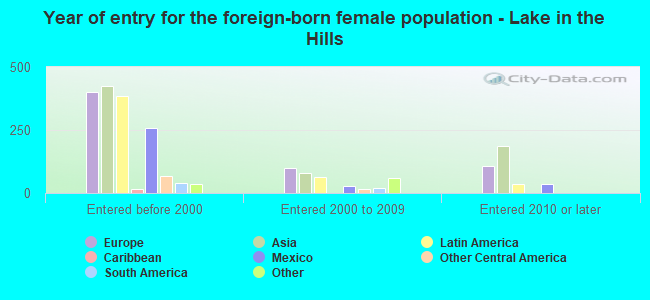
Foreign-born residents in Lake in the Hills 3,588 residents are foreign born (4.1% Latin America , 3.8% Europe , 3.7% Asia ).
This city:
12.4%Illinois:
14.1%
Marital status for residents in Lake in the Hills Marital status - White (Caucasian) population 15 years and over
Males 32.0% Never married59.5% Now married0.5% Separated1.0% Widowed7.0% DivorcedFemales 26.8% Never married56.4% Now married0.2% Separated4.6% Widowed12.0% DivorcedWomen who gave birth in the past 12 months Now married:
74.3% (351)Unmarried:
25.7% (121)
Women who did not give birth in the past 12 months Now married:
52.5% (2,579)Unmarried:
47.5% (2,334)
Marital status - Black or African American population 15 years and over
Males 50.5% Never married45.6% Now married0.0% Separated0.0% Widowed3.8% DivorcedFemales 60.6% Never married25.8% Now married7.7% Separated0.0% Widowed5.9% DivorcedWomen who did not give birth in the past 12 months Now married:
19.1% (58)Unmarried:
80.9% (244)
Marital status - American Indian / Alaska Native population 15 years and over
Males 0.0% Never married100.0% Now married0.0% Separated0.0% Widowed0.0% DivorcedFemales 100.0% Never married0.0% Now married0.0% Separated0.0% Widowed0.0% DivorcedWomen who did not give birth in the past 12 months Now married:
0.0% (0)Unmarried:
100.0% (40)
Marital status - Asian population 15 years and over
Males 24.6% Never married70.3% Now married0.0% Separated0.0% Widowed5.0% DivorcedFemales 21.1% Never married66.9% Now married1.6% Separated5.1% Widowed5.3% DivorcedWomen who gave birth in the past 12 months Now married:
100.0% (17)Unmarried:
0.0% (0)
Women who did not give birth in the past 12 months Now married:
65.3% (285)Unmarried:
34.7% (151)
Marital status - Other race population 15 years and over
Males 17.1% Never married82.9% Now married0.0% Separated0.0% Widowed0.0% DivorcedFemales 17.7% Never married65.2% Now married0.0% Separated4.0% Widowed13.1% DivorcedWomen who gave birth in the past 12 months Now married:
100.0% (22)Unmarried:
0.0% (0)
Women who did not give birth in the past 12 months Now married:
69.5% (95)Unmarried:
30.5% (42)
Marital status - Two or more races population 15 years and over
Males 52.8% Never married40.8% Now married0.0% Separated0.0% Widowed6.4% DivorcedFemales 60.2% Never married32.8% Now married1.4% Separated0.0% Widowed5.5% DivorcedWomen who did not give birth in the past 12 months Now married:
22.8% (225)Unmarried:
77.2% (763)
Marital status - White alone, not Hispanic / Latino population 15 years and over
Males 29.6% Never married62.0% Now married0.2% Separated1.0% Widowed7.2% DivorcedFemales 25.6% Never married56.9% Now married0.1% Separated4.9% Widowed12.4% DivorcedWomen who gave birth in the past 12 months Now married:
82.9% (338)Unmarried:
17.1% (70)
Women who did not give birth in the past 12 months Now married:
53.0% (2,579)Unmarried:
47.0% (2,289)
Marital status - Hispanic or Latino population 15 years and over
Males 49.2% Never married42.7% Now married1.8% Separated0.5% Widowed5.8% DivorcedFemales 47.2% Never married44.0% Now married1.4% Separated0.6% Widowed6.8% DivorcedWomen who gave birth in the past 12 months Now married:
47.9% (61)Unmarried:
52.1% (67)
Women who did not give birth in the past 12 months Now married:
37.2% (410)Unmarried:
62.8% (692)
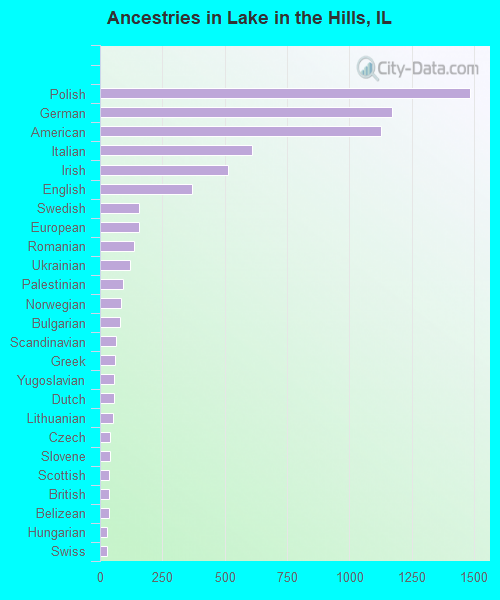
Ancestries in Lake in the Hills
1,486 13.6% Polish1,170 10.7% German1,127 10.3% American609 5.6% Italian513 4.7% Irish368 3.4% English156 1.4% Swedish156 1.4% European136 1.2% Romanian121 1.1% Ukrainian91 0.8% Palestinian83 0.8% Norwegian79 0.7% Bulgarian63 0.6% Scandinavian59 0.5% Greek58 0.5% Yugoslavian56 0.5% Dutch53 0.5% Lithuanian41 0.4% Czech39 0.4% Slovene37 0.3% Scottish36 0.3% British36 0.3% Belizean30 0.3% Hungarian30 0.3% Swiss29 0.3% French22 0.2% Serbian21 0.2% African18 0.2% Northern European16 0.1% Eastern European15 0.1% Albanian13 0.1% Brazilian13 0.1% Croatian9 0.08% Armenian7 0.06% Russian7 0.06% Scotch-Irish7 0.06% Danish5 0.05% Finnish4 0.04% Israeli
Children Nativity (place of birth) in Lake in the Hills
Children under 6 years - Living with two parents Both parents native 1,312 100.0% NativeBoth parents foreign-born 193 94.6% Native11 5.4% Foreign-bornOne native, one foreign-born parent 320 100.0% NativeChildren under 6 years - Living with one parent Native parent 282 100.0% NativeForeign-born parent 94 100.0% NativeChildren 6 to 17 years - Living with two parents Both parents native 2,797 99.7% Native9 0.3% Foreign-bornBoth parents foreign-born 743 94.5% Native44 5.5% Foreign-bornOne native, one foreign-born parent 624 100.0% NativeChildren 6 to 17 years - Living with one parent Native parent 850 100.0% NativeForeign-born parent 187 49.1% Native194 50.9% Foreign-born
Grandparents responsible for own grandchildren in Lake in the Hills
Grandparents (30 to 59 years) White / Caucasian 9 8.0% Responsible for grandchildren100 92.0% Not responsible for grandchildrenAsian 28 100.0% Not responsible for grandchildrenWhite alone, not Hispanic / Latino 8 9.8% Responsible for grandchildren77 90.2% Not responsible for grandchildrenHispanic or Latino 41 100.0% Not responsible for grandchildrenGrandparents (60 years and over) White / Caucasian 202 100.0% Not responsible for grandchildrenAsian 18 8.9% Responsible for grandchildren181 91.1% Not responsible for grandchildrenWhite alone, not Hispanic / Latino 186 100.0% Not responsible for grandchildrenHispanic or Latino 88 100.0% Not responsible for grandchildren