Races in Lakeland, Florida (FL) Detailed Stats
Data:
Races - White alone (%)
Races - White alone (% change since 2000)
Races - Black alone (%)
Races - Black alone (% change since 2000)
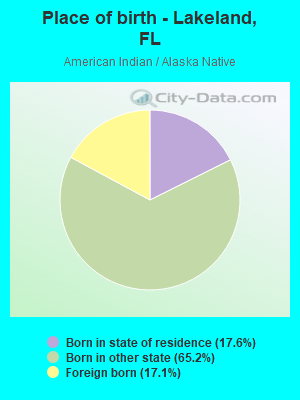
Races - American Indian alone (%)
Races - American Indian alone (% change since 2000)
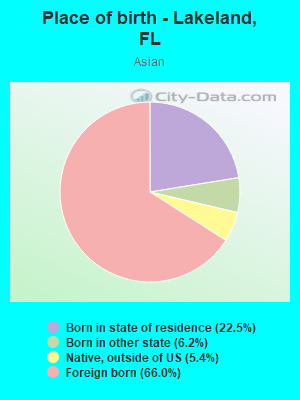
Races - Asian alone (%)
Races - Asian alone (% change since 2000)
Races - Hispanic (%)
Races - Hispanic (% change since 2000)
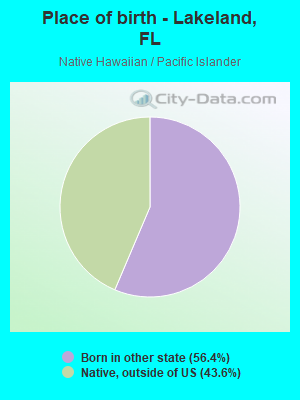
Races - Native Hawaiian and Other Pacific Islander alone (%)
Races - Native Hawaiian and Other Pacific Islander alone (% change since 2000)
Races - Two or more races(%)
Races - Two or more races(% change since 2000)
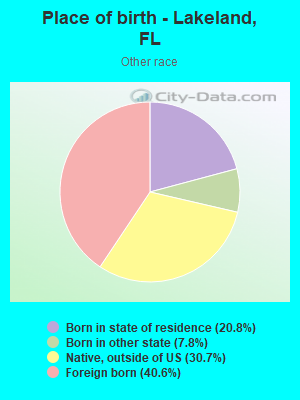
Races - Other race alone (%)
Races - Other race alone (% change since 2000)
Racial diversity
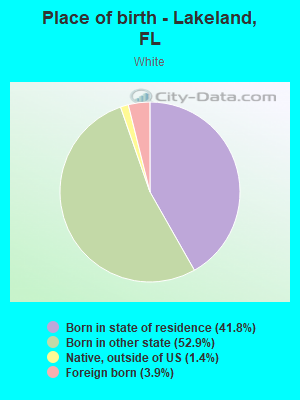
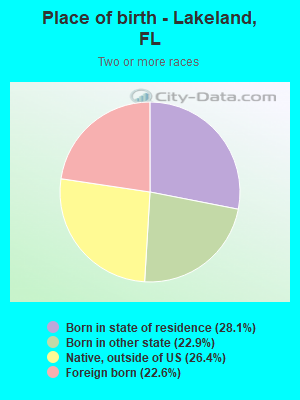
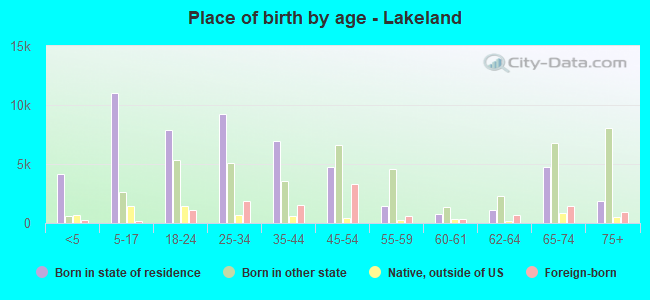
Place of birth - Born in state of residence (%)
Place of birth - Born in state of residence (%) - White
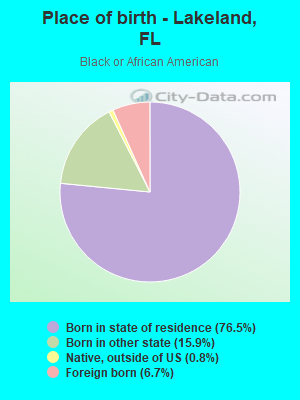
Place of birth - Born in state of residence (%) - Black or African American
Place of birth - Born in state of residence (%) - Asian
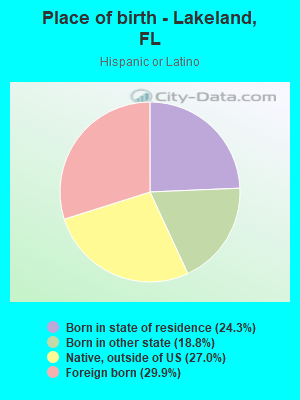
Place of birth - Born in state of residence (%) - Hispanic or Latino
Place of birth - Born in state of residence (%) - American Indian and Alaska Native
Place of birth - Born in state of residence (%) - Multirace
Place of birth - Born in state of residence (%) - Other Race
Place of birth - Born in other state (%)
Place of birth - Born in other state (%) - White
Place of birth - Born in other state (%) - Black or African American
Place of birth - Born in other state (%) - Asian
Place of birth - Born in other state (%) - Hispanic or Latino
Place of birth - Born in other state (%) - American Indian and Alaska Native
Place of birth - Born in other state (%) - Multirace
Place of birth - Born in other state (%) - Other Race
Place of birth - Native, outside of US (%)
Place of birth - Native, outside of US (%) - White
Place of birth - Native, outside of US (%) - Black or African American
Place of birth - Native, outside of US (%) - Asian
Place of birth - Native, outside of US (%) - Hispanic or Latino
Place of birth - Native, outside of US (%) - American Indian and Alaska Native
Place of birth - Native, outside of US (%) - Multirace
Place of birth - Native, outside of US (%) - Other Race
Place of birth - Foreign born (%)
Place of birth - Foreign born (%) - White
Place of birth - Foreign born (%) - Black or African American
Place of birth - Foreign born (%) - Asian
Place of birth - Foreign born (%) - Hispanic or Latino
Place of birth - Foreign born (%) - American Indian and Alaska Native
Place of birth - Foreign born (%) - Multirace
Place of birth - Foreign born (%) - Other Race
Residents speaking English at home (%)
Residents speaking English at home - Born in the United States (%)
Residents speaking English at home - Native, born elsewhere (%)
Residents speaking English at home - Foreign born (%)
Residents speaking Spanish at home (%)
Residents speaking Spanish at home - Born in the United States (%)
Residents speaking Spanish at home - Native, born elsewhere (%)
Residents speaking Spanish at home - Foreign born (%)
Residents speaking other language at home (%)
Residents speaking other language at home - Born in the United States (%)
Residents speaking other language at home - Native, born elsewhere (%)
Residents speaking other language at home - Foreign born (%)
Marital status - Never married (%)
Marital status - Now married (%)
Marital status - Separated (%)
Marital status - Widowed (%)
Marital status - Divorced (%)
Ancestries Reported - Arab (%)
Ancestries Reported - Czech (%)
Ancestries Reported - Danish (%)
Ancestries Reported - Dutch (%)
Ancestries Reported - English (%)
Ancestries Reported - French (%)
Ancestries Reported - French Canadian (%)
Ancestries Reported - German (%)
Ancestries Reported - Greek (%)
Ancestries Reported - Hungarian (%)
Ancestries Reported - Irish (%)
Ancestries Reported - Italian (%)
Ancestries Reported - Lithuanian (%)
Ancestries Reported - Norwegian (%)
Ancestries Reported - Polish (%)
Ancestries Reported - Portuguese (%)
Ancestries Reported - Russian (%)
Ancestries Reported - Scotch-Irish (%)
Ancestries Reported - Scottish (%)
Ancestries Reported - Slovak (%)
Ancestries Reported - Subsaharan African (%)
Ancestries Reported - Swedish (%)
Ancestries Reported - Swiss (%)
Ancestries Reported - Ukrainian (%)
Ancestries Reported - United States (%)
Ancestries Reported - Welsh (%)
Ancestries Reported - West Indian (%)
Ancestries Reported - Other (%)
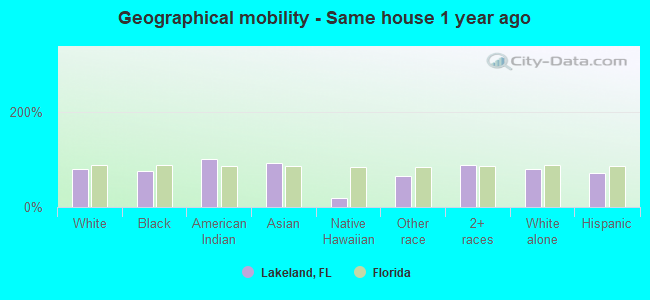
Geographical mobility - Same house 1 year ago (%)
Geographical mobility - Same house 1 year ago (%) - White
Geographical mobility - Same house 1 year ago (%) - Black or African American
Geographical mobility - Same house 1 year ago (%) - Asian
Geographical mobility - Same house 1 year ago (%) - Hispanic or Latino
Geographical mobility - Same house 1 year ago (%) - American Indian and Alaska Native
Geographical mobility - Same house 1 year ago (%) - Multirace
Geographical mobility - Same house 1 year ago (%) - Other Race
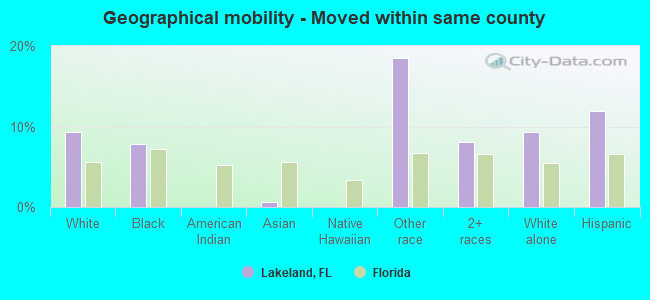
Geographical mobility - Moved within same county (%)
Geographical mobility - Moved within same county (%) - White
Geographical mobility - Moved within same county (%) - Black or African American
Geographical mobility - Moved within same county (%) - Asian
Geographical mobility - Moved within same county (%) - Hispanic or Latino
Geographical mobility - Moved within same county (%) - American Indian and Alaska Native
Geographical mobility - Moved within same county (%) - Multirace
Geographical mobility - Moved within same county (%) - Other Race
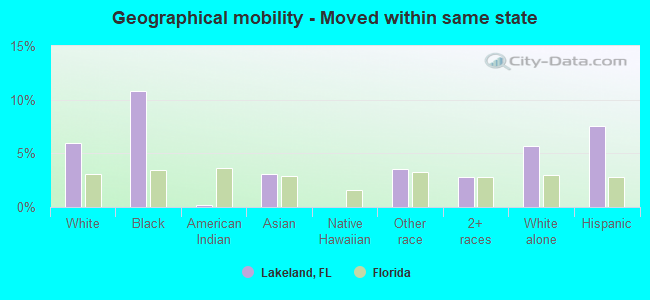
Geographical mobility - Moved from different county within same state (%)
Geographical mobility - Moved from different county within same state (%) - White
Geographical mobility - Moved from different county within same state (%) - Black or African American
Geographical mobility - Moved from different county within same state (%) - Asian
Geographical mobility - Moved from different county within same state (%) - Hispanic or Latino
Geographical mobility - Moved from different county within same state (%) - American Indian and Alaska Native
Geographical mobility - Moved from different county within same state (%) - Multirace
Geographical mobility - Moved from different county within same state (%) - Other Race
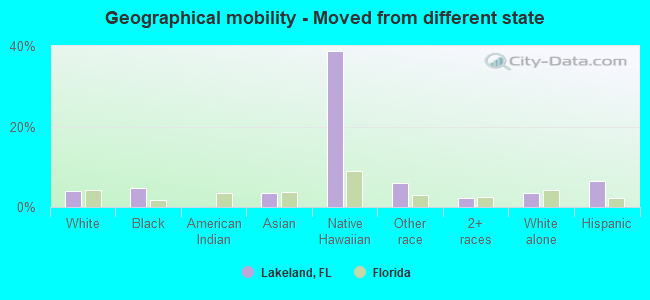
Geographical mobility - Moved from different state (%)
Geographical mobility - Moved from different state (%) - White
Geographical mobility - Moved from different state (%) - Black or African American
Geographical mobility - Moved from different state (%) - Asian
Geographical mobility - Moved from different state (%) - Hispanic or Latino
Geographical mobility - Moved from different state (%) - American Indian and Alaska Native
Geographical mobility - Moved from different state (%) - Multirace
Geographical mobility - Moved from different state (%) - Other Race
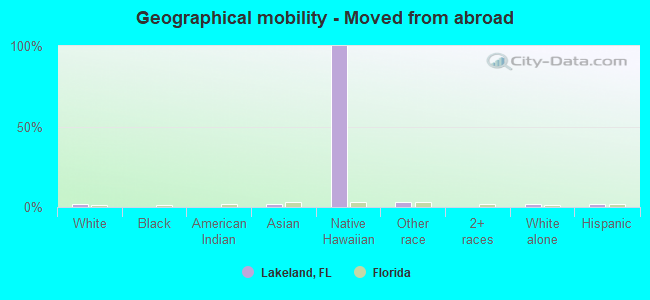
Geographical mobility - Moved from abroad (%)
Geographical mobility - Moved from abroad (%) - White
Geographical mobility - Moved from abroad (%) - Black or African American
Geographical mobility - Moved from abroad (%) - Asian
Geographical mobility - Moved from abroad (%) - Hispanic or Latino
Geographical mobility - Moved from abroad (%) - American Indian and Alaska Native
Geographical mobility - Moved from abroad (%) - Multirace
Geographical mobility - Moved from abroad (%) - Other Race
Place of birth for the foreign-born population - Ireland (%)
Place of birth for the foreign-born population - Denmark (%)
Place of birth for the foreign-born population - Norway (%)
Place of birth for the foreign-born population - Sweden (%)
Place of birth for the foreign-born population - United Kingdom (%)
Place of birth for the foreign-born population - England (%)
Place of birth for the foreign-born population - Scotland (%)
Place of birth for the foreign-born population - Other Northern Europe (%)
Place of birth for the foreign-born population - Austria (%)
Place of birth for the foreign-born population - Belgium (%)
Place of birth for the foreign-born population - France (%)
Place of birth for the foreign-born population - Germany (%)
Place of birth for the foreign-born population - Netherlands (%)
Place of birth for the foreign-born population - Switzerland (%)
Place of birth for the foreign-born population - Other Western Europe (%)
Place of birth for the foreign-born population - Greece (%)
Place of birth for the foreign-born population - Italy (%)
Place of birth for the foreign-born population - Portugal (%)
Place of birth for the foreign-born population - Spain (%)
Place of birth for the foreign-born population - Other Southern Europe (%)
Place of birth for the foreign-born population - Albania (%)
Place of birth for the foreign-born population - Belarus (%)
Place of birth for the foreign-born population - Bosnia and Herzegovina (%)
Place of birth for the foreign-born population - Bulgaria (%)
Place of birth for the foreign-born population - Croatia (%)
Place of birth for the foreign-born population - Czechoslovakia (%)
Place of birth for the foreign-born population - Hungary (%)
Place of birth for the foreign-born population - Latvia (%)
Place of birth for the foreign-born population - Lithuania (%)
Place of birth for the foreign-born population - North Macedonia (Macedonia) (%)
Place of birth for the foreign-born population - Moldova (%)
Place of birth for the foreign-born population - Poland (%)
Place of birth for the foreign-born population - Romania (%)
Place of birth for the foreign-born population - Russia (%)
Place of birth for the foreign-born population - Serbia (%)
Place of birth for the foreign-born population - Ukraine (%)
Place of birth for the foreign-born population - Other Eastern Europe (%)
Place of birth for the foreign-born population - China (%)
Place of birth for the foreign-born population - Hong Kong (%)
Place of birth for the foreign-born population - Taiwan (%)
Place of birth for the foreign-born population - Japan (%)
Place of birth for the foreign-born population - Korea (%)
Place of birth for the foreign-born population - Other Eastern Asia (%)
Place of birth for the foreign-born population - Afghanistan (%)
Place of birth for the foreign-born population - Bangladesh (%)
Place of birth for the foreign-born population - India (%)
Place of birth for the foreign-born population - Iran (%)
Place of birth for the foreign-born population - Kazakhstan (%)
Place of birth for the foreign-born population - Nepal (%)
Place of birth for the foreign-born population - Pakistan (%)
Place of birth for the foreign-born population - Sri Lanka (%)
Place of birth for the foreign-born population - Uzbekistan (%)
Place of birth for the foreign-born population - Other South Central Asia (%)
Place of birth for the foreign-born population - Burma (%)
Place of birth for the foreign-born population - Cambodia (%)
Place of birth for the foreign-born population - Indonesia (%)
Place of birth for the foreign-born population - Laos (%)
Place of birth for the foreign-born population - Malaysia (%)
Place of birth for the foreign-born population - Philippines (%)
Place of birth for the foreign-born population - Singapore (%)
Place of birth for the foreign-born population - Thailand (%)
Place of birth for the foreign-born population - Vietnam (%)
Place of birth for the foreign-born population - Other South Eastern Asia (%)
Place of birth for the foreign-born population - Armenia (%)
Place of birth for the foreign-born population - Iraq (%)
Place of birth for the foreign-born population - Israel (%)
Place of birth for the foreign-born population - Jordan (%)
Place of birth for the foreign-born population - Kuwait (%)
Place of birth for the foreign-born population - Lebanon (%)
Place of birth for the foreign-born population - Saudi Arabia (%)
Place of birth for the foreign-born population - Syria (%)
Place of birth for the foreign-born population - Turkey (%)
Place of birth for the foreign-born population - Yemen (%)
Place of birth for the foreign-born population - Other Western Asia (%)
Place of birth for the foreign-born population - Eritrea (%)
Place of birth for the foreign-born population - Ethiopia (%)
Place of birth for the foreign-born population - Kenya (%)
Place of birth for the foreign-born population - Somalia (%)
Place of birth for the foreign-born population - Uganda (%)
Place of birth for the foreign-born population - Zimbabwe (%)
Place of birth for the foreign-born population - Other Eastern Africa (%)
Place of birth for the foreign-born population - Cameroon (%)
Place of birth for the foreign-born population - Congo (%)
Place of birth for the foreign-born population - Democratic Republic of Congo (Zaire) (%)
Place of birth for the foreign-born population - Other Middle Africa (%)
Place of birth for the foreign-born population - Egypt (%)
Place of birth for the foreign-born population - Morocco (%)
Place of birth for the foreign-born population - Sudan (%)
Place of birth for the foreign-born population - Other Northern Africa (%)
Place of birth for the foreign-born population - South Africa (%)
Place of birth for the foreign-born population - Other Southern Africa (%)
Place of birth for the foreign-born population - Cabo Verde (%)
Place of birth for the foreign-born population - Ghana (%)
Place of birth for the foreign-born population - Liberia (%)
Place of birth for the foreign-born population - Nigeria (%)
Place of birth for the foreign-born population - Senegal (%)
Place of birth for the foreign-born population - Sierra Leone (%)
Place of birth for the foreign-born population - Other Western Africa (%)
Place of birth for the foreign-born population - Australia (%)
Place of birth for the foreign-born population - New Zealand (%)
Place of birth for the foreign-born population - Fiji (%)
Place of birth for the foreign-born population - Micronesia (%)
Place of birth for the foreign-born population - Bahamas (%)
Place of birth for the foreign-born population - Barbados (%)
Place of birth for the foreign-born population - Cuba (%)
Place of birth for the foreign-born population - Dominica (%)
Place of birth for the foreign-born population - Dominican Republic (%)
Place of birth for the foreign-born population - Grenada (%)
Place of birth for the foreign-born population - Haiti (%)
Place of birth for the foreign-born population - Jamaica (%)
Place of birth for the foreign-born population - St. Vincent and the Grenadines (%)
Place of birth for the foreign-born population - Trinidad and Tobago (%)
Place of birth for the foreign-born population - West Indies (%)
Place of birth for the foreign-born population - Other Caribbean (%)
Place of birth for the foreign-born population - Belize (%)
Place of birth for the foreign-born population - Costa Rica (%)
Place of birth for the foreign-born population - El Salvador (%)
Place of birth for the foreign-born population - Guatemala (%)
Place of birth for the foreign-born population - Honduras (%)
Place of birth for the foreign-born population - Mexico (%)
Place of birth for the foreign-born population - Nicaragua (%)
Place of birth for the foreign-born population - Panama (%)
Place of birth for the foreign-born population - Other Central America (%)
Place of birth for the foreign-born population - Argentina (%)
Place of birth for the foreign-born population - Bolivia (%)
Place of birth for the foreign-born population - Brazil (%)
Place of birth for the foreign-born population - Chile (%)
Place of birth for the foreign-born population - Colombia (%)
Place of birth for the foreign-born population - Ecuador (%)
Place of birth for the foreign-born population - Guyana (%)
Place of birth for the foreign-born population - Peru (%)
Place of birth for the foreign-born population - Uruguay (%)
Place of birth for the foreign-born population - Venezuela (%)
Place of birth for the foreign-born population - Other South America (%)
Place of birth for the foreign-born population - Canada (%)
Place of birth for the foreign-born population - Other Northern America (%)
Place of birth for the foreign-born population - Other (%)
Latest news about races in Lakeland, FL collected exclusively by city-data.com from local newspapers, TV, and radio stations
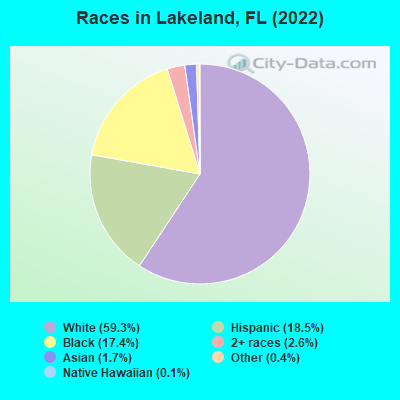
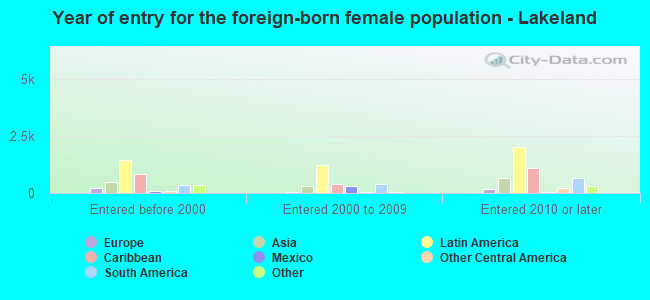
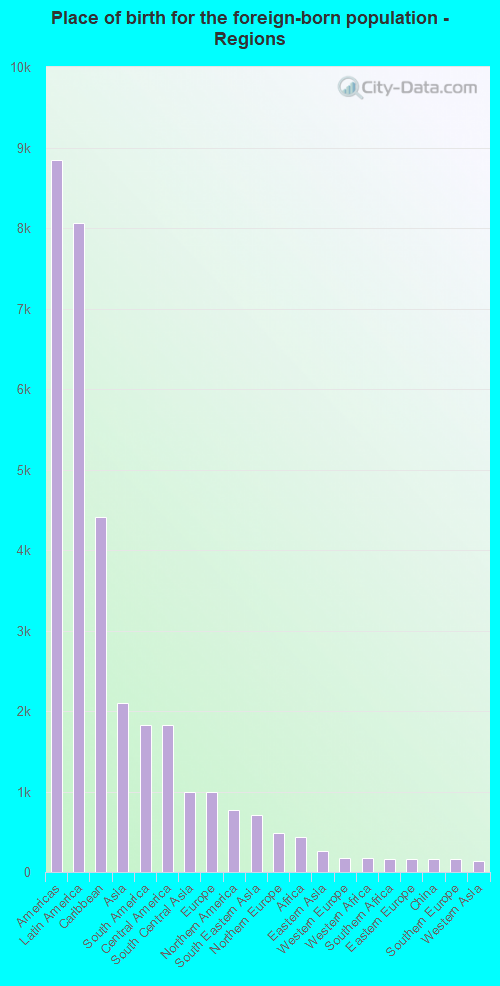
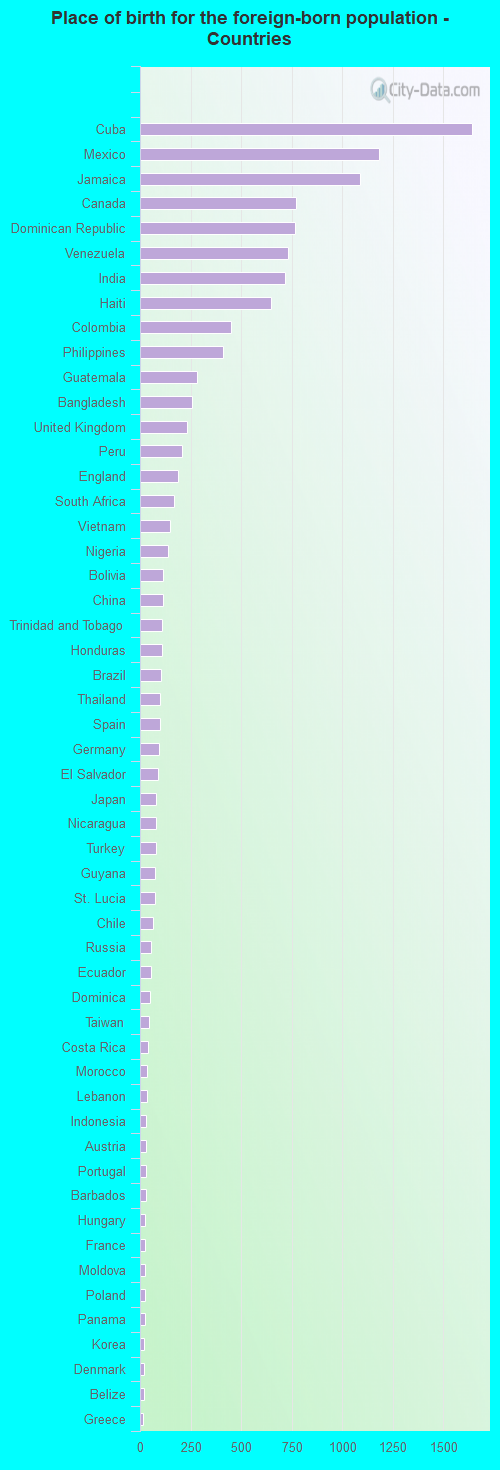
According to 2022 data, the most numerous races in Lakeland, FL are White alone (71,224 residents), Hispanic (22,240 residents), and Black alone (20,881 residents). 81.1% of Lakeland residents speak English at home. 10.1% of Lakeland, FL residents are foreign-born (6.7% born in Latin America, 1.7% born in Asia), which is 107.4% less than the foreign-born rate of 21.0% across the entire state of Florida.
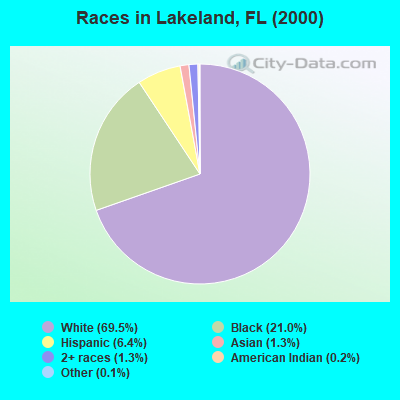
Race distribution in Lakeland
2000 2022
54,555 69.5% White alone 16,500 21.0% Black alone 5,032 6.4% Hispanic 1,022 1.3% Two or more races 1,040 1.3% Asian alone 176 0.2% American Indian alone 92 0.1% Other race alone 35 0.04% Native Hawaiian and Other
71,224 59.3% White alone 22,240 18.5% Hispanic 20,881 17.4% Black alone 3,079 2.6% Two or more races 2,071 1.7% Asian alone 423 0.4% Other race alone 126 0.1% Native Hawaiian and Other
2000 2022
10,458,509 65.4% White alone 2,682,715 16.8% Hispanic 2,264,268 14.2% Black alone 261,693 1.6% Asian alone 236,954 1.5% Two or more races 42,358 0.3% American Indian alone 28,994 0.2% Other race alone 6,887 0.04% Native Hawaiian and Other
11,309,403 50.8% White alone 6,025,039 27.1% Hispanic 3,241,015 14.6% Black alone 861,630 3.9% Two or more races 623,692 2.8% Asian alone 152,054 0.7% Other race alone 22,504 0.1% American Indian alone 9,486 0.04% Native Hawaiian and Other
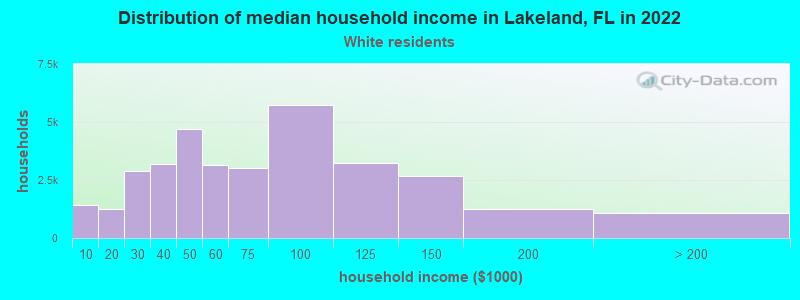
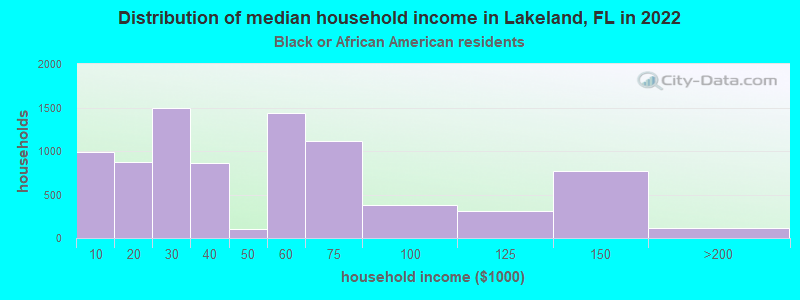
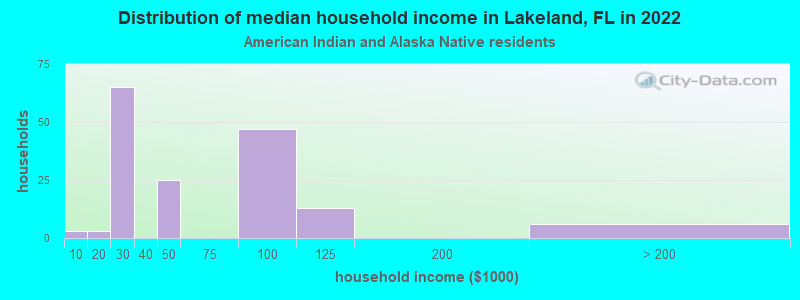
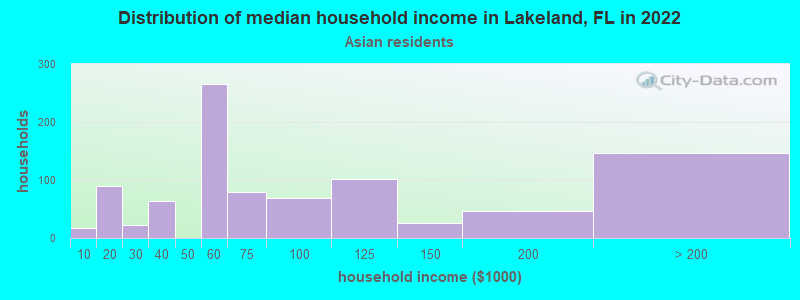
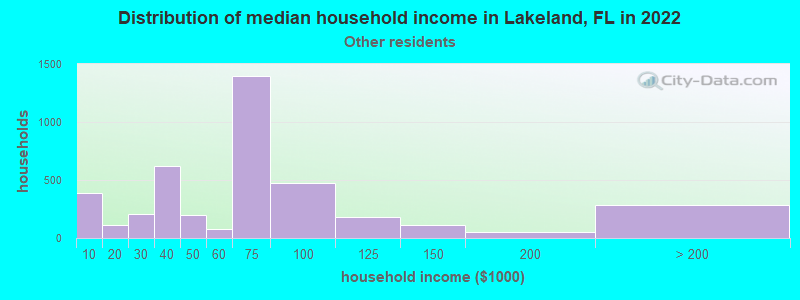
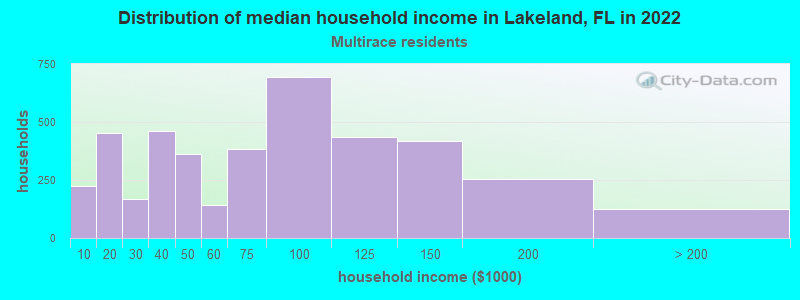
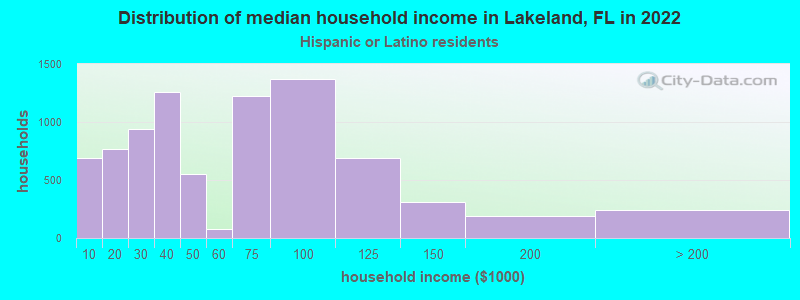
Income and house value in Lakeland Median household income in 2022 $60,412 White non-Hispanic householders$45,046 Black householders$93,030 Asian householders$61,304 Some other race householders$49,277 Two or more races householders$49,717 Hispanic or Latino race householdersMedian 2022 house value $329,045 White Non-Hispanic householders$214,412 Black or African American householders$348,086 American Indian or Alaska Native householders $337,423 Asian householders$221,267 Some other race householders$239,928 Two or more races householders$274,585 Hispanic or Latino householders
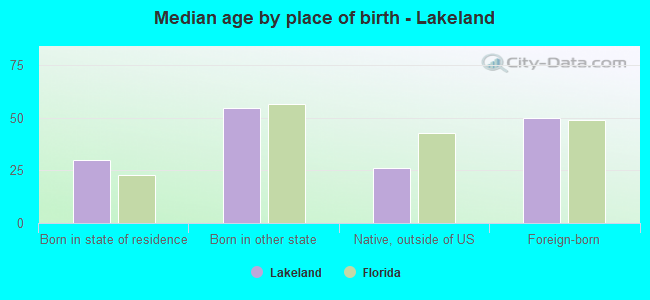
Median age by race in Lakeland
45.2 Median age for White residents44.2 46.4 34.6 Median age for Black or African American residents29.5 38.7 -666,666,666.0 Median age for American Indian / Alaska Native residents-666,666,666.0 -666,666,666.0 46.6 Median age for Asian residents46.1 51.3 -666,666,666.0 Median age for Native Hawaiian / Pacific Islander residents-666,666,666.0 -666,666,666.0 27.7 Median age for Other race residents27.2 27.9 32.1 Median age for Two or more races residents30.8 34.3 45.8 Median age for White alone residents44.8 46.9 30.8 Median age for Hispanic or Latino residents30.8 31.0
Owner/renter occupied households by race in Lakeland
House owners and renters - White residents 21,436 63.8% Owner occupied12,139 36.2% Renter occupiedHouse owners and renters - Black or African American residents 2,597 30.7% Owner occupied5,865 69.3% Renter occupiedHouse owners and renters - American Indian / Alaska Native residents 24 16.6% Owner occupied121 83.4% Renter occupiedHouse owners and renters - Asian residents 584 77.1% Owner occupied174 22.9% Renter occupiedHouse owners and renters - Other race residents 647 21.8% Owner occupied2,318 78.2% Renter occupiedHouse owners and renters - Two or more races residents 2,172 55.0% Owner occupied1,780 45.0% Renter occupiedHouse owners and renters - White alone residents 20,917 64.9% Owner occupied11,321 35.1% Renter occupiedHouse owners and renters - Hispanic or Latino residents 2,938 35.4% Owner occupied5,367 64.6% Renter occupied
Language usage in Lakeland
English speakers - Total 81.1% of residents of Lakeland speak English at home.
15.5% of residents speak Spanish at home 9,794 55.3% Speak English very well7,903 44.7% Speak English less than very well3.5% of residents speak other language at home 3,050 77.2% Speak English very well902 22.8% Speak English less than very well
English speakers - Born in the United States 93.6% of residents of Lakeland speak English at home.
5.0% of residents speak Spanish at home 1,979 84.8% Speak English very well355 15.2% Speak English less than very well1.3% of residents speak other language at home 579 92.8% Speak English very well45 7.2% Speak English less than very well
English speakers - Native, born elsewhere 18.1% of residents of Lakeland speak English at home.
79.2% of residents speak Spanish at home 2,683 51.6% Speak English very well2,520 48.4% Speak English less than very well2.7% of residents speak other language at home 176 100.0% Speak English very well
English speakers - Foreign-born 25.8% of residents of Lakeland speak English at home.
52.9% of residents speak Spanish at home 2,110 34.0% Speak English very well4,090 66.0% Speak English less than very well21.3% of residents speak other language at home 1,643 65.7% Speak English very well857 34.3% Speak English less than very well
White (Caucasian) - Speak only English Native:
95.3% (66,406)Foreign-born:
48.5% (1,405)
White (Caucasian) - Speak another language Native:
4.7% (3,293)Foreign-born:
51.5% (1,493)
Black or African American - Speak only English Native:
97.3% (19,001)Foreign-born:
41.9% (1,019)
Black or African American - Speak another language Native:
2.8% (539)Foreign-born:
57.3% (1,394)
American Indian / Alaska Native - Speak only English Native:
63.3% (290)Foreign-born:
61.4% (44)
Asian - Speak another language Native:
52.8% (372)Foreign-born:
100.0% (1,366)
Other race - Speak only English Native:
18.9% (835)Foreign-born:
5.2% (170)
Other race - Speak another language Native:
81.1% (3,582)Foreign-born:
94.8% (3,096)
Two or more races - Speak only English Native:
46.1% (3,827)Foreign-born:
12.1% (326)
Two or more races - Speak another language Native:
53.9% (4,479)Foreign-born:
87.9% (2,372)
White alone - Speak only English Native:
97.5% (65,510)Foreign-born:
74.8% (1,405)
White alone - Speak another language Native:
2.5% (1,652)Foreign-born:
25.2% (473)
Hispanic or Latino - Speak only English Native:
28.2% (3,959)Foreign-born:
3.3% (213)
Hispanic or Latino - Speak another language Native:
71.8% (10,096)Foreign-born:
96.7% (6,200)
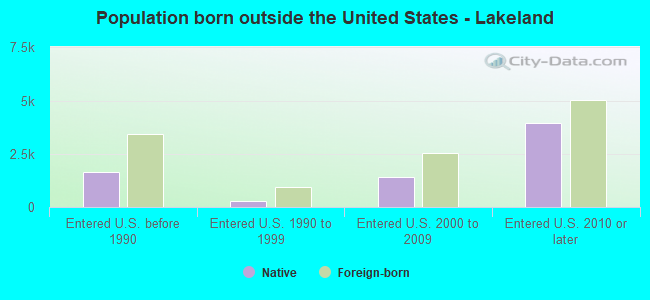
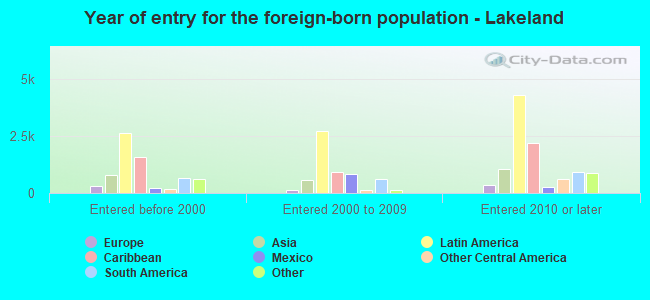
Foreign-born residents in Lakeland 12,391 residents are foreign born (6.7% Latin America , 1.7% Asia ).
This city:
10.1%Florida:
21.1%
Marital status for residents in Lakeland Marital status - White (Caucasian) population 15 years and over
Males 37.2% Never married42.7% Now married1.4% Separated4.2% Widowed14.4% DivorcedFemales 32.4% Never married40.0% Now married0.0% Separated11.5% Widowed16.1% DivorcedWomen who gave birth in the past 12 months Now married:
77.5% (423)Unmarried:
22.5% (123)
Women who did not give birth in the past 12 months Now married:
37.5% (6,135)Unmarried:
62.5% (10,240)
Marital status - Black or African American population 15 years and over
Males 32.0% Never married49.3% Now married0.6% Separated2.4% Widowed15.7% DivorcedFemales 39.2% Never married35.3% Now married1.2% Separated6.6% Widowed17.7% DivorcedWomen who gave birth in the past 12 months Now married:
6.9% (13)Unmarried:
93.1% (179)
Women who did not give birth in the past 12 months Now married:
24.7% (1,543)Unmarried:
75.3% (4,712)
Marital status - American Indian / Alaska Native population 15 years and over
Males 60.0% Never married40.0% Now married0.0% Separated0.0% Widowed0.0% DivorcedFemales 48.4% Never married37.9% Now married0.0% Separated9.5% Widowed4.2% DivorcedWomen who did not give birth in the past 12 months Now married:
32.4% (39)Unmarried:
67.6% (82)
Marital status - Asian population 15 years and over
Males 41.9% Never married55.3% Now married0.0% Separated0.0% Widowed2.8% DivorcedFemales 21.3% Never married58.9% Now married1.5% Separated16.6% Widowed1.7% DivorcedWomen who gave birth in the past 12 months Now married:
100.0% (35)Unmarried:
0.0% (0)
Women who did not give birth in the past 12 months Now married:
60.8% (414)Unmarried:
39.2% (267)
Marital status - Native Hawaiian / Pacific Islander population 15 years and over
Males 100.0% Never married0.0% Now married0.0% Separated0.0% Widowed0.0% DivorcedFemales 100.0% Never married0.0% Now married0.0% Separated0.0% Widowed0.0% DivorcedWomen who did not give birth in the past 12 months Now married:
0.0% (0)Unmarried:
100.0% (15)
Marital status - Other race population 15 years and over
Males 35.5% Never married47.7% Now married0.0% Separated0.0% Widowed16.8% DivorcedFemales 25.3% Never married59.2% Now married0.0% Separated10.5% Widowed5.0% DivorcedWomen who gave birth in the past 12 months Now married:
100.0% (65)Unmarried:
0.0% (0)
Women who did not give birth in the past 12 months Now married:
51.1% (1,492)Unmarried:
48.9% (1,428)
Marital status - Two or more races population 15 years and over
Males 32.4% Never married50.8% Now married3.3% Separated2.6% Widowed11.0% DivorcedFemales 45.2% Never married34.7% Now married6.5% Separated4.6% Widowed9.0% DivorcedWomen who gave birth in the past 12 months Now married:
50.0% (16)Unmarried:
50.0% (16)
Women who did not give birth in the past 12 months Now married:
40.4% (1,368)Unmarried:
59.6% (2,014)
Marital status - White alone, not Hispanic / Latino population 15 years and over
Males 36.0% Never married44.2% Now married1.5% Separated4.2% Widowed14.1% DivorcedFemales 32.0% Never married40.6% Now married0.1% Separated11.7% Widowed15.6% DivorcedWomen who gave birth in the past 12 months Now married:
77.5% (423)Unmarried:
22.5% (123)
Women who did not give birth in the past 12 months Now married:
38.0% (5,835)Unmarried:
62.0% (9,522)
Marital status - Hispanic or Latino population 15 years and over
Males 41.2% Never married40.9% Now married0.0% Separated2.3% Widowed15.6% DivorcedFemales 40.6% Never married37.9% Now married3.4% Separated7.0% Widowed11.1% DivorcedWomen who gave birth in the past 12 months Now married:
52.4% (102)Unmarried:
47.6% (93)
Women who did not give birth in the past 12 months Now married:
44.0% (2,855)Unmarried:
56.0% (3,638)
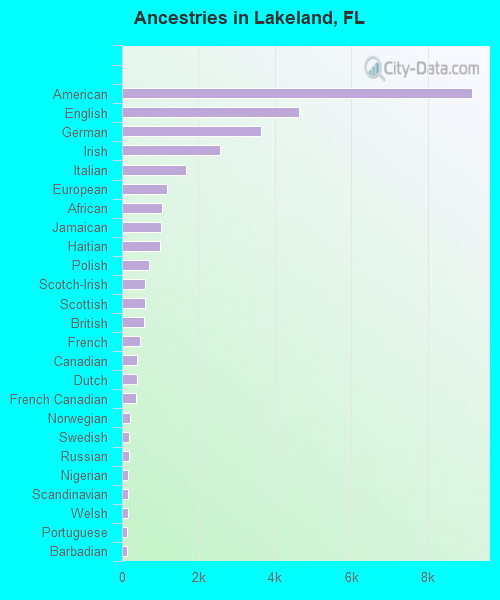
Ancestries in Lakeland
9,146 14.7% American4,637 7.4% English3,639 5.8% German2,571 4.1% Irish1,664 2.7% Italian1,188 1.9% European1,055 1.7% African1,032 1.7% Jamaican989 1.6% Haitian696 1.1% Polish591 0.9% Scotch-Irish591 0.9% Scottish585 0.9% British483 0.8% French390 0.6% Canadian389 0.6% Dutch379 0.6% French Canadian222 0.4% Norwegian194 0.3% Swedish179 0.3% Russian164 0.3% Nigerian160 0.3% Scandinavian151 0.2% Welsh143 0.2% Portuguese122 0.2% Barbadian117 0.2% Greek116 0.2% Arab100 0.2% Belizean97 0.2% Czech82 0.1% Hungarian80 0.1% Turkish68 0.1% Swiss67 0.1% British West Indian59 0.09% Brazilian51 0.08% Lebanese47 0.08% Romanian45 0.07% Moroccan44 0.07% Austrian43 0.07% Slavic40 0.06% Eastern European36 0.06% Guyanese32 0.05% Danish29 0.05% Finnish28 0.04% Northern European20 0.03% Cape Verdean19 0.03% Croatian17 0.03% Czechoslovakian16 0.03% Slovak16 0.03% Icelander16 0.03% Trinidadian and Tobagonian13 0.02% Slovene13 0.02% West Indian11 0.02% New Zealander10 0.02% Iranian10 0.02% South African9 0.01% Lithuanian9 0.01% Ukrainian9 0.01% Bahamian8 0.01% Celtic8 0.01% Syrian6 0.01% Pennsylvania German6 0.01% Albanian
Geographical mobility in Lakeland Same house 1 year ago 58,840 79.1% White (Caucasian)16,827 76.5% Black or African American604 100.0% American Indian / Alaska Native2,437 91.7% Asian19 18.1% Native Hawaiian / Pacific Islander7,321 66.4% Other race10,096 86.8% Two or more races56,449 79.7% White alone, not Hispanic / Latino15,890 71.9% Hispanic or LatinoMoved within same county 6,913 9.3% White / Caucasian1,733 7.9% Black or African American17 0.6% Asian2,033 18.4% Other race943 8.1% Two or more races6,616 9.3% White alone, not Hispanic / Latino2,650 12.0% Hispanic or LatinoMoved within same state 4,467 6.0% White / Caucasian2,384 10.8% Black or African American1 0.2% American Indian / Alaska Native81 3.1% Asian385 3.5% Other race321 2.8% Two or more races4,054 5.7% White alone, not Hispanic / Latino1,676 7.6% Hispanic or LatinoMoved from different state 3,007 4.0% White / Caucasian1,053 4.8% Black or African American93 3.5% Asian41 38.7% Native Hawaiian / Pacific Islander644 5.8% Other race270 2.3% Two or more races2,551 3.6% White alone, not Hispanic / Latino1,437 6.5% Hispanic or LatinoMoved from abroad 1,144 1.5% White54 2.0% Asian146 100.0% Native Hawaiian / Pacific Islander377 3.4% Other race1,144 1.6% White alone, not Hispanic / Latino461 2.1% Hispanic or Latino
Children Nativity (place of birth) in Lakeland
Children under 6 years - Living with two parents Both parents native 2,977 100.0% NativeBoth parents foreign-born 462 83.9% Native89 16.1% Foreign-bornOne native, one foreign-born parent 573 100.0% NativeChildren under 6 years - Living with one parent Native parent 2,446 100.0% NativeForeign-born parent 238 85.8% Native39 14.2% Foreign-bornChildren 6 to 17 years - Living with two parents Both parents native 6,164 99.8% Native15 0.2% Foreign-bornBoth parents foreign-born 1,118 74.8% Native376 25.2% Foreign-bornOne native, one foreign-born parent 783 92.9% Native59 7.1% Foreign-bornChildren 6 to 17 years - Living with one parent Native parent 5,845 100.0% NativeForeign-born parent 411 52.0% Native379 48.0% Foreign-born
Grandparents responsible for own grandchildren in Lakeland
Grandparents (30 to 59 years) White / Caucasian 94 53.0% Responsible for grandchildren83 47.0% Not responsible for grandchildrenBlack or African American 93 80.8% Responsible for grandchildren22 19.2% Not responsible for grandchildrenAsian 4 100.0% Not responsible for grandchildrenTwo or more races 78 100.0% Responsible for grandchildrenWhite alone, not Hispanic / Latino 101 53.2% Responsible for grandchildren89 46.8% Not responsible for grandchildrenHispanic or Latino 48 46.9% Responsible for grandchildren54 53.1% Not responsible for grandchildrenGrandparents (60 years and over) White / Caucasian 217 22.7% Responsible for grandchildren738 77.3% Not responsible for grandchildrenBlack or African American 92 23.1% Responsible for grandchildren307 76.9% Not responsible for grandchildrenAsian 75 100.0% Not responsible for grandchildrenTwo or more races 21 100.0% Not responsible for grandchildrenWhite alone, not Hispanic / Latino 236 23.8% Responsible for grandchildren758 76.2% Not responsible for grandchildrenHispanic or Latino 66 24.8% Responsible for grandchildren200 75.2% Not responsible for grandchildren