Races in Lakes of the Four Seasons, Indiana (IN) Detailed Stats
Data:
Races - White alone (%)
Races - White alone (% change since 2000)
Races - Black alone (%)
Races - Black alone (% change since 2000)
Races - American Indian alone (%)
Races - American Indian alone (% change since 2000)
Races - Asian alone (%)
Races - Asian alone (% change since 2000)
Races - Hispanic (%)
Races - Hispanic (% change since 2000)
Races - Native Hawaiian and Other Pacific Islander alone (%)
Races - Native Hawaiian and Other Pacific Islander alone (% change since 2000)
Races - Two or more races(%)
Races - Two or more races(% change since 2000)
Races - Other race alone (%)
Races - Other race alone (% change since 2000)
Racial diversity
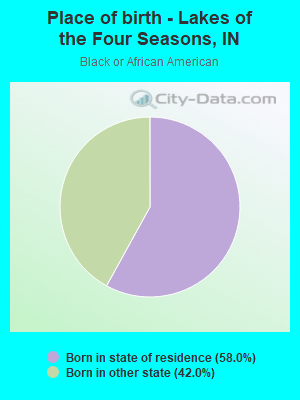
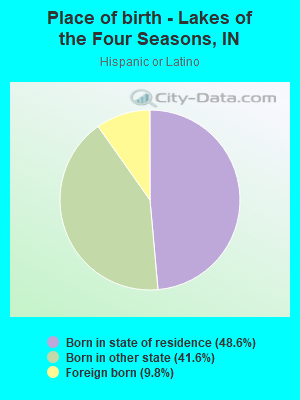
Place of birth - Born in state of residence (%)
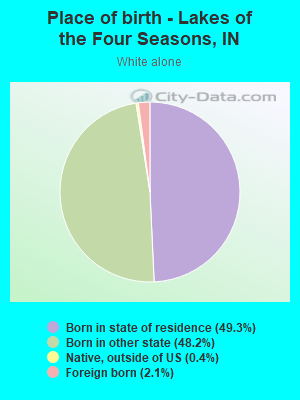
Place of birth - Born in state of residence (%) - White
Place of birth - Born in state of residence (%) - Black or African American
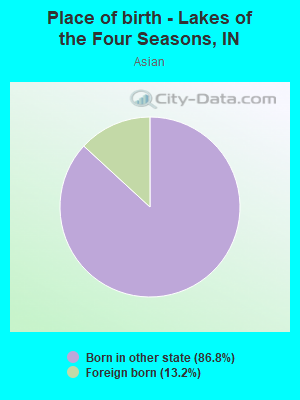
Place of birth - Born in state of residence (%) - Asian
Place of birth - Born in state of residence (%) - Hispanic or Latino
Place of birth - Born in state of residence (%) - American Indian and Alaska Native
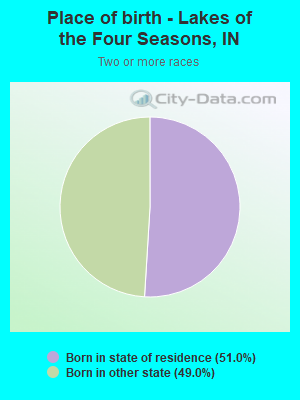
Place of birth - Born in state of residence (%) - Multirace
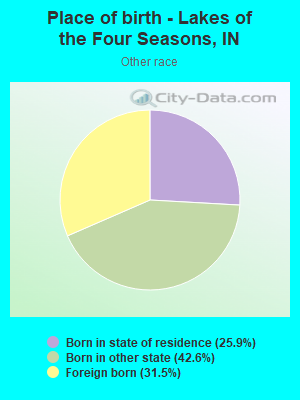
Place of birth - Born in state of residence (%) - Other Race
Place of birth - Born in other state (%)
Place of birth - Born in other state (%) - White
Place of birth - Born in other state (%) - Black or African American
Place of birth - Born in other state (%) - Asian
Place of birth - Born in other state (%) - Hispanic or Latino
Place of birth - Born in other state (%) - American Indian and Alaska Native
Place of birth - Born in other state (%) - Multirace
Place of birth - Born in other state (%) - Other Race
Place of birth - Native, outside of US (%)
Place of birth - Native, outside of US (%) - White
Place of birth - Native, outside of US (%) - Black or African American
Place of birth - Native, outside of US (%) - Asian
Place of birth - Native, outside of US (%) - Hispanic or Latino
Place of birth - Native, outside of US (%) - American Indian and Alaska Native
Place of birth - Native, outside of US (%) - Multirace
Place of birth - Native, outside of US (%) - Other Race
Place of birth - Foreign born (%)
Place of birth - Foreign born (%) - White
Place of birth - Foreign born (%) - Black or African American
Place of birth - Foreign born (%) - Asian
Place of birth - Foreign born (%) - Hispanic or Latino
Place of birth - Foreign born (%) - American Indian and Alaska Native
Place of birth - Foreign born (%) - Multirace
Place of birth - Foreign born (%) - Other Race
Residents speaking English at home (%)
Residents speaking English at home - Born in the United States (%)
Residents speaking English at home - Native, born elsewhere (%)
Residents speaking English at home - Foreign born (%)
Residents speaking Spanish at home (%)
Residents speaking Spanish at home - Born in the United States (%)
Residents speaking Spanish at home - Native, born elsewhere (%)
Residents speaking Spanish at home - Foreign born (%)
Residents speaking other language at home (%)
Residents speaking other language at home - Born in the United States (%)
Residents speaking other language at home - Native, born elsewhere (%)
Residents speaking other language at home - Foreign born (%)
Marital status - Never married (%)
Marital status - Now married (%)
Marital status - Separated (%)
Marital status - Widowed (%)
Marital status - Divorced (%)
Ancestries Reported - Arab (%)
Ancestries Reported - Czech (%)
Ancestries Reported - Danish (%)
Ancestries Reported - Dutch (%)
Ancestries Reported - English (%)
Ancestries Reported - French (%)
Ancestries Reported - French Canadian (%)
Ancestries Reported - German (%)
Ancestries Reported - Greek (%)
Ancestries Reported - Hungarian (%)
Ancestries Reported - Irish (%)
Ancestries Reported - Italian (%)
Ancestries Reported - Lithuanian (%)
Ancestries Reported - Norwegian (%)
Ancestries Reported - Polish (%)
Ancestries Reported - Portuguese (%)
Ancestries Reported - Russian (%)
Ancestries Reported - Scotch-Irish (%)
Ancestries Reported - Scottish (%)
Ancestries Reported - Slovak (%)
Ancestries Reported - Subsaharan African (%)
Ancestries Reported - Swedish (%)
Ancestries Reported - Swiss (%)
Ancestries Reported - Ukrainian (%)
Ancestries Reported - United States (%)
Ancestries Reported - Welsh (%)
Ancestries Reported - West Indian (%)
Ancestries Reported - Other (%)
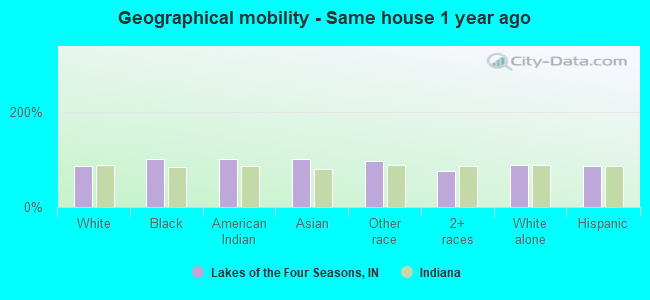
Geographical mobility - Same house 1 year ago (%)
Geographical mobility - Same house 1 year ago (%) - White
Geographical mobility - Same house 1 year ago (%) - Black or African American
Geographical mobility - Same house 1 year ago (%) - Asian
Geographical mobility - Same house 1 year ago (%) - Hispanic or Latino
Geographical mobility - Same house 1 year ago (%) - American Indian and Alaska Native
Geographical mobility - Same house 1 year ago (%) - Multirace
Geographical mobility - Same house 1 year ago (%) - Other Race
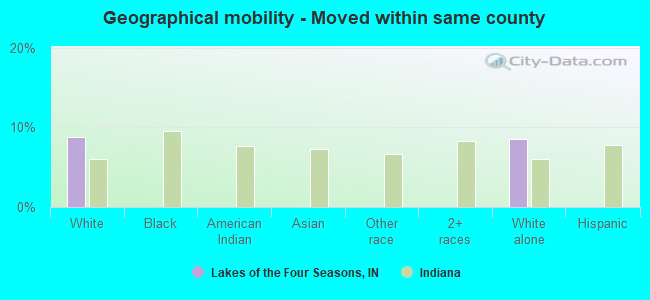
Geographical mobility - Moved within same county (%)
Geographical mobility - Moved within same county (%) - White
Geographical mobility - Moved within same county (%) - Black or African American
Geographical mobility - Moved within same county (%) - Asian
Geographical mobility - Moved within same county (%) - Hispanic or Latino
Geographical mobility - Moved within same county (%) - American Indian and Alaska Native
Geographical mobility - Moved within same county (%) - Multirace
Geographical mobility - Moved within same county (%) - Other Race
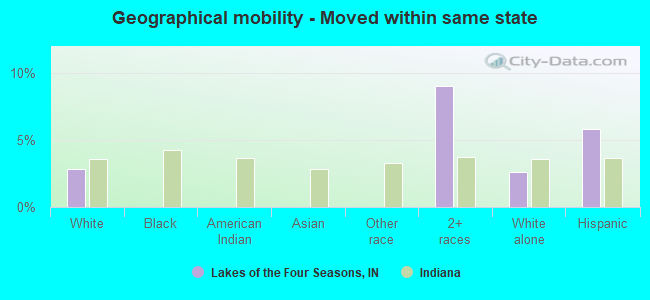
Geographical mobility - Moved from different county within same state (%)
Geographical mobility - Moved from different county within same state (%) - White
Geographical mobility - Moved from different county within same state (%) - Black or African American
Geographical mobility - Moved from different county within same state (%) - Asian
Geographical mobility - Moved from different county within same state (%) - Hispanic or Latino
Geographical mobility - Moved from different county within same state (%) - American Indian and Alaska Native
Geographical mobility - Moved from different county within same state (%) - Multirace
Geographical mobility - Moved from different county within same state (%) - Other Race
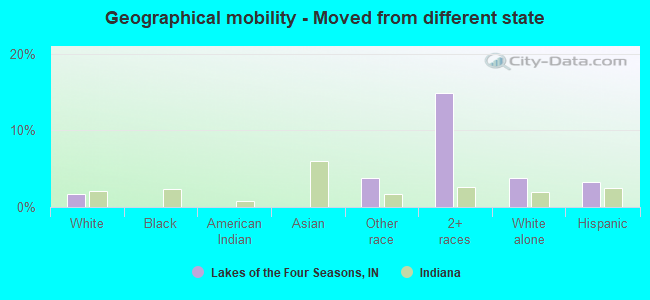
Geographical mobility - Moved from different state (%)
Geographical mobility - Moved from different state (%) - White
Geographical mobility - Moved from different state (%) - Black or African American
Geographical mobility - Moved from different state (%) - Asian
Geographical mobility - Moved from different state (%) - Hispanic or Latino
Geographical mobility - Moved from different state (%) - American Indian and Alaska Native
Geographical mobility - Moved from different state (%) - Multirace
Geographical mobility - Moved from different state (%) - Other Race
Geographical mobility - Moved from abroad (%)
Geographical mobility - Moved from abroad (%) - White
Geographical mobility - Moved from abroad (%) - Black or African American
Geographical mobility - Moved from abroad (%) - Asian
Geographical mobility - Moved from abroad (%) - Hispanic or Latino
Geographical mobility - Moved from abroad (%) - American Indian and Alaska Native
Geographical mobility - Moved from abroad (%) - Multirace
Geographical mobility - Moved from abroad (%) - Other Race
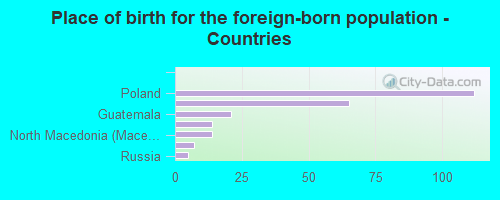
Place of birth for the foreign-born population - Ireland (%)
Place of birth for the foreign-born population - Denmark (%)
Place of birth for the foreign-born population - Norway (%)
Place of birth for the foreign-born population - Sweden (%)
Place of birth for the foreign-born population - United Kingdom (%)
Place of birth for the foreign-born population - England (%)
Place of birth for the foreign-born population - Scotland (%)
Place of birth for the foreign-born population - Other Northern Europe (%)
Place of birth for the foreign-born population - Austria (%)
Place of birth for the foreign-born population - Belgium (%)
Place of birth for the foreign-born population - France (%)
Place of birth for the foreign-born population - Germany (%)
Place of birth for the foreign-born population - Netherlands (%)
Place of birth for the foreign-born population - Switzerland (%)
Place of birth for the foreign-born population - Other Western Europe (%)
Place of birth for the foreign-born population - Greece (%)
Place of birth for the foreign-born population - Italy (%)
Place of birth for the foreign-born population - Portugal (%)
Place of birth for the foreign-born population - Spain (%)
Place of birth for the foreign-born population - Other Southern Europe (%)
Place of birth for the foreign-born population - Albania (%)
Place of birth for the foreign-born population - Belarus (%)
Place of birth for the foreign-born population - Bosnia and Herzegovina (%)
Place of birth for the foreign-born population - Bulgaria (%)
Place of birth for the foreign-born population - Croatia (%)
Place of birth for the foreign-born population - Czechoslovakia (%)
Place of birth for the foreign-born population - Hungary (%)
Place of birth for the foreign-born population - Latvia (%)
Place of birth for the foreign-born population - Lithuania (%)
Place of birth for the foreign-born population - North Macedonia (Macedonia) (%)
Place of birth for the foreign-born population - Moldova (%)
Place of birth for the foreign-born population - Poland (%)
Place of birth for the foreign-born population - Romania (%)
Place of birth for the foreign-born population - Russia (%)
Place of birth for the foreign-born population - Serbia (%)
Place of birth for the foreign-born population - Ukraine (%)
Place of birth for the foreign-born population - Other Eastern Europe (%)
Place of birth for the foreign-born population - China (%)
Place of birth for the foreign-born population - Hong Kong (%)
Place of birth for the foreign-born population - Taiwan (%)
Place of birth for the foreign-born population - Japan (%)
Place of birth for the foreign-born population - Korea (%)
Place of birth for the foreign-born population - Other Eastern Asia (%)
Place of birth for the foreign-born population - Afghanistan (%)
Place of birth for the foreign-born population - Bangladesh (%)
Place of birth for the foreign-born population - India (%)
Place of birth for the foreign-born population - Iran (%)
Place of birth for the foreign-born population - Kazakhstan (%)
Place of birth for the foreign-born population - Nepal (%)
Place of birth for the foreign-born population - Pakistan (%)
Place of birth for the foreign-born population - Sri Lanka (%)
Place of birth for the foreign-born population - Uzbekistan (%)
Place of birth for the foreign-born population - Other South Central Asia (%)
Place of birth for the foreign-born population - Burma (%)
Place of birth for the foreign-born population - Cambodia (%)
Place of birth for the foreign-born population - Indonesia (%)
Place of birth for the foreign-born population - Laos (%)
Place of birth for the foreign-born population - Malaysia (%)
Place of birth for the foreign-born population - Philippines (%)
Place of birth for the foreign-born population - Singapore (%)
Place of birth for the foreign-born population - Thailand (%)
Place of birth for the foreign-born population - Vietnam (%)
Place of birth for the foreign-born population - Other South Eastern Asia (%)
Place of birth for the foreign-born population - Armenia (%)
Place of birth for the foreign-born population - Iraq (%)
Place of birth for the foreign-born population - Israel (%)
Place of birth for the foreign-born population - Jordan (%)
Place of birth for the foreign-born population - Kuwait (%)
Place of birth for the foreign-born population - Lebanon (%)
Place of birth for the foreign-born population - Saudi Arabia (%)
Place of birth for the foreign-born population - Syria (%)
Place of birth for the foreign-born population - Turkey (%)
Place of birth for the foreign-born population - Yemen (%)
Place of birth for the foreign-born population - Other Western Asia (%)
Place of birth for the foreign-born population - Eritrea (%)
Place of birth for the foreign-born population - Ethiopia (%)
Place of birth for the foreign-born population - Kenya (%)
Place of birth for the foreign-born population - Somalia (%)
Place of birth for the foreign-born population - Uganda (%)
Place of birth for the foreign-born population - Zimbabwe (%)
Place of birth for the foreign-born population - Other Eastern Africa (%)
Place of birth for the foreign-born population - Cameroon (%)
Place of birth for the foreign-born population - Congo (%)
Place of birth for the foreign-born population - Democratic Republic of Congo (Zaire) (%)
Place of birth for the foreign-born population - Other Middle Africa (%)
Place of birth for the foreign-born population - Egypt (%)
Place of birth for the foreign-born population - Morocco (%)
Place of birth for the foreign-born population - Sudan (%)
Place of birth for the foreign-born population - Other Northern Africa (%)
Place of birth for the foreign-born population - South Africa (%)
Place of birth for the foreign-born population - Other Southern Africa (%)
Place of birth for the foreign-born population - Cabo Verde (%)
Place of birth for the foreign-born population - Ghana (%)
Place of birth for the foreign-born population - Liberia (%)
Place of birth for the foreign-born population - Nigeria (%)
Place of birth for the foreign-born population - Senegal (%)
Place of birth for the foreign-born population - Sierra Leone (%)
Place of birth for the foreign-born population - Other Western Africa (%)
Place of birth for the foreign-born population - Australia (%)
Place of birth for the foreign-born population - New Zealand (%)
Place of birth for the foreign-born population - Fiji (%)
Place of birth for the foreign-born population - Micronesia (%)
Place of birth for the foreign-born population - Bahamas (%)
Place of birth for the foreign-born population - Barbados (%)
Place of birth for the foreign-born population - Cuba (%)
Place of birth for the foreign-born population - Dominica (%)
Place of birth for the foreign-born population - Dominican Republic (%)
Place of birth for the foreign-born population - Grenada (%)
Place of birth for the foreign-born population - Haiti (%)
Place of birth for the foreign-born population - Jamaica (%)
Place of birth for the foreign-born population - St. Vincent and the Grenadines (%)
Place of birth for the foreign-born population - Trinidad and Tobago (%)
Place of birth for the foreign-born population - West Indies (%)
Place of birth for the foreign-born population - Other Caribbean (%)
Place of birth for the foreign-born population - Belize (%)
Place of birth for the foreign-born population - Costa Rica (%)
Place of birth for the foreign-born population - El Salvador (%)
Place of birth for the foreign-born population - Guatemala (%)
Place of birth for the foreign-born population - Honduras (%)
Place of birth for the foreign-born population - Mexico (%)
Place of birth for the foreign-born population - Nicaragua (%)
Place of birth for the foreign-born population - Panama (%)
Place of birth for the foreign-born population - Other Central America (%)
Place of birth for the foreign-born population - Argentina (%)
Place of birth for the foreign-born population - Bolivia (%)
Place of birth for the foreign-born population - Brazil (%)
Place of birth for the foreign-born population - Chile (%)
Place of birth for the foreign-born population - Colombia (%)
Place of birth for the foreign-born population - Ecuador (%)
Place of birth for the foreign-born population - Guyana (%)
Place of birth for the foreign-born population - Peru (%)
Place of birth for the foreign-born population - Uruguay (%)
Place of birth for the foreign-born population - Venezuela (%)
Place of birth for the foreign-born population - Other South America (%)
Place of birth for the foreign-born population - Canada (%)
Place of birth for the foreign-born population - Other Northern America (%)
Place of birth for the foreign-born population - Other (%)
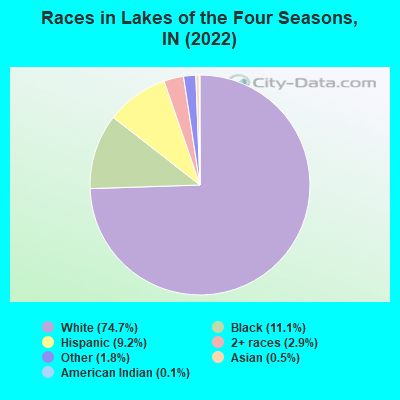
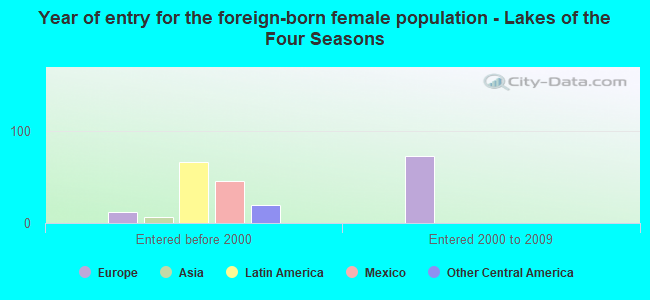
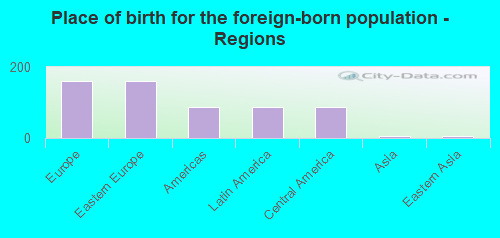
According to 2022 data, the most numerous races in Lakes of the Four Seasons, IN are White alone (5,719 residents), Black alone (853 residents), and Hispanic (706 residents). 92.7% of Lakes of the Four Seasons residents speak English at home. 3.3% of Lakes of the Four Seasons, IN residents are foreign-born (1.9% born in Europe, 1.0% born in Latin America), which is 79.3% less than the foreign-born rate of 6.0% across the entire state of Indiana.
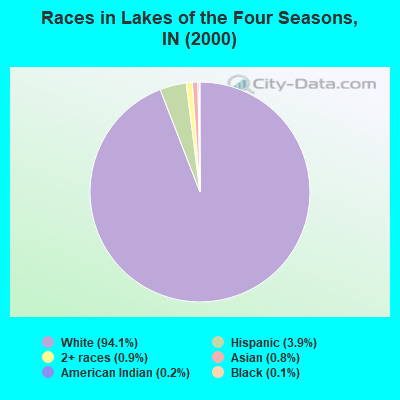
Race distribution in Lakes of the Four Seasons
2000 2022
5,219,373 85.8% White alone 505,462 8.3% Black alone 214,536 3.5% Hispanic 61,115 1.0% Two or more races 58,424 1.0% Asian alone 13,654 0.2% American Indian alone 6,348 0.1% Other race alone 1,573 0.03% Native Hawaiian and Other
5,192,455 76.0% White alone 628,054 9.2% Black alone 534,528 7.8% Hispanic 263,242 3.9% Two or more races 172,880 2.5% Asian alone 33,467 0.5% Other race alone 5,866 0.09% American Indian alone 2,545 0.04% Native Hawaiian and Other
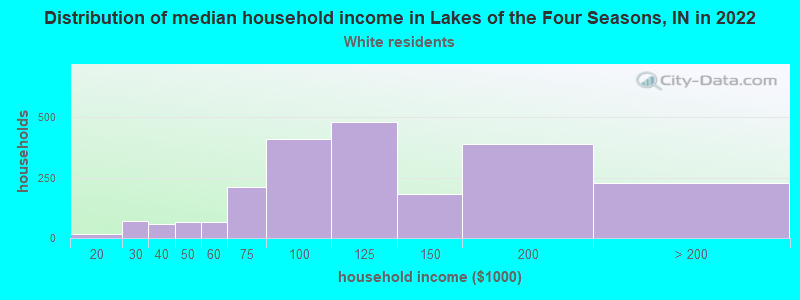
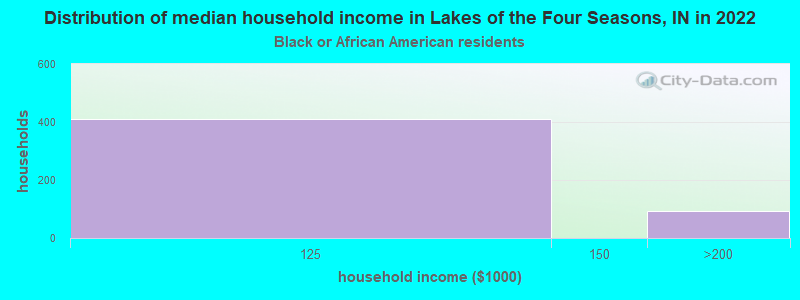
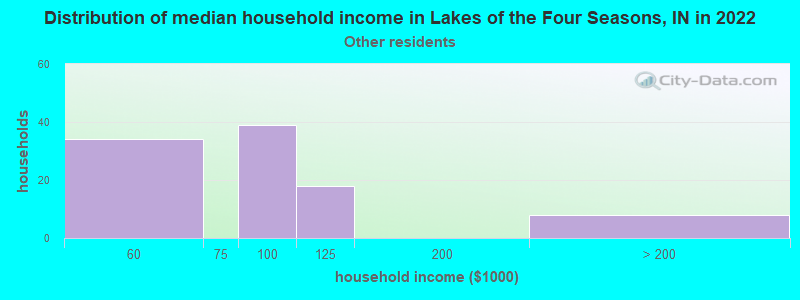
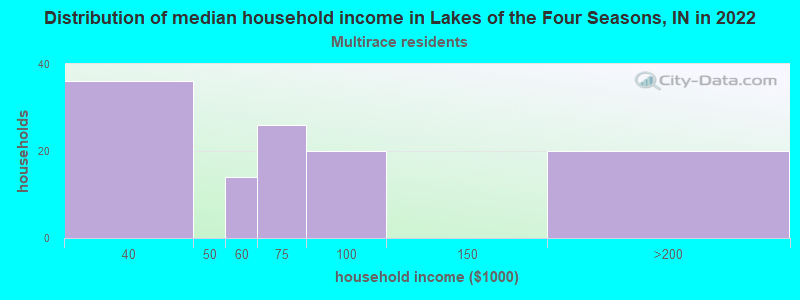
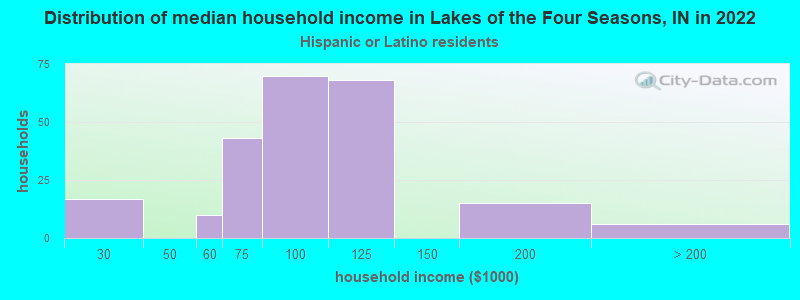
Income and house value in Lakes of the Four Seasons Median household income in 2022 $109,857 White non-Hispanic householders$79,700 Some other race householders$111,760 Hispanic or Latino race householdersMedian 2022 house value $315,042 White Non-Hispanic householders $578,021 Asian householders$249,242 Some other race householders$276,936 Two or more races householders$304,630 Hispanic or Latino householders
Median age by race in Lakes of the Four Seasons
43.3 Median age for White residents42.4 43.3 38.7 Median age for Black or African American residents37.7 -666,666,666.0 -721,439,748.9 Median age for American Indian / Alaska Native residents-654,255,318.5 -734,751,772.3 3.1 Median age for Asian residents-806,484,295.0 2.4 -666,666,666.0 Median age for Native Hawaiian / Pacific Islander residents-666,666,666.0 -666,666,666.0 45.8 Median age for Other race residents41.7 54.8 35.1 Median age for Two or more races residents23.2 38.1 42.6 Median age for White alone residents42.2 42.7 25.1 Median age for Hispanic or Latino residents19.1 35.5
Owner/renter occupied households by race in Lakes of the Four Seasons
House owners and renters - White residents 2,118 96.0% Owner occupied88 4.0% Renter occupiedHouse owners and renters - Black or African American residents 271 100.0% Owner occupiedHouse owners and renters - Other race residents 146 100.0% Owner occupiedHouse owners and renters - Two or more races residents 77 67.2% Owner occupied38 32.8% Renter occupiedHouse owners and renters - White alone residents 1,998 95.6% Owner occupied92 4.4% Renter occupiedHouse owners and renters - Hispanic or Latino residents 222 90.8% Owner occupied22 9.2% Renter occupied
Language usage in Lakes of the Four Seasons
English speakers - Total 92.7% of residents of Lakes of the Four Seasons speak English at home.
3.6% of residents speak Spanish at home 227 86.0% Speak English very well37 14.0% Speak English less than very well3.1% of residents speak other language at home 228 100.0% Speak English very well
English speakers - Born in the United States 90.9% of residents of Lakes of the Four Seasons speak English at home.
4.3% of residents speak Spanish at home 153 100.0% Speak English very well4.7% of residents speak other language at home 167 100.0% Speak English very well
English speakers - Native, born elsewhere 73.3% of residents of Lakes of the Four Seasons speak English at home.
English speakers - Foreign-born 13.5% of residents of Lakes of the Four Seasons speak English at home.
34.4% of residents speak Spanish at home 43 58.1% Speak English very well31 41.9% Speak English less than very well51.2% of residents speak other language at home 110 100.0% Speak English very well
White (Caucasian) - Speak only English Native:
95.3% (5,204)Foreign-born:
24.5% (26)
White (Caucasian) - Speak another language Native:
5.0% (273)Foreign-born:
58.2% (62)
Asian - Speak only English Native:
100.0% (10)Foreign-born:
73.3% (5)
Other race - Speak another language Native:
10.9% (22)Foreign-born:
100.0% (94)
White alone - Speak only English Native:
96.4% (5,147)Foreign-born:
24.1% (28)
White alone - Speak another language Native:
3.1% (167)Foreign-born:
57.7% (67)
Hispanic or Latino - Speak another language Native:
17.3% (103)Foreign-born:
100.0% (68)
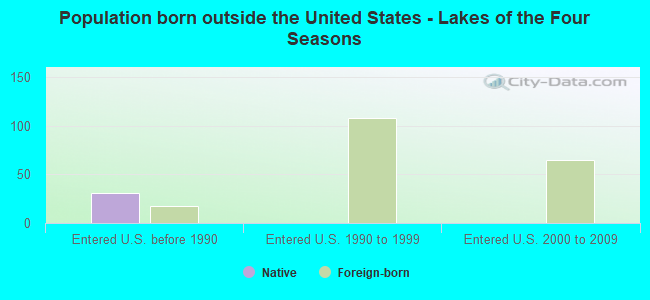
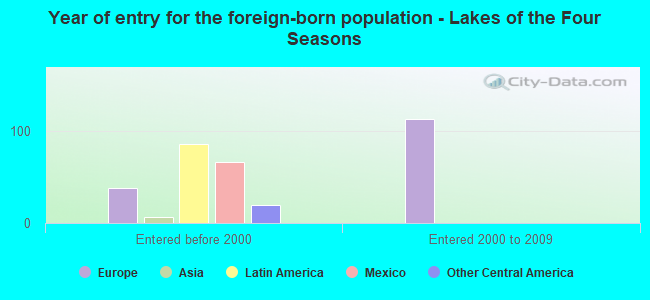
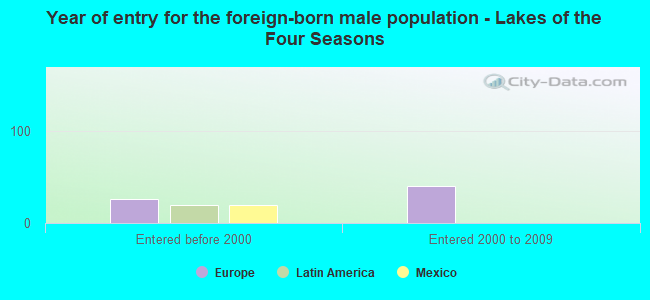
Foreign-born residents in Lakes of the Four Seasons 256 residents are foreign born (1.9% Europe , 1.0% Latin America ).
This city:
3.3%Indiana:
5.6%
Marital status for residents in Lakes of the Four Seasons Marital status - White (Caucasian) population 15 years and over
Males 26.5% Never married63.9% Now married0.0% Separated2.2% Widowed7.4% DivorcedFemales 29.5% Never married57.9% Now married0.0% Separated8.0% Widowed4.7% DivorcedWomen who gave birth in the past 12 months Now married:
100.0% (48)Unmarried:
0.0% (0)
Women who did not give birth in the past 12 months Now married:
44.2% (539)Unmarried:
55.8% (682)
Marital status - Black or African American population 15 years and over
Males 9.9% Never married72.9% Now married0.0% Separated0.0% Widowed17.2% DivorcedFemales 0.0% Never married100.0% Now married0.0% Separated0.0% Widowed0.0% DivorcedWomen who did not give birth in the past 12 months Now married:
100.0% (208)Unmarried:
0.0% (0)
Marital status - Other race population 15 years and over
Males 40.4% Never married59.6% Now married0.0% Separated0.0% Widowed0.0% DivorcedFemales 30.0% Never married70.0% Now married0.0% Separated0.0% Widowed0.0% DivorcedWomen who did not give birth in the past 12 months Now married:
54.3% (30)Unmarried:
45.7% (25)
Marital status - Two or more races population 15 years and over
Males 44.4% Never married49.5% Now married0.0% Separated0.0% Widowed6.1% DivorcedFemales 28.8% Never married54.6% Now married0.0% Separated0.0% Widowed16.6% DivorcedWomen who did not give birth in the past 12 months Now married:
41.6% (57)Unmarried:
58.4% (81)
Marital status - White alone, not Hispanic / Latino population 15 years and over
Males 24.4% Never married65.7% Now married0.0% Separated2.3% Widowed7.6% DivorcedFemales 30.5% Never married57.3% Now married0.0% Separated7.4% Widowed4.8% DivorcedWomen who gave birth in the past 12 months Now married:
100.0% (50)Unmarried:
0.0% (0)
Women who did not give birth in the past 12 months Now married:
42.9% (514)Unmarried:
57.1% (685)
Marital status - Hispanic or Latino population 15 years and over
Males 58.9% Never married41.1% Now married0.0% Separated0.0% Widowed0.0% DivorcedFemales 30.1% Never married55.8% Now married0.0% Separated8.8% Widowed5.3% DivorcedWomen who did not give birth in the past 12 months Now married:
51.7% (118)Unmarried:
48.3% (110)
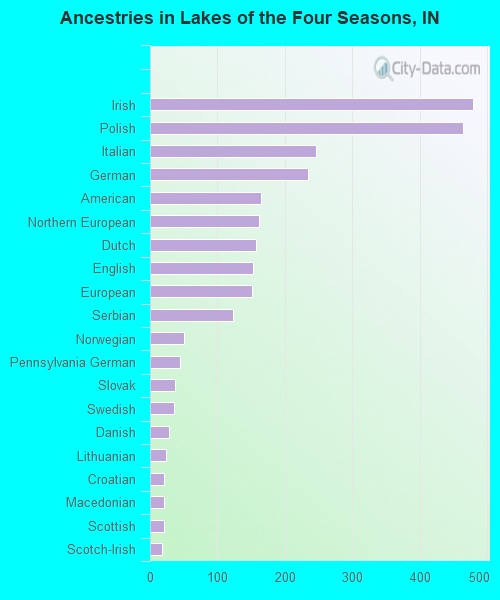
Ancestries in Lakes of the Four Seasons
479 12.1% Irish465 11.7% Polish247 6.2% Italian235 5.9% German165 4.2% American162 4.1% Northern European157 4.0% Dutch153 3.9% English152 3.8% European123 3.1% Serbian50 1.3% Norwegian45 1.1% Pennsylvania German37 0.9% Slovak35 0.9% Swedish28 0.7% Danish24 0.6% Lithuanian21 0.5% Croatian21 0.5% Macedonian21 0.5% Scottish18 0.5% Scotch-Irish
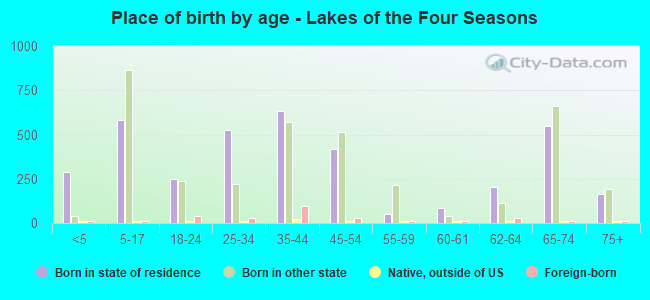
Children Nativity (place of birth) in Lakes of the Four Seasons
Children under 6 years - Living with two parents Both parents native 352 100.0% NativeChildren under 6 years - Living with one parent Native parent 43 100.0% NativeChildren 6 to 17 years - Living with two parents Both parents native 819 99.2% Native6 0.8% Foreign-bornBoth parents foreign-born 157 100.0% NativeOne native, one foreign-born parent 20 100.0% NativeChildren 6 to 17 years - Living with one parent Native parent 224 100.0% NativeForeign-born parent 39 52.0% Native36 48.0% Foreign-born
Grandparents responsible for own grandchildren in Lakes of the Four Seasons
Grandparents (30 to 59 years) White / Caucasian 28 71.9% Responsible for grandchildren11 28.1% Not responsible for grandchildrenWhite alone, not Hispanic / Latino 29 71.1% Responsible for grandchildren12 28.9% Not responsible for grandchildrenGrandparents (60 years and over) White / Caucasian 12 24.7% Responsible for grandchildren35 75.3% Not responsible for grandchildrenWhite alone, not Hispanic / Latino 12 24.9% Responsible for grandchildren36 75.1% Not responsible for grandchildren