Races in Lancaster Mill, South Carolina (SC) Detailed Stats
Ancestries, Foreign-born residents, place of birth

Discuss Lancaster Mill, South Carolina races on our local forum with over 2,400,000 registered users
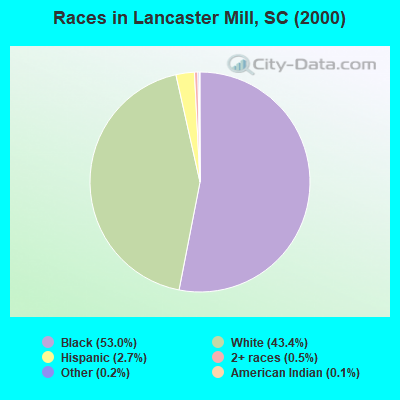
Race distribution in Lancaster Mill

- 1,11853.0%Black alone
- 91643.4%White alone
- 562.7%Hispanic
- 110.5%Two or more races
- 50.2%Other race alone
- 30.1%American Indian alone
2000
2022
-
- 2,652,29166.1%White alone
- 1,178,48629.4%Black alone
- 95,0762.4%Hispanic
- 35,5680.9%Asian alone
- 33,2900.8%Two or more races
- 12,7650.3%American Indian alone
- 3,2660.08%Other race alone
- 1,2700.03%Native Hawaiian and Other
Pacific Islander alone

-
- 3,301,73962.5%White alone
- 1,313,29024.9%Black alone
- 343,7836.5%Hispanic
- 190,5083.6%Two or more races
- 89,8881.7%Asian alone
- 29,3900.6%Other race alone
- 12,1120.2%American Indian alone
- 1,9240.04%Native Hawaiian and Other
Pacific Islander alone

Income and house value in Lancaster Mill
- Median household income in 2022
- $44,247White non-Hispanic householders
- $23,591Black householders
- Median 2022 house value
- $227,743White Non-Hispanic householders
- $88,541Black or African American householders
Household income for White non-Hispanic householders

Household income for Black householders

Ancestries in Lancaster Mill

- 55942.2%Other
- 55041.5%United States
- 503.8%English
- 463.5%German
- 433.2%Subsaharan African
- 392.9%Irish
- 251.9%Scotch-Irish
- 70.5%French
- 70.5%Welsh

Zip codes: 29720.