Races in Lancaster, South Carolina (SC) Detailed Stats
Ancestries, Foreign-born residents, place of birth
Settings
X


Recent posts about races in Lancaster, South Carolina on our local forum with over 2,400,000 registered users:
 | Indians in Walnut creek (3 replies) |
| CLT Flight Paths/Plane Noise over York/Lancaster Counties (share your experience) (41 replies) |
| Thinking of moving to town of Lancaster, SC (4 replies) |
| Why York County Is Following A Development Plan Worse Than CLT (2 replies) |
| Forgotten Lancaster (13 replies) |
| Relocating to York or Lancaster County, SC (2 replies) |
Latest news about races in Lancaster, SC collected exclusively by city-data.com from local newspapers, TV, and radio stations
According to 2022 data, the most numerous races in Lancaster, SC are White alone (2,996 residents), Black alone (4,658 residents), and Hispanic (1,088 residents). 85.0% of Lancaster residents speak English at home. 6.9% of Lancaster, SC residents are foreign-born (4.6% born in Latin America, 2.0% born in Asia), which is 27.2% greater than the foreign-born rate of 5.0% across the entire state of South Carolina.
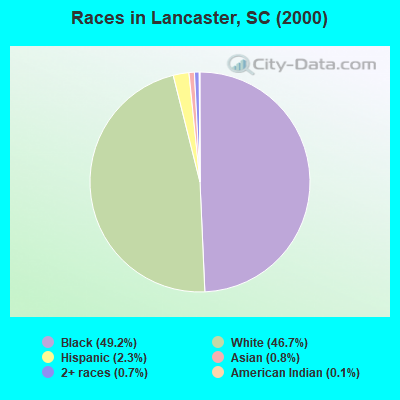
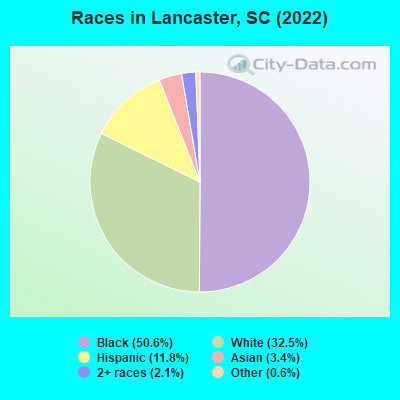
Race distribution in Lancaster
2000
2022

- 4,02549.2%Black alone
- 3,82246.7%White alone
- 1842.3%Hispanic
- 680.8%Asian alone
- 600.7%Two or more races
- 90.1%American Indian alone
- 70.09%Other race alone
- 20.02%Native Hawaiian and Other
Pacific Islander alone
-
- 4,65850.6%Black alone
- 2,99632.5%White alone
- 1,08811.8%Hispanic
- 3113.4%Asian alone
- 1932.1%Two or more races
- 540.6%Other race alone
- 80.09%American Indian alone
2000
2022
-
- 2,652,29166.1%White alone
- 1,178,48629.4%Black alone
- 95,0762.4%Hispanic
- 35,5680.9%Asian alone
- 33,2900.8%Two or more races
- 12,7650.3%American Indian alone
- 3,2660.08%Other race alone
- 1,2700.03%Native Hawaiian and Other
Pacific Islander alone

-
- 3,301,73962.5%White alone
- 1,313,29024.9%Black alone
- 343,7836.5%Hispanic
- 190,5083.6%Two or more races
- 89,8881.7%Asian alone
- 29,3900.6%Other race alone
- 12,1120.2%American Indian alone
- 1,9240.04%Native Hawaiian and Other
Pacific Islander alone

Income and house value in Lancaster
- Median household income in 2022
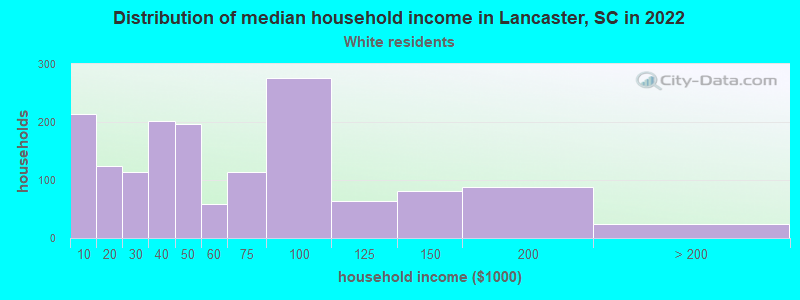
- $48,526White non-Hispanic householders
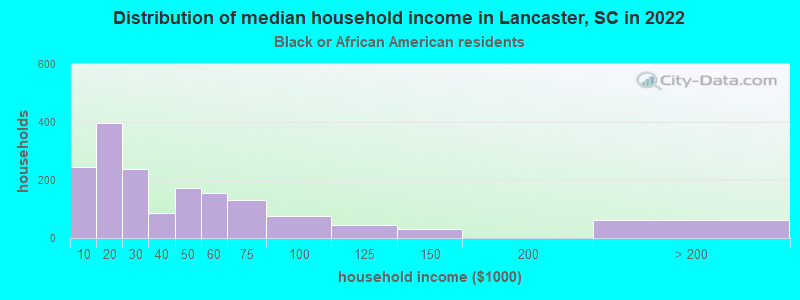
- $23,687Black householders
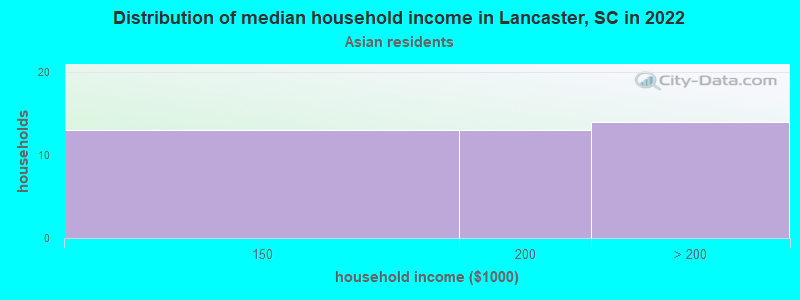
- over $200,000Asian householders
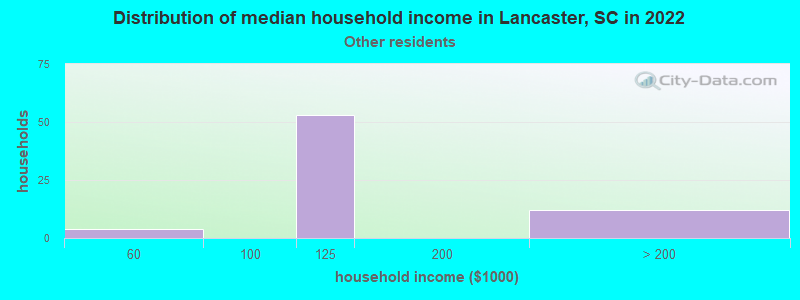
- $127,001Some other race householders
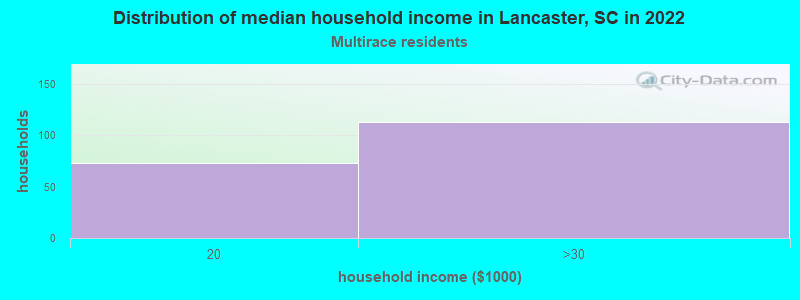
- $20,368Two or more races householders
- Median 2022 house value
- $262,492White Non-Hispanic householders
- $157,495Black or African American householders
- $165,943Asian householders
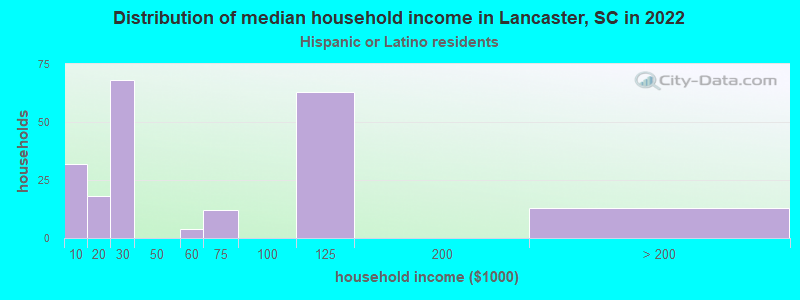
- $414,858Hispanic or Latino householders
Household income for White non-Hispanic householders
Household income for Black householders
Household income for Asian householders
Household income for Some other race householders
Household income for Two or more races householders
Household income for Hispanic or Latino race householders
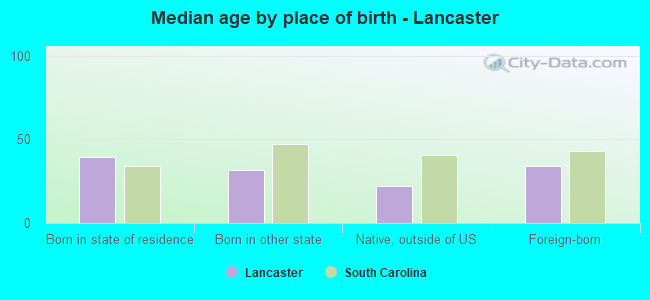
Median age by race in Lancaster
- 43.5Median age for White residents
- 41.0Males
- 46.2Females
- 35.0Median age for Black or African American residents
- 35.0Males
- 35.1Females
- 52.9Median age for American Indian / Alaska Native residents
- -583,333,332.8Males
- -859,981,932.3Females
- 39.3Median age for Asian residents
- 23.6Males
- 37.5Females
- -666,666,666.0Median age for Native Hawaiian / Pacific Islander residents
- -666,666,666.0Males
- -666,666,666.0Females
- 15.8Median age for Other race residents
- 16.4Males
- 13.2Females
- 33.6Median age for Two or more races residents
- 37.2Males
- 31.9Females
- 44.7Median age for White alone residents
- 43.2Males
- 48.1Females
- 14.6Median age for Hispanic or Latino residents
- 15.7Males
- 13.6Females
Owner/renter occupied households by race in Lancaster
- House owners and renters - White residents
- 88370.2%Owner occupied
- 37529.8%Renter occupied
- House owners and renters - Black or African American residents
- 48234.2%Owner occupied
- 92765.8%Renter occupied
- House owners and renters - American Indian / Alaska Native residents
- 3100.0%Renter occupied
- House owners and renters - Asian residents
- 48100.0%Owner occupied
- House owners and renters - Other race residents
- 14695.9%Owner occupied
- 64.1%Renter occupied
- House owners and renters - Two or more races residents
- 104.4%Owner occupied
- 21495.6%Renter occupied
- House owners and renters - White alone residents
- 89073.6%Owner occupied
- 31926.4%Renter occupied
- House owners and renters - Hispanic or Latino residents
- 9733.9%Owner occupied
- 18866.1%Renter occupied
Language usage in Lancaster
- English speakers - Total
- 85.0% of residents of Lancaster speak English at home.
- 11.7% of residents speak Spanish at home
- 33633.1%Speak English very well
- 67966.9%Speak English less than very well
- 5.4% of residents speak other language at home
- 41788.7%Speak English very well
- 5311.3%Speak English less than very well
- English speakers - Born in the United States
- 87.7% of residents of Lancaster speak English at home.
- 8.3% of residents speak Spanish at home
- 12146.7%Speak English very well
- 13853.3%Speak English less than very well
- English speakers - Native, born elsewhere
- 52.0% of residents of Lancaster speak English at home.
- 80.0% of residents speak Spanish at home
- 20100.0%Speak English very well
- English speakers - Foreign-born
- 5.6% of residents of Lancaster speak English at home.
- 54.8% of residents speak Spanish at home
- 16732.9%Speak English very well
- 34067.1%Speak English less than very well
- 41.8% of residents speak other language at home
- 32884.8%Speak English very well
- 5915.2%Speak English less than very well
White (Caucasian) - Speak another language
| Native: | 4.5% (128) |
| Foreign-born: | 51.5% (52) |
Asian - Speak only English
| Native: | 95.1% (30) |
| Foreign-born: | 7.9% (14) |
Other race - Speak another language
| Native: | 51.1% (251) |
| Foreign-born: | 98.6% (101) |
Two or more races - Speak only English
| Native: | 56.5% (204) |
| Foreign-born: | 7.0% (25) |
Two or more races - Speak another language
| Native: | 52.1% (188) |
| Foreign-born: | 91.2% (327) |
White alone - Speak another language
| Native: | 1.6% (45) |
| Foreign-born: | 100.0% (64) |
Hispanic or Latino - Speak only English
| Native: | 22.1% (114) |
| Foreign-born: | 4.7% (25) |
Hispanic or Latino - Speak another language
| Native: | 76.6% (393) |
| Foreign-born: | 95.1% (511) |
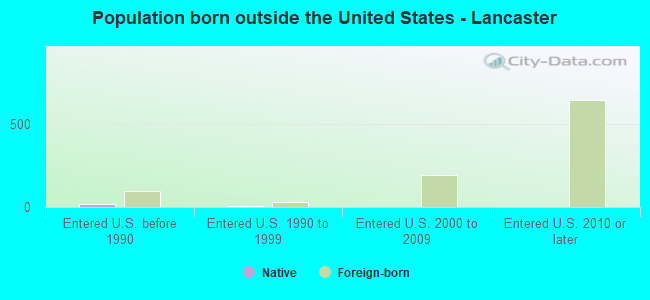
Foreign-born residents in Lancaster
632 residents are foreign born (4.6% Latin America, 2.0% Asia).
| This city: | 6.9% |
| South Carolina: | 5.3% |
Marital status for residents in Lancaster
Marital status - White (Caucasian) population 15 years and over
- Males
- 35.5%Never married
- 52.9%Now married
- 0.0%Separated
- 2.5%Widowed
- 9.1%Divorced
- Females
- 22.7%Never married
- 43.8%Now married
- 0.0%Separated
- 11.0%Widowed
- 22.5%Divorced
Women who gave birth in the past 12 months
| Now married: | 36.7% (28) |
| Unmarried: | 63.3% (48) |
Women who did not give birth in the past 12 months
| Now married: | 42.7% (285) |
| Unmarried: | 57.3% (382) |
Marital status - Black or African American population 15 years and over
- Males
- 46.0%Never married
- 33.5%Now married
- 4.0%Separated
- 3.1%Widowed
- 13.3%Divorced
- Females
- 62.6%Never married
- 17.8%Now married
- 6.5%Separated
- 8.4%Widowed
- 4.6%Divorced
Women who gave birth in the past 12 months
| Now married: | 9.2% (22) |
| Unmarried: | 90.8% (215) |
Women who did not give birth in the past 12 months
| Now married: | 10.8% (129) |
| Unmarried: | 89.2% (1,069) |
Marital status - American Indian / Alaska Native population 15 years and over
- Males
- 0.0%Never married
- 100.0%Now married
- 0.0%Separated
- 0.0%Widowed
- 0.0%Divorced
- Females
- 0.0%Never married
- 100.0%Now married
- 0.0%Separated
- 0.0%Widowed
- 0.0%Divorced
Women who did not give birth in the past 12 months
| Now married: | 100.0% (1) |
| Unmarried: | 0.0% (0) |
Marital status - Asian population 15 years and over
- Males
- 43.9%Never married
- 56.1%Now married
- 0.0%Separated
- 0.0%Widowed
- 0.0%Divorced
- Females
- 50.9%Never married
- 29.6%Now married
- 13.9%Separated
- 5.6%Widowed
- 0.0%Divorced
Women who did not give birth in the past 12 months
| Now married: | 46.1% (52) |
| Unmarried: | 53.9% (61) |
Marital status - Other race population 15 years and over
- Males
- 52.2%Never married
- 47.8%Now married
- 0.0%Separated
- 0.0%Widowed
- 0.0%Divorced
- Females
- 49.1%Never married
- 50.9%Now married
- 0.0%Separated
- 0.0%Widowed
- 0.0%Divorced
Women who did not give birth in the past 12 months
| Now married: | 50.9% (73) |
| Unmarried: | 49.1% (70) |
Marital status - Two or more races population 15 years and over
- Males
- 58.8%Never married
- 37.0%Now married
- 0.0%Separated
- 0.0%Widowed
- 4.2%Divorced
- Females
- 45.5%Never married
- 54.5%Now married
- 0.0%Separated
- 0.0%Widowed
- 0.0%Divorced
Women who did not give birth in the past 12 months
| Now married: | 50.0% (173) |
| Unmarried: | 50.0% (173) |
Marital status - White alone, not Hispanic / Latino population 15 years and over
- Males
- 35.8%Never married
- 52.5%Now married
- 0.0%Separated
- 2.5%Widowed
- 9.1%Divorced
- Females
- 21.5%Never married
- 42.5%Now married
- 0.0%Separated
- 11.8%Widowed
- 24.2%Divorced
Women who gave birth in the past 12 months
| Now married: | 49.2% (29) |
| Unmarried: | 50.8% (30) |
Women who did not give birth in the past 12 months
| Now married: | 39.9% (249) |
| Unmarried: | 60.1% (374) |
Marital status - Hispanic or Latino population 15 years and over
- Males
- 65.5%Never married
- 31.5%Now married
- 0.0%Separated
- 0.0%Widowed
- 2.9%Divorced
- Females
- 45.8%Never married
- 54.2%Now married
- 0.0%Separated
- 0.0%Widowed
- 0.0%Divorced
Women who gave birth in the past 12 months
| Now married: | 0.0% (0) |
| Unmarried: | 100.0% (22) |
Women who did not give birth in the past 12 months
| Now married: | 54.8% (166) |
| Unmarried: | 45.2% (137) |
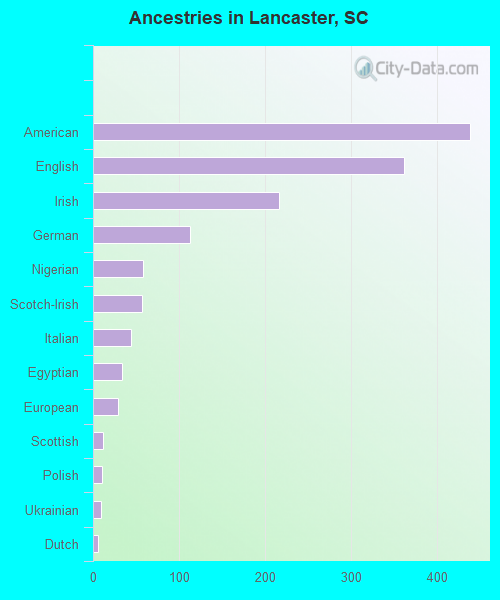
Ancestries in Lancaster

- 4397.6%American
- 3626.2%English
- 2173.7%Irish
- 1131.9%German
- 581.0%Nigerian
- 571.0%Scotch-Irish
- 440.8%Italian
- 340.6%Egyptian
- 290.5%European
- 120.2%Scottish
- 100.2%Polish
- 90.2%Ukrainian
- 60.1%Dutch
- 30.05%African
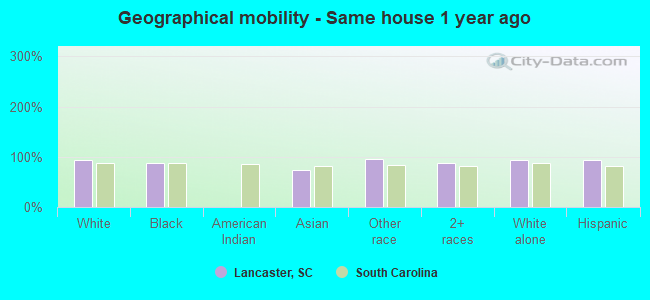
Geographical mobility in Lancaster

- Same house 1 year ago
- 2,89993.7%White (Caucasian)
- 3,77488.0%Black or African American
- 15673.8%Asian
- 40595.4%Other race
- 59786.8%Two or more races
- 2,76793.9%White alone, not Hispanic / Latino
- 88793.0%Hispanic or Latino
-
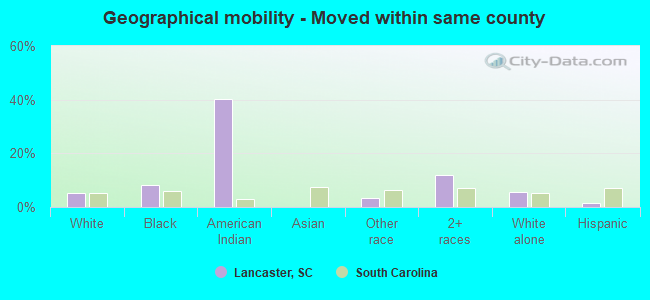
- Moved within same county
- 1665.4%White / Caucasian
- 3458.0%Black or African American
- 440.2%American Indian / Alaska Native
- 143.4%Other race
- 8211.9%Two or more races
- 1685.7%White alone, not Hispanic / Latino
- 131.4%Hispanic or Latino
-
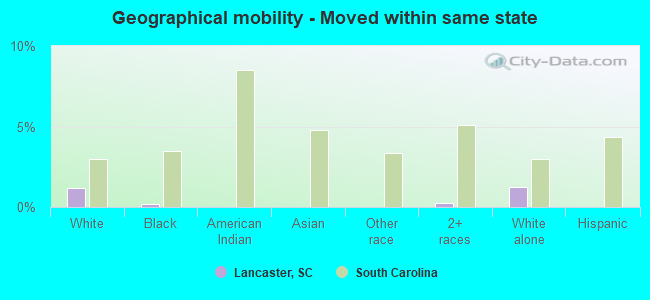
- Moved within same state
- 371.2%White / Caucasian
- 90.2%Black or African American
- 20.2%Two or more races
- 371.3%White alone, not Hispanic / Latino
-
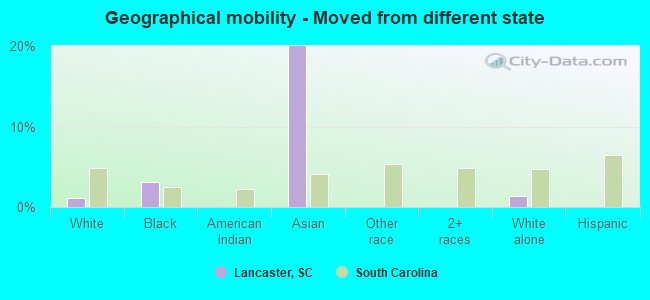
- Moved from different state
- 351.1%White / Caucasian
- 1333.1%Black or African American
- 4219.9%Asian
- 391.3%White alone, not Hispanic / Latino
-
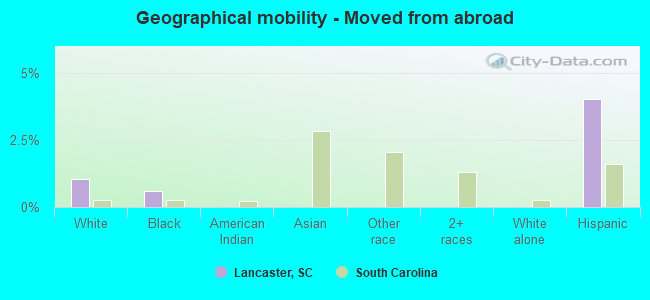
- Moved from abroad
- 331.1%White
- 250.6%Black or African American
- 384.0%Hispanic or Latino
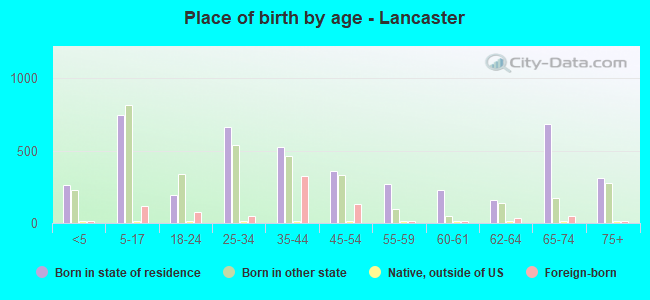
Children Nativity (place of birth) in Lancaster
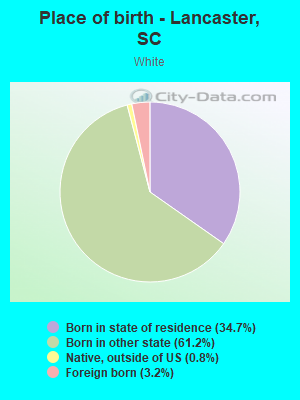
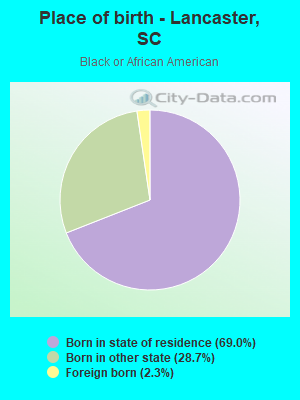
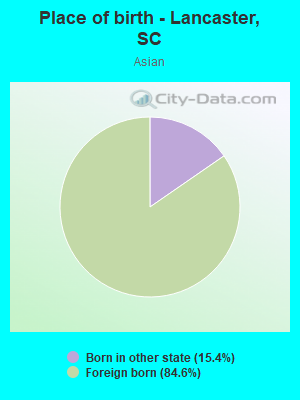
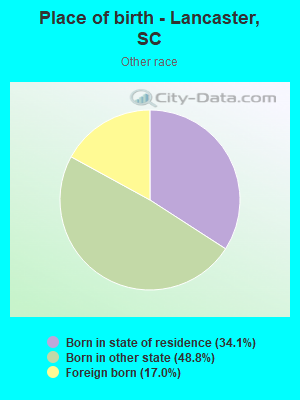
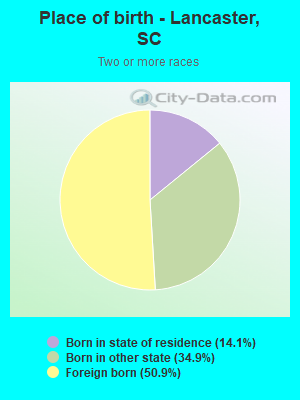
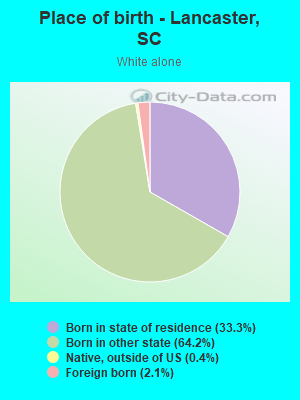
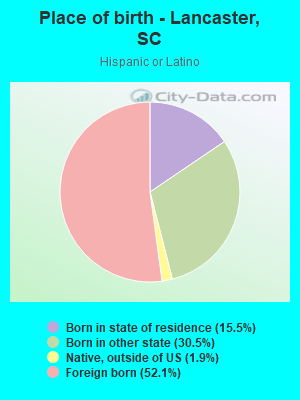
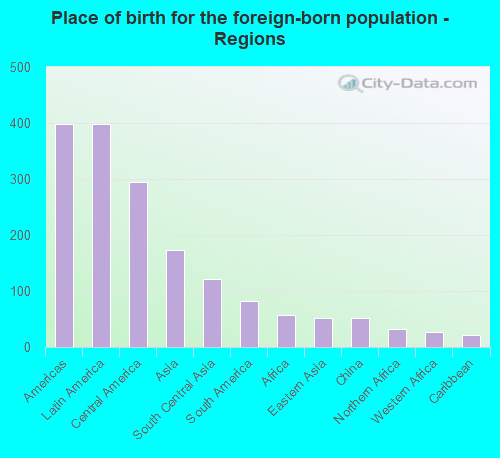
Place of birth for residents in Lancaster
![Place of birth for the foreign-born population - Regions]()
- 399Americas
- 399Latin America
- 295Central America
- 174Asia
- 122South Central Asia
- 82South America
- 58Africa
- 51Eastern Asia
- 51China
- 32Northern Africa
- 26Western Africa
- 21Caribbean
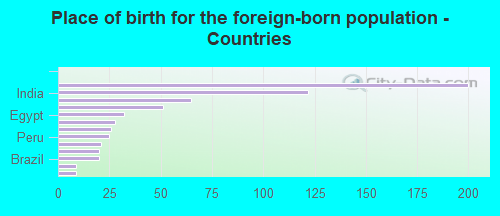
![Place of birth for the foreign-born population - Countries]()
- 200Honduras
- 122India
- 65Mexico
- 51China
- 32Egypt
- 28Colombia
- 26Nigeria
- 25Peru
- 21Jamaica
- 20Guatemala
- 20Brazil
- 9Costa Rica
- 9Ecuador
Grandparents responsible for own grandchildren in Lancaster
Zip codes: 29720.