Races in Lanham, Maryland (MD) Detailed Stats
Data:
Races - White alone (%)
Races - White alone (% change since 2000)
Races - Black alone (%)
Races - Black alone (% change since 2000)
Races - American Indian alone (%)
Races - American Indian alone (% change since 2000)
Races - Asian alone (%)
Races - Asian alone (% change since 2000)
Races - Hispanic (%)
Races - Hispanic (% change since 2000)
Races - Native Hawaiian and Other Pacific Islander alone (%)
Races - Native Hawaiian and Other Pacific Islander alone (% change since 2000)
Races - Two or more races(%)
Races - Two or more races(% change since 2000)
Races - Other race alone (%)
Races - Other race alone (% change since 2000)
Racial diversity
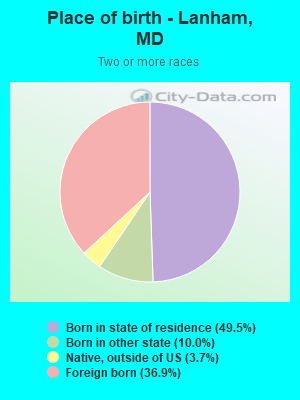
Place of birth - Born in state of residence (%)
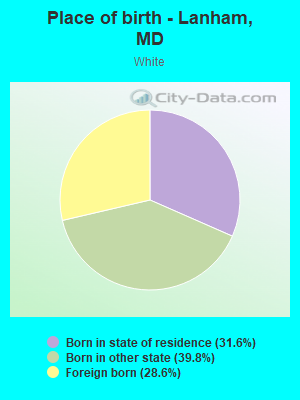
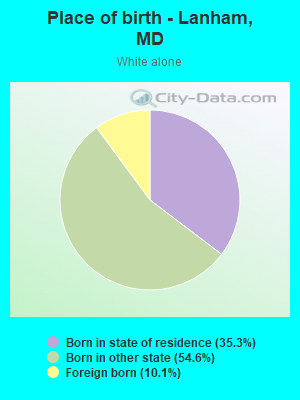
Place of birth - Born in state of residence (%) - White
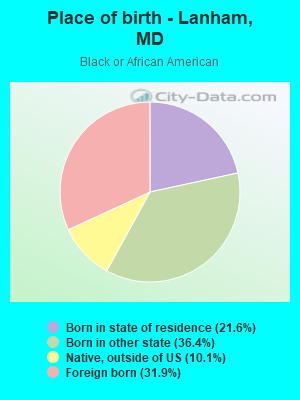
Place of birth - Born in state of residence (%) - Black or African American
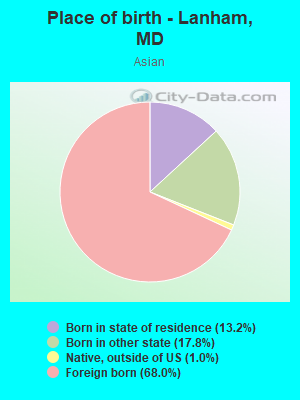
Place of birth - Born in state of residence (%) - Asian
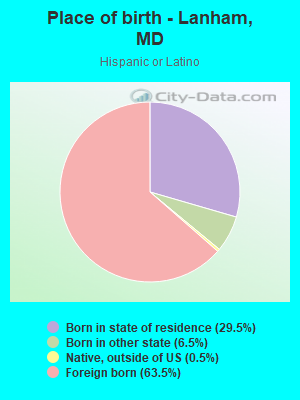
Place of birth - Born in state of residence (%) - Hispanic or Latino
Place of birth - Born in state of residence (%) - American Indian and Alaska Native
Place of birth - Born in state of residence (%) - Multirace
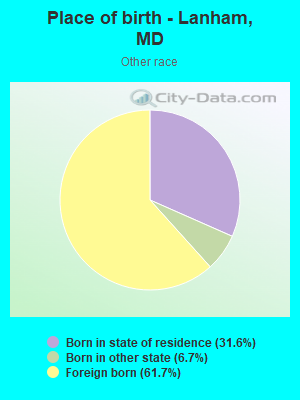
Place of birth - Born in state of residence (%) - Other Race
Place of birth - Born in other state (%)
Place of birth - Born in other state (%) - White
Place of birth - Born in other state (%) - Black or African American
Place of birth - Born in other state (%) - Asian
Place of birth - Born in other state (%) - Hispanic or Latino
Place of birth - Born in other state (%) - American Indian and Alaska Native
Place of birth - Born in other state (%) - Multirace
Place of birth - Born in other state (%) - Other Race
Place of birth - Native, outside of US (%)
Place of birth - Native, outside of US (%) - White
Place of birth - Native, outside of US (%) - Black or African American
Place of birth - Native, outside of US (%) - Asian
Place of birth - Native, outside of US (%) - Hispanic or Latino
Place of birth - Native, outside of US (%) - American Indian and Alaska Native
Place of birth - Native, outside of US (%) - Multirace
Place of birth - Native, outside of US (%) - Other Race
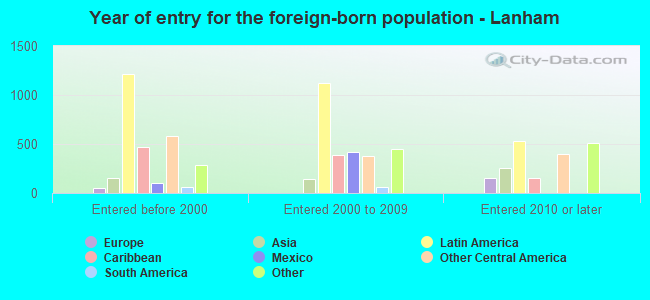
Place of birth - Foreign born (%)
Place of birth - Foreign born (%) - White
Place of birth - Foreign born (%) - Black or African American
Place of birth - Foreign born (%) - Asian
Place of birth - Foreign born (%) - Hispanic or Latino
Place of birth - Foreign born (%) - American Indian and Alaska Native
Place of birth - Foreign born (%) - Multirace
Place of birth - Foreign born (%) - Other Race
Residents speaking English at home (%)
Residents speaking English at home - Born in the United States (%)
Residents speaking English at home - Native, born elsewhere (%)
Residents speaking English at home - Foreign born (%)
Residents speaking Spanish at home (%)
Residents speaking Spanish at home - Born in the United States (%)
Residents speaking Spanish at home - Native, born elsewhere (%)
Residents speaking Spanish at home - Foreign born (%)
Residents speaking other language at home (%)
Residents speaking other language at home - Born in the United States (%)
Residents speaking other language at home - Native, born elsewhere (%)
Residents speaking other language at home - Foreign born (%)
Marital status - Never married (%)
Marital status - Now married (%)
Marital status - Separated (%)
Marital status - Widowed (%)
Marital status - Divorced (%)
Ancestries Reported - Arab (%)
Ancestries Reported - Czech (%)
Ancestries Reported - Danish (%)
Ancestries Reported - Dutch (%)
Ancestries Reported - English (%)
Ancestries Reported - French (%)
Ancestries Reported - French Canadian (%)
Ancestries Reported - German (%)
Ancestries Reported - Greek (%)
Ancestries Reported - Hungarian (%)
Ancestries Reported - Irish (%)
Ancestries Reported - Italian (%)
Ancestries Reported - Lithuanian (%)
Ancestries Reported - Norwegian (%)
Ancestries Reported - Polish (%)
Ancestries Reported - Portuguese (%)
Ancestries Reported - Russian (%)
Ancestries Reported - Scotch-Irish (%)
Ancestries Reported - Scottish (%)
Ancestries Reported - Slovak (%)
Ancestries Reported - Subsaharan African (%)
Ancestries Reported - Swedish (%)
Ancestries Reported - Swiss (%)
Ancestries Reported - Ukrainian (%)
Ancestries Reported - United States (%)
Ancestries Reported - Welsh (%)
Ancestries Reported - West Indian (%)
Ancestries Reported - Other (%)
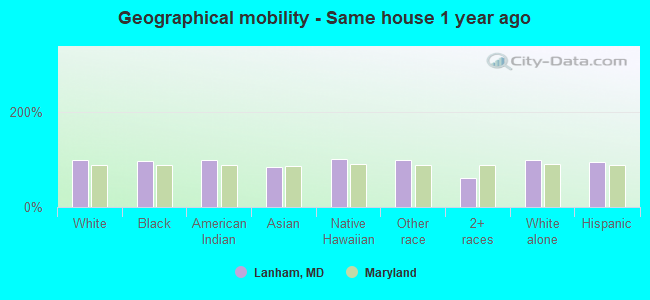
Geographical mobility - Same house 1 year ago (%)
Geographical mobility - Same house 1 year ago (%) - White
Geographical mobility - Same house 1 year ago (%) - Black or African American
Geographical mobility - Same house 1 year ago (%) - Asian
Geographical mobility - Same house 1 year ago (%) - Hispanic or Latino
Geographical mobility - Same house 1 year ago (%) - American Indian and Alaska Native
Geographical mobility - Same house 1 year ago (%) - Multirace
Geographical mobility - Same house 1 year ago (%) - Other Race
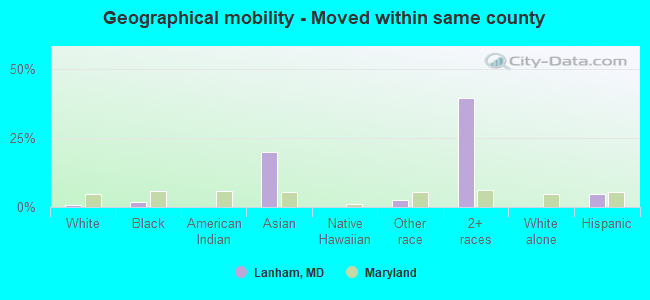
Geographical mobility - Moved within same county (%)
Geographical mobility - Moved within same county (%) - White
Geographical mobility - Moved within same county (%) - Black or African American
Geographical mobility - Moved within same county (%) - Asian
Geographical mobility - Moved within same county (%) - Hispanic or Latino
Geographical mobility - Moved within same county (%) - American Indian and Alaska Native
Geographical mobility - Moved within same county (%) - Multirace
Geographical mobility - Moved within same county (%) - Other Race
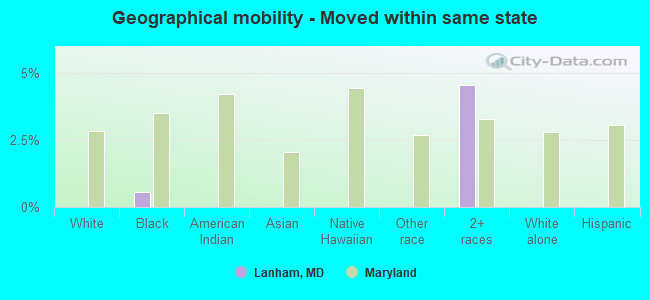
Geographical mobility - Moved from different county within same state (%)
Geographical mobility - Moved from different county within same state (%) - White
Geographical mobility - Moved from different county within same state (%) - Black or African American
Geographical mobility - Moved from different county within same state (%) - Asian
Geographical mobility - Moved from different county within same state (%) - Hispanic or Latino
Geographical mobility - Moved from different county within same state (%) - American Indian and Alaska Native
Geographical mobility - Moved from different county within same state (%) - Multirace
Geographical mobility - Moved from different county within same state (%) - Other Race
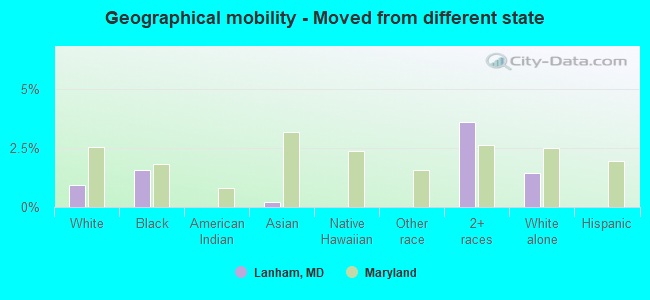
Geographical mobility - Moved from different state (%)
Geographical mobility - Moved from different state (%) - White
Geographical mobility - Moved from different state (%) - Black or African American
Geographical mobility - Moved from different state (%) - Asian
Geographical mobility - Moved from different state (%) - Hispanic or Latino
Geographical mobility - Moved from different state (%) - American Indian and Alaska Native
Geographical mobility - Moved from different state (%) - Multirace
Geographical mobility - Moved from different state (%) - Other Race
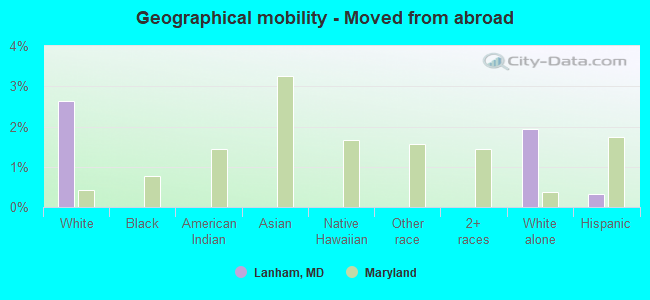
Geographical mobility - Moved from abroad (%)
Geographical mobility - Moved from abroad (%) - White
Geographical mobility - Moved from abroad (%) - Black or African American
Geographical mobility - Moved from abroad (%) - Asian
Geographical mobility - Moved from abroad (%) - Hispanic or Latino
Geographical mobility - Moved from abroad (%) - American Indian and Alaska Native
Geographical mobility - Moved from abroad (%) - Multirace
Geographical mobility - Moved from abroad (%) - Other Race
Place of birth for the foreign-born population - Ireland (%)
Place of birth for the foreign-born population - Denmark (%)
Place of birth for the foreign-born population - Norway (%)
Place of birth for the foreign-born population - Sweden (%)
Place of birth for the foreign-born population - United Kingdom (%)
Place of birth for the foreign-born population - England (%)
Place of birth for the foreign-born population - Scotland (%)
Place of birth for the foreign-born population - Other Northern Europe (%)
Place of birth for the foreign-born population - Austria (%)
Place of birth for the foreign-born population - Belgium (%)
Place of birth for the foreign-born population - France (%)
Place of birth for the foreign-born population - Germany (%)
Place of birth for the foreign-born population - Netherlands (%)
Place of birth for the foreign-born population - Switzerland (%)
Place of birth for the foreign-born population - Other Western Europe (%)
Place of birth for the foreign-born population - Greece (%)
Place of birth for the foreign-born population - Italy (%)
Place of birth for the foreign-born population - Portugal (%)
Place of birth for the foreign-born population - Spain (%)
Place of birth for the foreign-born population - Other Southern Europe (%)
Place of birth for the foreign-born population - Albania (%)
Place of birth for the foreign-born population - Belarus (%)
Place of birth for the foreign-born population - Bosnia and Herzegovina (%)
Place of birth for the foreign-born population - Bulgaria (%)
Place of birth for the foreign-born population - Croatia (%)
Place of birth for the foreign-born population - Czechoslovakia (%)
Place of birth for the foreign-born population - Hungary (%)
Place of birth for the foreign-born population - Latvia (%)
Place of birth for the foreign-born population - Lithuania (%)
Place of birth for the foreign-born population - North Macedonia (Macedonia) (%)
Place of birth for the foreign-born population - Moldova (%)
Place of birth for the foreign-born population - Poland (%)
Place of birth for the foreign-born population - Romania (%)
Place of birth for the foreign-born population - Russia (%)
Place of birth for the foreign-born population - Serbia (%)
Place of birth for the foreign-born population - Ukraine (%)
Place of birth for the foreign-born population - Other Eastern Europe (%)
Place of birth for the foreign-born population - China (%)
Place of birth for the foreign-born population - Hong Kong (%)
Place of birth for the foreign-born population - Taiwan (%)
Place of birth for the foreign-born population - Japan (%)
Place of birth for the foreign-born population - Korea (%)
Place of birth for the foreign-born population - Other Eastern Asia (%)
Place of birth for the foreign-born population - Afghanistan (%)
Place of birth for the foreign-born population - Bangladesh (%)
Place of birth for the foreign-born population - India (%)
Place of birth for the foreign-born population - Iran (%)
Place of birth for the foreign-born population - Kazakhstan (%)
Place of birth for the foreign-born population - Nepal (%)
Place of birth for the foreign-born population - Pakistan (%)
Place of birth for the foreign-born population - Sri Lanka (%)
Place of birth for the foreign-born population - Uzbekistan (%)
Place of birth for the foreign-born population - Other South Central Asia (%)
Place of birth for the foreign-born population - Burma (%)
Place of birth for the foreign-born population - Cambodia (%)
Place of birth for the foreign-born population - Indonesia (%)
Place of birth for the foreign-born population - Laos (%)
Place of birth for the foreign-born population - Malaysia (%)
Place of birth for the foreign-born population - Philippines (%)
Place of birth for the foreign-born population - Singapore (%)
Place of birth for the foreign-born population - Thailand (%)
Place of birth for the foreign-born population - Vietnam (%)
Place of birth for the foreign-born population - Other South Eastern Asia (%)
Place of birth for the foreign-born population - Armenia (%)
Place of birth for the foreign-born population - Iraq (%)
Place of birth for the foreign-born population - Israel (%)
Place of birth for the foreign-born population - Jordan (%)
Place of birth for the foreign-born population - Kuwait (%)
Place of birth for the foreign-born population - Lebanon (%)
Place of birth for the foreign-born population - Saudi Arabia (%)
Place of birth for the foreign-born population - Syria (%)
Place of birth for the foreign-born population - Turkey (%)
Place of birth for the foreign-born population - Yemen (%)
Place of birth for the foreign-born population - Other Western Asia (%)
Place of birth for the foreign-born population - Eritrea (%)
Place of birth for the foreign-born population - Ethiopia (%)
Place of birth for the foreign-born population - Kenya (%)
Place of birth for the foreign-born population - Somalia (%)
Place of birth for the foreign-born population - Uganda (%)
Place of birth for the foreign-born population - Zimbabwe (%)
Place of birth for the foreign-born population - Other Eastern Africa (%)
Place of birth for the foreign-born population - Cameroon (%)
Place of birth for the foreign-born population - Congo (%)
Place of birth for the foreign-born population - Democratic Republic of Congo (Zaire) (%)
Place of birth for the foreign-born population - Other Middle Africa (%)
Place of birth for the foreign-born population - Egypt (%)
Place of birth for the foreign-born population - Morocco (%)
Place of birth for the foreign-born population - Sudan (%)
Place of birth for the foreign-born population - Other Northern Africa (%)
Place of birth for the foreign-born population - South Africa (%)
Place of birth for the foreign-born population - Other Southern Africa (%)
Place of birth for the foreign-born population - Cabo Verde (%)
Place of birth for the foreign-born population - Ghana (%)
Place of birth for the foreign-born population - Liberia (%)
Place of birth for the foreign-born population - Nigeria (%)
Place of birth for the foreign-born population - Senegal (%)
Place of birth for the foreign-born population - Sierra Leone (%)
Place of birth for the foreign-born population - Other Western Africa (%)
Place of birth for the foreign-born population - Australia (%)
Place of birth for the foreign-born population - New Zealand (%)
Place of birth for the foreign-born population - Fiji (%)
Place of birth for the foreign-born population - Micronesia (%)
Place of birth for the foreign-born population - Bahamas (%)
Place of birth for the foreign-born population - Barbados (%)
Place of birth for the foreign-born population - Cuba (%)
Place of birth for the foreign-born population - Dominica (%)
Place of birth for the foreign-born population - Dominican Republic (%)
Place of birth for the foreign-born population - Grenada (%)
Place of birth for the foreign-born population - Haiti (%)
Place of birth for the foreign-born population - Jamaica (%)
Place of birth for the foreign-born population - St. Vincent and the Grenadines (%)
Place of birth for the foreign-born population - Trinidad and Tobago (%)
Place of birth for the foreign-born population - West Indies (%)
Place of birth for the foreign-born population - Other Caribbean (%)
Place of birth for the foreign-born population - Belize (%)
Place of birth for the foreign-born population - Costa Rica (%)
Place of birth for the foreign-born population - El Salvador (%)
Place of birth for the foreign-born population - Guatemala (%)
Place of birth for the foreign-born population - Honduras (%)
Place of birth for the foreign-born population - Mexico (%)
Place of birth for the foreign-born population - Nicaragua (%)
Place of birth for the foreign-born population - Panama (%)
Place of birth for the foreign-born population - Other Central America (%)
Place of birth for the foreign-born population - Argentina (%)
Place of birth for the foreign-born population - Bolivia (%)
Place of birth for the foreign-born population - Brazil (%)
Place of birth for the foreign-born population - Chile (%)
Place of birth for the foreign-born population - Colombia (%)
Place of birth for the foreign-born population - Ecuador (%)
Place of birth for the foreign-born population - Guyana (%)
Place of birth for the foreign-born population - Peru (%)
Place of birth for the foreign-born population - Uruguay (%)
Place of birth for the foreign-born population - Venezuela (%)
Place of birth for the foreign-born population - Other South America (%)
Place of birth for the foreign-born population - Canada (%)
Place of birth for the foreign-born population - Other Northern America (%)
Place of birth for the foreign-born population - Other (%)
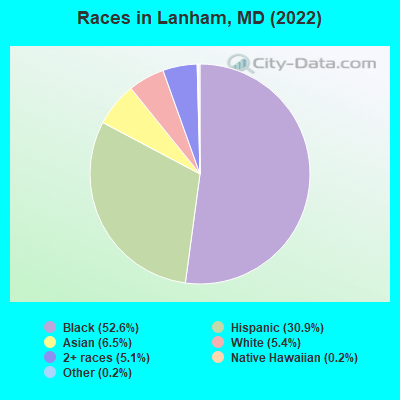
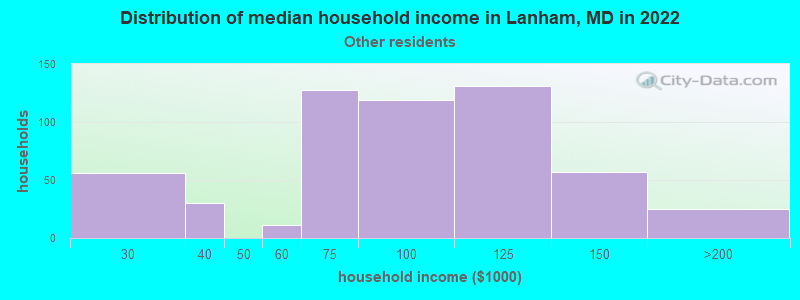
According to 2022 data, the most numerous races in Lanham, MD are White alone (626 residents), Black alone (6,066 residents), and Hispanic (3,570 residents). 54.9% of Lanham residents speak English at home.
Race distribution in Lanham 6,066 52.6% Black alone 3,570 30.9% Hispanic 754 6.5% Asian alone 626 5.4% White alone 590 5.1% Two or more races 19 0.2% Other race alone 20 0.2% Native Hawaiian and Other
2000 2022
3,286,547 62.1% White alone 1,464,735 27.7% Black alone 227,916 4.3% Hispanic 209,738 4.0% Asian alone 82,946 1.6% Two or more races 13,312 0.3% American Indian alone 9,379 0.2% Other race alone 1,913 0.04% Native Hawaiian and Other
2,906,492 47.1% White alone 1,800,914 29.2% Black alone 705,842 11.4% Hispanic 401,818 6.5% Asian alone 291,317 4.7% Two or more races 46,930 0.8% Other race alone 8,930 0.1% American Indian alone 2,417 0.04% Native Hawaiian and Other
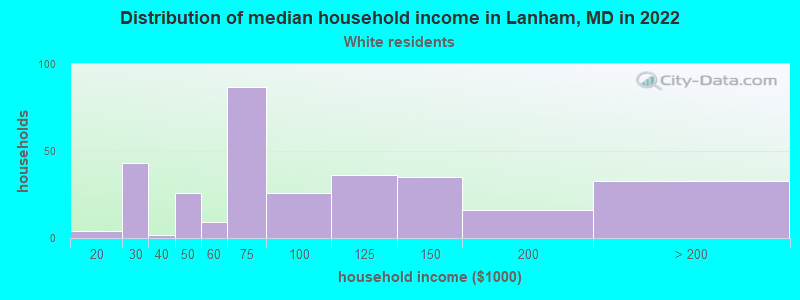
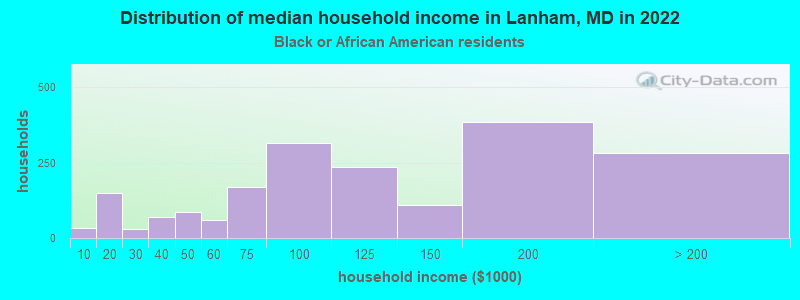
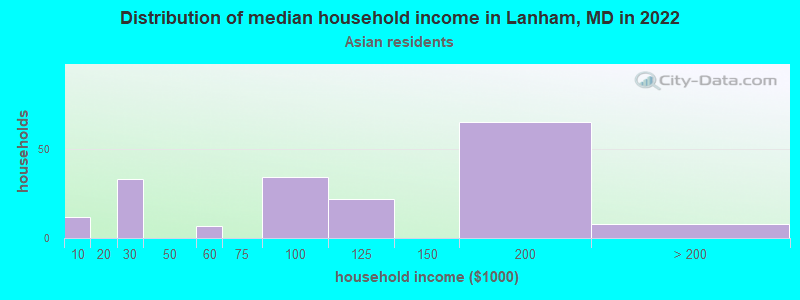
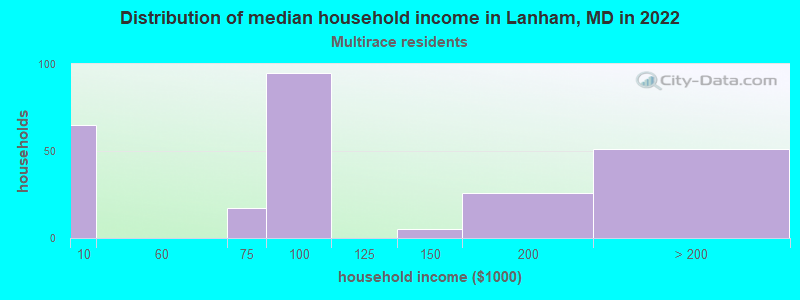
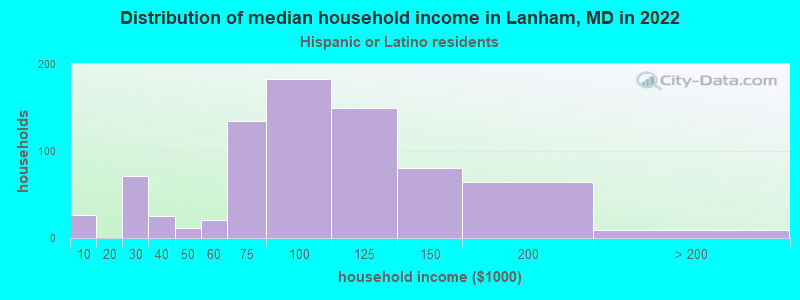
Income and house value in Lanham Median household income in 2022 $64,703 White non-Hispanic householders$103,333 Black householders$106,749 Asian householders$89,359 Some other race householders$89,450 Two or more races householders$83,600 Hispanic or Latino race householders
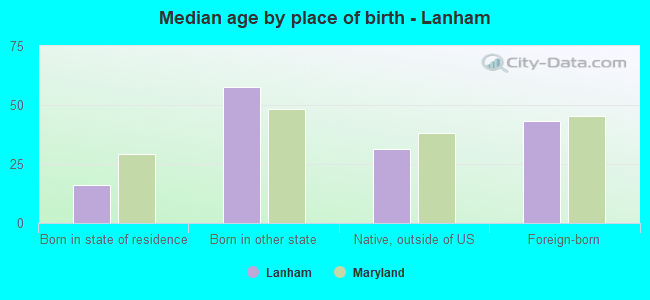
Median age by race in Lanham
53.9 Median age for White residents55.2 53.1 44.7 Median age for Black or African American residents40.1 47.2 -780,410,741.7 Median age for American Indian / Alaska Native residents-888,297,871.5 -689,905,591.2 36.7 Median age for Asian residents32.5 39.4 -571,600,480.8 Median age for Native Hawaiian / Pacific Islander residents-720,061,021.4 -760,942,760.2 34.2 Median age for Other race residents33.9 30.1 50.3 Median age for Two or more races residents42.8 51.0 60.9 Median age for White alone residents56.8 64.1 32.5 Median age for Hispanic or Latino residents35.4 29.0
Owner/renter occupied households by race in Lanham
House owners and renters - White residents 221 68.9% Owner occupied99 31.1% Renter occupiedHouse owners and renters - Black or African American residents 1,603 84.9% Owner occupied286 15.1% Renter occupiedHouse owners and renters - American Indian / Alaska Native residents 16 100.0% Owner occupiedHouse owners and renters - Asian residents 165 93.1% Owner occupied12 6.9% Renter occupiedHouse owners and renters - Native Hawaiian / Pacific Islander residents 19 100.0% Owner occupiedHouse owners and renters - Other race residents 304 50.8% Owner occupied295 49.2% Renter occupiedHouse owners and renters - Two or more races residents 199 78.2% Owner occupied56 21.8% Renter occupiedHouse owners and renters - White alone residents 168 69.4% Owner occupied74 30.6% Renter occupiedHouse owners and renters - Hispanic or Latino residents 449 55.5% Owner occupied360 44.5% Renter occupied
Language usage in Lanham
English speakers - Total 54.9% of residents of Lanham speak English at home.
27.6% of residents speak Spanish at home 1,228 40.3% Speak English very well1,820 59.7% Speak English less than very well18.8% of residents speak other language at home 1,437 69.0% Speak English very well645 31.0% Speak English less than very well
English speakers - Born in the United States 88.5% of residents of Lanham speak English at home.
6.7% of residents speak Spanish at home 169 81.2% Speak English very well39 18.8% Speak English less than very well5.2% of residents speak other language at home 142 87.1% Speak English very well21 12.9% Speak English less than very well
English speakers - Native, born elsewhere 96.9% of residents of Lanham speak English at home.
1.7% of residents speak Spanish at home 12 100.0% Speak English very well1.7% of residents speak other language at home 12 100.0% Speak English very well
English speakers - Foreign-born 23.3% of residents of Lanham speak English at home.
41.4% of residents speak Spanish at home 404 19.8% Speak English very well1,638 80.2% Speak English less than very well34.6% of residents speak other language at home 1,127 66.0% Speak English very well580 34.0% Speak English less than very well
White (Caucasian) - Speak only English Native:
89.3% (545)Foreign-born:
13.6% (31)
White (Caucasian) - Speak another language Native:
10.6% (65)Foreign-born:
82.3% (186)
Black or African American - Speak only English Native:
95.3% (3,877)Foreign-born:
34.4% (683)
Black or African American - Speak another language Native:
4.8% (193)Foreign-born:
66.0% (1,312)
Asian - Speak only English Native:
26.0% (55)Foreign-born:
28.7% (143)
Asian - Speak another language Native:
81.8% (174)Foreign-born:
74.3% (369)
Other race - Speak only English Native:
3.2% (30)Foreign-born:
7.0% (123)
Other race - Speak another language Native:
94.9% (894)Foreign-born:
92.3% (1,626)
Two or more races - Speak only English Native:
89.3% (504)Foreign-born:
45.7% (180)
Two or more races - Speak another language Native:
9.6% (54)Foreign-born:
48.2% (190)
White alone - Speak only English Native:
96.3% (543)Foreign-born:
56.2% (34)
White alone - Speak another language Native:
3.2% (18)Foreign-born:
45.2% (28)
Hispanic or Latino - Speak only English Native:
5.3% (59)Foreign-born:
7.3% (164)
Hispanic or Latino - Speak another language Native:
93.2% (1,033)Foreign-born:
91.9% (2,063)
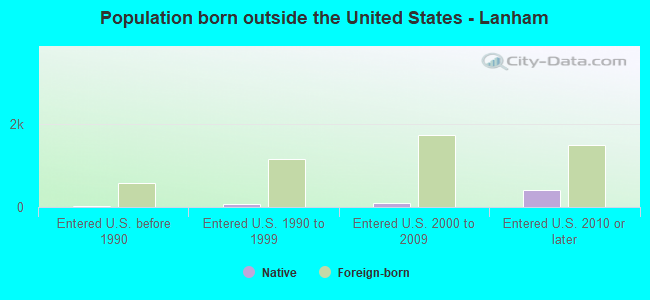
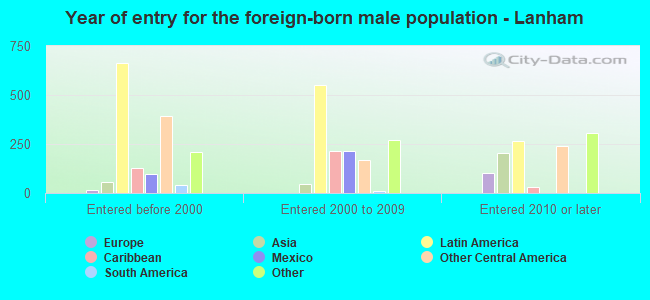
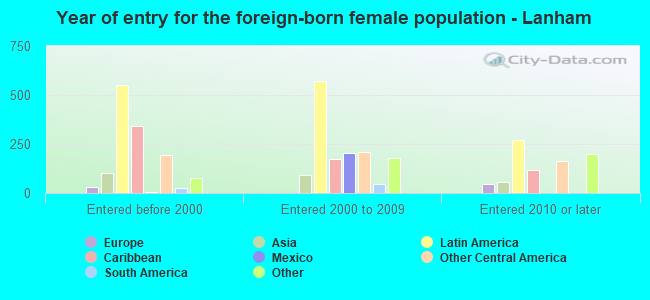
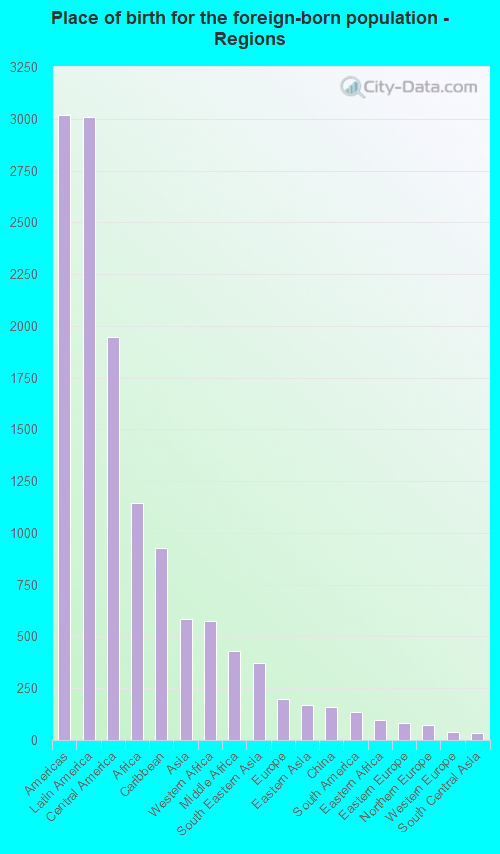
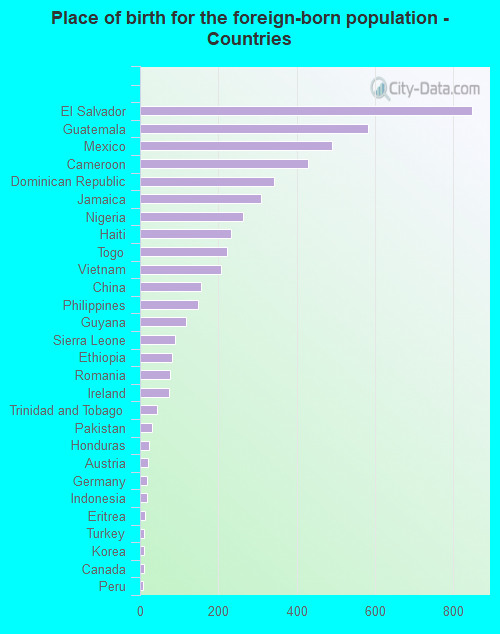
Foreign-born residents in Lanham
Marital status for residents in Lanham Marital status - White (Caucasian) population 15 years and over
Males 39.3% Never married30.1% Now married22.1% Separated2.0% Widowed6.5% DivorcedFemales 30.1% Never married59.2% Now married0.0% Separated7.1% Widowed3.5% DivorcedWomen who did not give birth in the past 12 months Now married:
89.5% (44)Unmarried:
10.5% (5)
Marital status - Black or African American population 15 years and over
Males 45.3% Never married41.8% Now married1.5% Separated1.3% Widowed10.0% DivorcedFemales 35.9% Never married36.6% Now married0.6% Separated12.5% Widowed14.5% DivorcedWomen who gave birth in the past 12 months Now married:
14.7% (13)Unmarried:
85.3% (76)
Women who did not give birth in the past 12 months Now married:
26.8% (301)Unmarried:
73.2% (824)
Marital status - American Indian / Alaska Native population 15 years and over
Males 0.0% Never married100.0% Now married0.0% Separated0.0% Widowed0.0% DivorcedFemales 0.0% Never married100.0% Now married0.0% Separated0.0% Widowed0.0% DivorcedMarital status - Asian population 15 years and over
Males 36.8% Never married63.2% Now married0.0% Separated0.0% Widowed0.0% DivorcedFemales 18.6% Never married53.5% Now married0.0% Separated16.8% Widowed11.1% DivorcedWomen who gave birth in the past 12 months Now married:
100.0% (62)Unmarried:
0.0% (0)
Women who did not give birth in the past 12 months Now married:
40.1% (64)Unmarried:
59.9% (95)
Marital status - Other race population 15 years and over
Males 44.8% Never married50.5% Now married0.0% Separated0.0% Widowed4.7% DivorcedFemales 36.5% Never married45.1% Now married0.4% Separated8.1% Widowed9.9% DivorcedWomen who did not give birth in the past 12 months Now married:
40.9% (259)Unmarried:
59.1% (373)
Marital status - Two or more races population 15 years and over
Males 66.7% Never married27.5% Now married0.0% Separated0.0% Widowed5.9% DivorcedFemales 55.8% Never married26.0% Now married7.7% Separated4.4% Widowed6.1% DivorcedWomen who did not give birth in the past 12 months Now married:
24.9% (47)Unmarried:
75.1% (141)
Marital status - White alone, not Hispanic / Latino population 15 years and over
Males 28.1% Never married27.4% Now married31.6% Separated3.0% Widowed9.9% DivorcedFemales 37.6% Never married49.1% Now married0.0% Separated8.8% Widowed4.4% DivorcedWomen who did not give birth in the past 12 months Now married:
60.0% (9)Unmarried:
40.0% (6)
Marital status - Hispanic or Latino population 15 years and over
Males 47.0% Never married48.8% Now married0.6% Separated0.0% Widowed3.6% DivorcedFemales 34.3% Never married47.4% Now married2.8% Separated6.5% Widowed8.9% DivorcedWomen who gave birth in the past 12 months Now married:
100.0% (14)Unmarried:
0.0% (0)
Women who did not give birth in the past 12 months Now married:
44.6% (321)Unmarried:
55.4% (400)
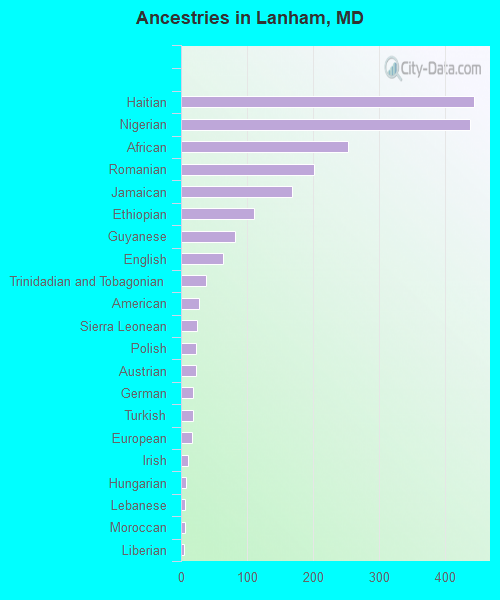
Ancestries in Lanham
445 5.8% Haitian439 5.7% Nigerian253 3.3% African202 2.6% Romanian168 2.2% Jamaican110 1.4% Ethiopian82 1.1% Guyanese64 0.8% English38 0.5% Trinidadian and Tobagonian28 0.4% American25 0.3% Sierra Leonean23 0.3% Polish22 0.3% Austrian18 0.2% German18 0.2% Turkish16 0.2% European11 0.1% Irish7 0.09% Hungarian6 0.08% Lebanese6 0.08% Moroccan5 0.07% Liberian4 0.05% British3 0.04% French Canadian
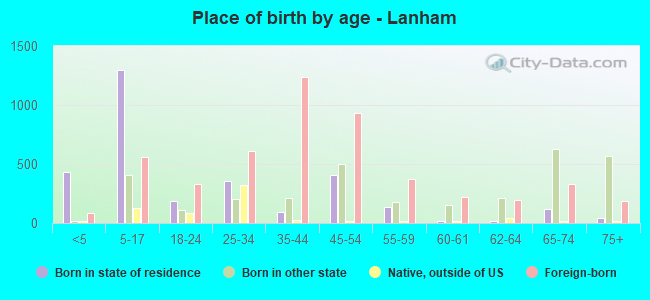
Children Nativity (place of birth) in Lanham
Children under 6 years - Living with two parents Both parents native 34 100.0% NativeBoth parents foreign-born 140 91.6% Native13 8.4% Foreign-bornOne native, one foreign-born parent 24 100.0% NativeChildren under 6 years - Living with one parent Native parent 3 87.3% Native0 12.7% Foreign-bornForeign-born parent 268 74.2% Native93 25.8% Foreign-bornChildren 6 to 17 years - Living with two parents Both parents native 196 99.5% Native1 0.5% Foreign-bornBoth parents foreign-born 641 70.2% Native272 29.8% Foreign-bornOne native, one foreign-born parent 6 100.0% NativeChildren 6 to 17 years - Living with one parent Foreign-born parent 815 59.3% Native560 40.7% Foreign-born
Grandparents responsible for own grandchildren in Lanham
Grandparents (30 to 59 years) White / Caucasian 7 11.3% Responsible for grandchildren54 88.7% Not responsible for grandchildrenBlack or African American 34 100.0% Not responsible for grandchildrenAsian 17 81.6% Responsible for grandchildren4 18.4% Not responsible for grandchildrenOther race 13 28.8% Responsible for grandchildren33 71.2% Not responsible for grandchildrenWhite alone, not Hispanic / Latino 45 100.0% Not responsible for grandchildrenHispanic or Latino 21 30.5% Responsible for grandchildren49 69.5% Not responsible for grandchildrenGrandparents (60 years and over) White / Caucasian 51 100.0% Not responsible for grandchildrenBlack or African American 44 28.4% Responsible for grandchildren111 71.6% Not responsible for grandchildrenAsian 10 100.0% Not responsible for grandchildrenWhite alone, not Hispanic / Latino 38 100.0% Not responsible for grandchildrenHispanic or Latino 35 100.0% Not responsible for grandchildren