Races in Lansing, Illinois (IL) Detailed Stats
Data:
Races - White alone (%)
Races - White alone (% change since 2000)
Races - Black alone (%)
Races - Black alone (% change since 2000)
Races - American Indian alone (%)
Races - American Indian alone (% change since 2000)
Races - Asian alone (%)
Races - Asian alone (% change since 2000)
Races - Hispanic (%)
Races - Hispanic (% change since 2000)
Races - Native Hawaiian and Other Pacific Islander alone (%)
Races - Native Hawaiian and Other Pacific Islander alone (% change since 2000)
Races - Two or more races(%)
Races - Two or more races(% change since 2000)
Races - Other race alone (%)
Races - Other race alone (% change since 2000)
Racial diversity
Place of birth - Born in state of residence (%)
Place of birth - Born in state of residence (%) - White
Place of birth - Born in state of residence (%) - Black or African American
Place of birth - Born in state of residence (%) - Asian
Place of birth - Born in state of residence (%) - Hispanic or Latino
Place of birth - Born in state of residence (%) - American Indian and Alaska Native
Place of birth - Born in state of residence (%) - Multirace
Place of birth - Born in state of residence (%) - Other Race
Place of birth - Born in other state (%)
Place of birth - Born in other state (%) - White
Place of birth - Born in other state (%) - Black or African American
Place of birth - Born in other state (%) - Asian
Place of birth - Born in other state (%) - Hispanic or Latino
Place of birth - Born in other state (%) - American Indian and Alaska Native
Place of birth - Born in other state (%) - Multirace
Place of birth - Born in other state (%) - Other Race
Place of birth - Native, outside of US (%)
Place of birth - Native, outside of US (%) - White
Place of birth - Native, outside of US (%) - Black or African American
Place of birth - Native, outside of US (%) - Asian
Place of birth - Native, outside of US (%) - Hispanic or Latino
Place of birth - Native, outside of US (%) - American Indian and Alaska Native
Place of birth - Native, outside of US (%) - Multirace
Place of birth - Native, outside of US (%) - Other Race
Place of birth - Foreign born (%)
Place of birth - Foreign born (%) - White
Place of birth - Foreign born (%) - Black or African American
Place of birth - Foreign born (%) - Asian
Place of birth - Foreign born (%) - Hispanic or Latino
Place of birth - Foreign born (%) - American Indian and Alaska Native
Place of birth - Foreign born (%) - Multirace
Place of birth - Foreign born (%) - Other Race
Residents speaking English at home (%)
Residents speaking English at home - Born in the United States (%)
Residents speaking English at home - Native, born elsewhere (%)
Residents speaking English at home - Foreign born (%)
Residents speaking Spanish at home (%)
Residents speaking Spanish at home - Born in the United States (%)
Residents speaking Spanish at home - Native, born elsewhere (%)
Residents speaking Spanish at home - Foreign born (%)
Residents speaking other language at home (%)
Residents speaking other language at home - Born in the United States (%)
Residents speaking other language at home - Native, born elsewhere (%)
Residents speaking other language at home - Foreign born (%)
Marital status - Never married (%)
Marital status - Now married (%)
Marital status - Separated (%)
Marital status - Widowed (%)
Marital status - Divorced (%)
Ancestries Reported - Arab (%)
Ancestries Reported - Czech (%)
Ancestries Reported - Danish (%)
Ancestries Reported - Dutch (%)
Ancestries Reported - English (%)
Ancestries Reported - French (%)
Ancestries Reported - French Canadian (%)
Ancestries Reported - German (%)
Ancestries Reported - Greek (%)
Ancestries Reported - Hungarian (%)
Ancestries Reported - Irish (%)
Ancestries Reported - Italian (%)
Ancestries Reported - Lithuanian (%)
Ancestries Reported - Norwegian (%)
Ancestries Reported - Polish (%)
Ancestries Reported - Portuguese (%)
Ancestries Reported - Russian (%)
Ancestries Reported - Scotch-Irish (%)
Ancestries Reported - Scottish (%)
Ancestries Reported - Slovak (%)
Ancestries Reported - Subsaharan African (%)
Ancestries Reported - Swedish (%)
Ancestries Reported - Swiss (%)
Ancestries Reported - Ukrainian (%)
Ancestries Reported - United States (%)
Ancestries Reported - Welsh (%)
Ancestries Reported - West Indian (%)
Ancestries Reported - Other (%)
Geographical mobility - Same house 1 year ago (%)
Geographical mobility - Same house 1 year ago (%) - White
Geographical mobility - Same house 1 year ago (%) - Black or African American
Geographical mobility - Same house 1 year ago (%) - Asian
Geographical mobility - Same house 1 year ago (%) - Hispanic or Latino
Geographical mobility - Same house 1 year ago (%) - American Indian and Alaska Native
Geographical mobility - Same house 1 year ago (%) - Multirace
Geographical mobility - Same house 1 year ago (%) - Other Race
Geographical mobility - Moved within same county (%)
Geographical mobility - Moved within same county (%) - White
Geographical mobility - Moved within same county (%) - Black or African American
Geographical mobility - Moved within same county (%) - Asian
Geographical mobility - Moved within same county (%) - Hispanic or Latino
Geographical mobility - Moved within same county (%) - American Indian and Alaska Native
Geographical mobility - Moved within same county (%) - Multirace
Geographical mobility - Moved within same county (%) - Other Race
Geographical mobility - Moved from different county within same state (%)
Geographical mobility - Moved from different county within same state (%) - White
Geographical mobility - Moved from different county within same state (%) - Black or African American
Geographical mobility - Moved from different county within same state (%) - Asian
Geographical mobility - Moved from different county within same state (%) - Hispanic or Latino
Geographical mobility - Moved from different county within same state (%) - American Indian and Alaska Native
Geographical mobility - Moved from different county within same state (%) - Multirace
Geographical mobility - Moved from different county within same state (%) - Other Race
Geographical mobility - Moved from different state (%)
Geographical mobility - Moved from different state (%) - White
Geographical mobility - Moved from different state (%) - Black or African American
Geographical mobility - Moved from different state (%) - Asian
Geographical mobility - Moved from different state (%) - Hispanic or Latino
Geographical mobility - Moved from different state (%) - American Indian and Alaska Native
Geographical mobility - Moved from different state (%) - Multirace
Geographical mobility - Moved from different state (%) - Other Race
Geographical mobility - Moved from abroad (%)
Geographical mobility - Moved from abroad (%) - White
Geographical mobility - Moved from abroad (%) - Black or African American
Geographical mobility - Moved from abroad (%) - Asian
Geographical mobility - Moved from abroad (%) - Hispanic or Latino
Geographical mobility - Moved from abroad (%) - American Indian and Alaska Native
Geographical mobility - Moved from abroad (%) - Multirace
Geographical mobility - Moved from abroad (%) - Other Race
Place of birth for the foreign-born population - Ireland (%)
Place of birth for the foreign-born population - Denmark (%)
Place of birth for the foreign-born population - Norway (%)
Place of birth for the foreign-born population - Sweden (%)
Place of birth for the foreign-born population - United Kingdom (%)
Place of birth for the foreign-born population - England (%)
Place of birth for the foreign-born population - Scotland (%)
Place of birth for the foreign-born population - Other Northern Europe (%)
Place of birth for the foreign-born population - Austria (%)
Place of birth for the foreign-born population - Belgium (%)
Place of birth for the foreign-born population - France (%)
Place of birth for the foreign-born population - Germany (%)
Place of birth for the foreign-born population - Netherlands (%)
Place of birth for the foreign-born population - Switzerland (%)
Place of birth for the foreign-born population - Other Western Europe (%)
Place of birth for the foreign-born population - Greece (%)
Place of birth for the foreign-born population - Italy (%)
Place of birth for the foreign-born population - Portugal (%)
Place of birth for the foreign-born population - Spain (%)
Place of birth for the foreign-born population - Other Southern Europe (%)
Place of birth for the foreign-born population - Albania (%)
Place of birth for the foreign-born population - Belarus (%)
Place of birth for the foreign-born population - Bosnia and Herzegovina (%)
Place of birth for the foreign-born population - Bulgaria (%)
Place of birth for the foreign-born population - Croatia (%)
Place of birth for the foreign-born population - Czechoslovakia (%)
Place of birth for the foreign-born population - Hungary (%)
Place of birth for the foreign-born population - Latvia (%)
Place of birth for the foreign-born population - Lithuania (%)
Place of birth for the foreign-born population - North Macedonia (Macedonia) (%)
Place of birth for the foreign-born population - Moldova (%)
Place of birth for the foreign-born population - Poland (%)
Place of birth for the foreign-born population - Romania (%)
Place of birth for the foreign-born population - Russia (%)
Place of birth for the foreign-born population - Serbia (%)
Place of birth for the foreign-born population - Ukraine (%)
Place of birth for the foreign-born population - Other Eastern Europe (%)
Place of birth for the foreign-born population - China (%)
Place of birth for the foreign-born population - Hong Kong (%)
Place of birth for the foreign-born population - Taiwan (%)
Place of birth for the foreign-born population - Japan (%)
Place of birth for the foreign-born population - Korea (%)
Place of birth for the foreign-born population - Other Eastern Asia (%)
Place of birth for the foreign-born population - Afghanistan (%)
Place of birth for the foreign-born population - Bangladesh (%)
Place of birth for the foreign-born population - India (%)
Place of birth for the foreign-born population - Iran (%)
Place of birth for the foreign-born population - Kazakhstan (%)
Place of birth for the foreign-born population - Nepal (%)
Place of birth for the foreign-born population - Pakistan (%)
Place of birth for the foreign-born population - Sri Lanka (%)
Place of birth for the foreign-born population - Uzbekistan (%)
Place of birth for the foreign-born population - Other South Central Asia (%)
Place of birth for the foreign-born population - Burma (%)
Place of birth for the foreign-born population - Cambodia (%)
Place of birth for the foreign-born population - Indonesia (%)
Place of birth for the foreign-born population - Laos (%)
Place of birth for the foreign-born population - Malaysia (%)
Place of birth for the foreign-born population - Philippines (%)
Place of birth for the foreign-born population - Singapore (%)
Place of birth for the foreign-born population - Thailand (%)
Place of birth for the foreign-born population - Vietnam (%)
Place of birth for the foreign-born population - Other South Eastern Asia (%)
Place of birth for the foreign-born population - Armenia (%)
Place of birth for the foreign-born population - Iraq (%)
Place of birth for the foreign-born population - Israel (%)
Place of birth for the foreign-born population - Jordan (%)
Place of birth for the foreign-born population - Kuwait (%)
Place of birth for the foreign-born population - Lebanon (%)
Place of birth for the foreign-born population - Saudi Arabia (%)
Place of birth for the foreign-born population - Syria (%)
Place of birth for the foreign-born population - Turkey (%)
Place of birth for the foreign-born population - Yemen (%)
Place of birth for the foreign-born population - Other Western Asia (%)
Place of birth for the foreign-born population - Eritrea (%)
Place of birth for the foreign-born population - Ethiopia (%)
Place of birth for the foreign-born population - Kenya (%)
Place of birth for the foreign-born population - Somalia (%)
Place of birth for the foreign-born population - Uganda (%)
Place of birth for the foreign-born population - Zimbabwe (%)
Place of birth for the foreign-born population - Other Eastern Africa (%)
Place of birth for the foreign-born population - Cameroon (%)
Place of birth for the foreign-born population - Congo (%)
Place of birth for the foreign-born population - Democratic Republic of Congo (Zaire) (%)
Place of birth for the foreign-born population - Other Middle Africa (%)
Place of birth for the foreign-born population - Egypt (%)
Place of birth for the foreign-born population - Morocco (%)
Place of birth for the foreign-born population - Sudan (%)
Place of birth for the foreign-born population - Other Northern Africa (%)
Place of birth for the foreign-born population - South Africa (%)
Place of birth for the foreign-born population - Other Southern Africa (%)
Place of birth for the foreign-born population - Cabo Verde (%)
Place of birth for the foreign-born population - Ghana (%)
Place of birth for the foreign-born population - Liberia (%)
Place of birth for the foreign-born population - Nigeria (%)
Place of birth for the foreign-born population - Senegal (%)
Place of birth for the foreign-born population - Sierra Leone (%)
Place of birth for the foreign-born population - Other Western Africa (%)
Place of birth for the foreign-born population - Australia (%)
Place of birth for the foreign-born population - New Zealand (%)
Place of birth for the foreign-born population - Fiji (%)
Place of birth for the foreign-born population - Micronesia (%)
Place of birth for the foreign-born population - Bahamas (%)
Place of birth for the foreign-born population - Barbados (%)
Place of birth for the foreign-born population - Cuba (%)
Place of birth for the foreign-born population - Dominica (%)
Place of birth for the foreign-born population - Dominican Republic (%)
Place of birth for the foreign-born population - Grenada (%)
Place of birth for the foreign-born population - Haiti (%)
Place of birth for the foreign-born population - Jamaica (%)
Place of birth for the foreign-born population - St. Vincent and the Grenadines (%)
Place of birth for the foreign-born population - Trinidad and Tobago (%)
Place of birth for the foreign-born population - West Indies (%)
Place of birth for the foreign-born population - Other Caribbean (%)
Place of birth for the foreign-born population - Belize (%)
Place of birth for the foreign-born population - Costa Rica (%)
Place of birth for the foreign-born population - El Salvador (%)
Place of birth for the foreign-born population - Guatemala (%)
Place of birth for the foreign-born population - Honduras (%)
Place of birth for the foreign-born population - Mexico (%)
Place of birth for the foreign-born population - Nicaragua (%)
Place of birth for the foreign-born population - Panama (%)
Place of birth for the foreign-born population - Other Central America (%)
Place of birth for the foreign-born population - Argentina (%)
Place of birth for the foreign-born population - Bolivia (%)
Place of birth for the foreign-born population - Brazil (%)
Place of birth for the foreign-born population - Chile (%)
Place of birth for the foreign-born population - Colombia (%)
Place of birth for the foreign-born population - Ecuador (%)
Place of birth for the foreign-born population - Guyana (%)
Place of birth for the foreign-born population - Peru (%)
Place of birth for the foreign-born population - Uruguay (%)
Place of birth for the foreign-born population - Venezuela (%)
Place of birth for the foreign-born population - Other South America (%)
Place of birth for the foreign-born population - Canada (%)
Place of birth for the foreign-born population - Other Northern America (%)
Place of birth for the foreign-born population - Other (%)
Latest news about races in Lansing, IL collected exclusively by city-data.com from local newspapers, TV, and radio stations
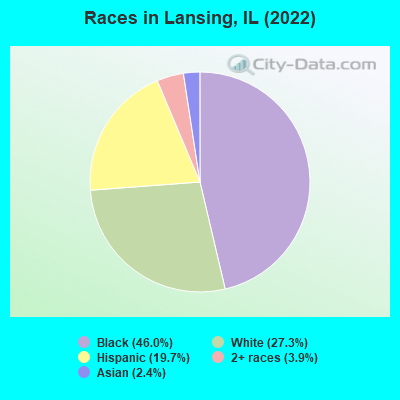
According to 2022 data, the most numerous races in Lansing, IL are White alone (7,676 residents), Hispanic (5,534 residents), and Black alone (12,922 residents). 81.5% of Lansing residents speak English at home. 10.5% of Lansing, IL residents are foreign-born (6.1% born in Latin America, 2.0% born in Asia, 1.5% born in Africa), which is 34.0% less than the foreign-born rate of 14.0% across the entire state of Illinois.
Race distribution in Lansing
2000 2022
8,424,140 67.8% White alone 1,856,152 14.9% Black alone 1,530,262 12.3% Hispanic 419,916 3.4% Asian alone 153,996 1.2% Two or more races 13,479 0.1% Other race alone 18,232 0.1% American Indian alone 3,116 0.03% Native Hawaiian and Other
7,356,301 58.5% White alone 2,299,726 18.3% Hispanic 1,660,423 13.2% Black alone 747,296 5.9% Asian alone 458,599 3.6% Two or more races 45,386 0.4% Other race alone 10,405 0.08% American Indian alone 3,896 0.03% Native Hawaiian and Other
Income and house value in Lansing Median household income in 2022 $73,689 White non-Hispanic householders$58,371 Black householdersover $200,000 Asian householders$90,559 Some other race householders$107,972 Two or more races householders$79,169 Hispanic or Latino race householdersMedian 2022 house value $166,103 White Non-Hispanic householders$185,777 Black or African American householders $175,659 Asian householders$193,225 Native Hawaiian and other Pacific Islander householders$184,513 Some other race householders$184,513 Two or more races householders$164,136 Hispanic or Latino householders
Median age by race in Lansing
50.2 Median age for White residents48.1 54.0 32.3 Median age for Black or African American residents30.7 35.5 8.6 Median age for American Indian / Alaska Native residents0.0 28.3 87.9 Median age for Asian residents85.5 87.8 -687,999,999.3 Median age for Native Hawaiian / Pacific Islander residents-918,721,460.3 -610,229,276.3 37.7 Median age for Other race residents33.2 40.0 29.5 Median age for Two or more races residents30.0 29.2 56.3 Median age for White alone residents51.2 58.4 35.8 Median age for Hispanic or Latino residents32.9 36.4
Owner/renter occupied households by race in Lansing
House owners and renters - White residents 3,566 84.8% Owner occupied638 15.2% Renter occupiedHouse owners and renters - Black or African American residents 3,046 57.7% Owner occupied2,231 42.3% Renter occupiedHouse owners and renters - American Indian / Alaska Native residents 17 100.0% Owner occupiedHouse owners and renters - Asian residents 152 77.4% Owner occupied44 22.6% Renter occupiedHouse owners and renters - Other race residents 687 83.4% Owner occupied137 16.6% Renter occupiedHouse owners and renters - Two or more races residents 647 74.5% Owner occupied221 25.5% Renter occupiedHouse owners and renters - White alone residents 3,244 86.0% Owner occupied530 14.0% Renter occupiedHouse owners and renters - Hispanic or Latino residents 1,446 78.6% Owner occupied395 21.4% Renter occupied
Language usage in Lansing
English speakers - Total 81.5% of residents of Lansing speak English at home.
14.0% of residents speak Spanish at home 2,407 63.9% Speak English very well1,357 36.1% Speak English less than very well3.9% of residents speak other language at home 581 54.7% Speak English very well482 45.3% Speak English less than very well
English speakers - Born in the United States 88.0% of residents of Lansing speak English at home.
9.7% of residents speak Spanish at home 469 81.4% Speak English very well107 18.6% Speak English less than very well1.9% of residents speak other language at home 110 100.0% Speak English very well
English speakers - Native, born elsewhere 52.4% of residents of Lansing speak English at home.
10.5% of residents speak Spanish at home 11 100.0% Speak English less than very well36.2% of residents speak other language at home 38 100.0% Speak English very well
English speakers - Foreign-born 15.1% of residents of Lansing speak English at home.
57.2% of residents speak Spanish at home 576 34.3% Speak English very well1,103 65.7% Speak English less than very well27.5% of residents speak other language at home 326 40.4% Speak English very well480 59.6% Speak English less than very well
White (Caucasian) - Speak only English Native:
92.6% (7,689)Foreign-born:
12.0% (79)
White (Caucasian) - Speak another language Native:
8.5% (704)Foreign-born:
87.8% (577)
Black or African American - Speak only English Native:
99.4% (11,791)Foreign-born:
40.7% (190)
Black or African American - Speak another language Native:
0.6% (70)Foreign-born:
60.1% (280)
American Indian / Alaska Native - Speak another language Native:
100.0% (54)Foreign-born:
100.0% (33)
Asian - Speak only English Native:
77.5% (100)Foreign-born:
20.7% (112)
Asian - Speak another language Native:
22.7% (29)Foreign-born:
77.9% (424)
Other race - Speak only English Native:
25.9% (347)Foreign-born:
1.6% (15)
Other race - Speak another language Native:
74.2% (995)Foreign-born:
98.7% (874)
Two or more races - Speak only English Native:
76.9% (1,626)Foreign-born:
25.7% (97)
Two or more races - Speak another language Native:
20.9% (441)Foreign-born:
74.3% (280)
White alone - Speak only English Native:
96.6% (7,232)Foreign-born:
51.4% (79)
White alone - Speak another language Native:
2.8% (213)Foreign-born:
44.4% (68)
Hispanic or Latino - Speak only English Native:
42.7% (1,509)Foreign-born:
1.2% (21)
Hispanic or Latino - Speak another language Native:
57.9% (2,045)Foreign-born:
99.2% (1,681)
Foreign-born residents in Lansing 2,934 residents are foreign born (6.1% Latin America , 2.0% Asia , 1.5% Africa ).
This city:
10.5%Illinois:
14.1%
Marital status for residents in Lansing Marital status - White (Caucasian) population 15 years and over
Males 37.6% Never married50.0% Now married0.2% Separated2.8% Widowed9.4% DivorcedFemales 33.5% Never married46.7% Now married0.5% Separated8.4% Widowed10.9% DivorcedWomen who gave birth in the past 12 months Now married:
33.3% (5)Unmarried:
66.7% (10)
Women who did not give birth in the past 12 months Now married:
40.3% (719)Unmarried:
59.7% (1,064)
Marital status - Black or African American population 15 years and over
Males 60.5% Never married28.7% Now married1.5% Separated1.1% Widowed8.1% DivorcedFemales 59.3% Never married22.1% Now married1.5% Separated6.5% Widowed10.6% DivorcedWomen who gave birth in the past 12 months Now married:
28.6% (75)Unmarried:
71.4% (186)
Women who did not give birth in the past 12 months Now married:
14.1% (449)Unmarried:
85.9% (2,726)
Marital status - American Indian / Alaska Native population 15 years and over
Males 0.0% Never married100.0% Now married0.0% Separated0.0% Widowed0.0% DivorcedFemales 55.0% Never married45.0% Now married0.0% Separated0.0% Widowed0.0% DivorcedWomen who gave birth in the past 12 months Now married:
100.0% (16)Unmarried:
0.0% (0)
Women who did not give birth in the past 12 months Now married:
0.0% (0)Unmarried:
100.0% (20)
Marital status - Asian population 15 years and over
Males 91.8% Never married6.5% Now married0.0% Separated0.0% Widowed1.7% DivorcedFemales 10.9% Never married9.5% Now married0.0% Separated35.9% Widowed43.7% DivorcedWomen who did not give birth in the past 12 months Now married:
0.0% (0)Unmarried:
100.0% (43)
Marital status - Other race population 15 years and over
Males 54.3% Never married40.1% Now married0.0% Separated0.0% Widowed5.5% DivorcedFemales 23.8% Never married44.2% Now married12.6% Separated16.9% Widowed2.5% DivorcedWomen who gave birth in the past 12 months Now married:
100.0% (15)Unmarried:
0.0% (0)
Women who did not give birth in the past 12 months Now married:
63.9% (265)Unmarried:
36.1% (150)
Marital status - Two or more races population 15 years and over
Males 41.4% Never married46.8% Now married1.2% Separated4.0% Widowed6.6% DivorcedFemales 46.4% Never married32.6% Now married0.0% Separated7.7% Widowed13.4% DivorcedWomen who gave birth in the past 12 months Now married:
100.0% (44)Unmarried:
0.0% (0)
Women who did not give birth in the past 12 months Now married:
56.1% (166)Unmarried:
43.9% (130)
Marital status - White alone, not Hispanic / Latino population 15 years and over
Males 38.1% Never married48.7% Now married0.3% Separated2.7% Widowed10.3% DivorcedFemales 30.0% Never married47.6% Now married0.0% Separated9.7% Widowed12.7% DivorcedWomen who gave birth in the past 12 months Now married:
0.0% (0)Unmarried:
100.0% (7)
Women who did not give birth in the past 12 months Now married:
38.9% (502)Unmarried:
61.1% (787)
Marital status - Hispanic or Latino population 15 years and over
Males 44.3% Never married49.5% Now married0.0% Separated1.1% Widowed5.1% DivorcedFemales 40.9% Never married40.3% Now married5.9% Separated6.7% Widowed6.2% DivorcedWomen who gave birth in the past 12 months Now married:
84.8% (28)Unmarried:
15.2% (5)
Women who did not give birth in the past 12 months Now married:
52.2% (637)Unmarried:
47.8% (583)
Ancestries in Lansing
665 4.0% Polish365 2.2% Dutch336 2.0% German273 1.6% Nigerian236 1.4% African231 1.4% Italian205 1.2% Irish190 1.1% Serbian183 1.1% English173 1.0% American113 0.7% Croatian50 0.3% European42 0.3% Haitian32 0.2% Jamaican28 0.2% Greek23 0.1% Swedish17 0.1% French16 0.10% Maltese15 0.09% Scotch-Irish13 0.08% Scandinavian12 0.07% Scottish10 0.06% Hungarian9 0.05% Romanian8 0.05% Pennsylvania German5 0.03% Russian5 0.03% Slovak4 0.02% Barbadian
Geographical mobility in Lansing Same house 1 year ago 8,218 92.0% White (Caucasian)10,770 83.8% Black or African American67 77.8% American Indian / Alaska Native665 99.0% Asian2,240 95.6% Other race2,524 94.7% Two or more races7,355 95.6% White alone, not Hispanic / Latino4,911 89.4% Hispanic or LatinoMoved within same county 574 6.4% White / Caucasian1,677 13.0% Black or African American21 24.5% American Indian / Alaska Native84 3.6% Other race105 3.9% Two or more races218 2.8% White alone, not Hispanic / Latino504 9.2% Hispanic or LatinoMoved within same state 11 0.1% White / Caucasian87 0.7% Black or African American39 1.7% Other race5 0.2% Two or more races12 0.2% White alone, not Hispanic / Latino32 0.6% Hispanic or LatinoMoved from different state 61 0.7% White / Caucasian17 0.1% Black or African American59 0.8% White alone, not Hispanic / Latino4 0.1% Hispanic or LatinoMoved from abroad 190 1.5% Black or African American
Children Nativity (place of birth) in Lansing
Children under 6 years - Living with two parents Both parents native 125 100.0% NativeBoth parents foreign-born 87 100.0% NativeOne native, one foreign-born parent 140 100.0% NativeChildren under 6 years - Living with one parent Native parent 996 100.0% NativeForeign-born parent 43 100.0% NativeChildren 6 to 17 years - Living with two parents Both parents native 1,257 100.0% NativeBoth parents foreign-born 204 87.8% Native28 12.2% Foreign-bornOne native, one foreign-born parent 517 100.0% NativeChildren 6 to 17 years - Living with one parent Native parent 2,284 96.6% Native81 3.4% Foreign-bornForeign-born parent 304 73.0% Native112 27.0% Foreign-born
Grandparents responsible for own grandchildren in Lansing
Grandparents (30 to 59 years) White / Caucasian 125 89.6% Responsible for grandchildren15 10.4% Not responsible for grandchildrenBlack or African American 163 54.0% Responsible for grandchildren139 46.0% Not responsible for grandchildrenWhite alone, not Hispanic / Latino 111 90.0% Responsible for grandchildren12 10.0% Not responsible for grandchildrenHispanic or Latino 68 100.0% Responsible for grandchildren
Grandparents (60 years and over) White / Caucasian 17 100.0% Responsible for grandchildrenBlack or African American 65 100.0% Not responsible for grandchildrenWhite alone, not Hispanic / Latino 21 100.0% Responsible for grandchildren