Races in Las Cruces, New Mexico (NM) Detailed Stats
Data:
Races - White alone (%)
Races - White alone (% change since 2000)
Races - Black alone (%)
Races - Black alone (% change since 2000)
Races - American Indian alone (%)
Races - American Indian alone (% change since 2000)
Races - Asian alone (%)
Races - Asian alone (% change since 2000)
Races - Hispanic (%)
Races - Hispanic (% change since 2000)
Races - Native Hawaiian and Other Pacific Islander alone (%)
Races - Native Hawaiian and Other Pacific Islander alone (% change since 2000)
Races - Two or more races(%)
Races - Two or more races(% change since 2000)
Races - Other race alone (%)
Races - Other race alone (% change since 2000)
Racial diversity
Place of birth - Born in state of residence (%)
Place of birth - Born in state of residence (%) - White
Place of birth - Born in state of residence (%) - Black or African American
Place of birth - Born in state of residence (%) - Asian
Place of birth - Born in state of residence (%) - Hispanic or Latino
Place of birth - Born in state of residence (%) - American Indian and Alaska Native
Place of birth - Born in state of residence (%) - Multirace
Place of birth - Born in state of residence (%) - Other Race
Place of birth - Born in other state (%)
Place of birth - Born in other state (%) - White
Place of birth - Born in other state (%) - Black or African American
Place of birth - Born in other state (%) - Asian
Place of birth - Born in other state (%) - Hispanic or Latino
Place of birth - Born in other state (%) - American Indian and Alaska Native
Place of birth - Born in other state (%) - Multirace
Place of birth - Born in other state (%) - Other Race
Place of birth - Native, outside of US (%)
Place of birth - Native, outside of US (%) - White
Place of birth - Native, outside of US (%) - Black or African American
Place of birth - Native, outside of US (%) - Asian
Place of birth - Native, outside of US (%) - Hispanic or Latino
Place of birth - Native, outside of US (%) - American Indian and Alaska Native
Place of birth - Native, outside of US (%) - Multirace
Place of birth - Native, outside of US (%) - Other Race
Place of birth - Foreign born (%)
Place of birth - Foreign born (%) - White
Place of birth - Foreign born (%) - Black or African American
Place of birth - Foreign born (%) - Asian
Place of birth - Foreign born (%) - Hispanic or Latino
Place of birth - Foreign born (%) - American Indian and Alaska Native
Place of birth - Foreign born (%) - Multirace
Place of birth - Foreign born (%) - Other Race
Residents speaking English at home (%)
Residents speaking English at home - Born in the United States (%)
Residents speaking English at home - Native, born elsewhere (%)
Residents speaking English at home - Foreign born (%)
Residents speaking Spanish at home (%)
Residents speaking Spanish at home - Born in the United States (%)
Residents speaking Spanish at home - Native, born elsewhere (%)
Residents speaking Spanish at home - Foreign born (%)
Residents speaking other language at home (%)
Residents speaking other language at home - Born in the United States (%)
Residents speaking other language at home - Native, born elsewhere (%)
Residents speaking other language at home - Foreign born (%)
Marital status - Never married (%)
Marital status - Now married (%)
Marital status - Separated (%)
Marital status - Widowed (%)
Marital status - Divorced (%)
Ancestries Reported - Arab (%)
Ancestries Reported - Czech (%)
Ancestries Reported - Danish (%)
Ancestries Reported - Dutch (%)
Ancestries Reported - English (%)
Ancestries Reported - French (%)
Ancestries Reported - French Canadian (%)
Ancestries Reported - German (%)
Ancestries Reported - Greek (%)
Ancestries Reported - Hungarian (%)
Ancestries Reported - Irish (%)
Ancestries Reported - Italian (%)
Ancestries Reported - Lithuanian (%)
Ancestries Reported - Norwegian (%)
Ancestries Reported - Polish (%)
Ancestries Reported - Portuguese (%)
Ancestries Reported - Russian (%)
Ancestries Reported - Scotch-Irish (%)
Ancestries Reported - Scottish (%)
Ancestries Reported - Slovak (%)
Ancestries Reported - Subsaharan African (%)
Ancestries Reported - Swedish (%)
Ancestries Reported - Swiss (%)
Ancestries Reported - Ukrainian (%)
Ancestries Reported - United States (%)
Ancestries Reported - Welsh (%)
Ancestries Reported - West Indian (%)
Ancestries Reported - Other (%)
Geographical mobility - Same house 1 year ago (%)
Geographical mobility - Same house 1 year ago (%) - White
Geographical mobility - Same house 1 year ago (%) - Black or African American
Geographical mobility - Same house 1 year ago (%) - Asian
Geographical mobility - Same house 1 year ago (%) - Hispanic or Latino
Geographical mobility - Same house 1 year ago (%) - American Indian and Alaska Native
Geographical mobility - Same house 1 year ago (%) - Multirace
Geographical mobility - Same house 1 year ago (%) - Other Race
Geographical mobility - Moved within same county (%)
Geographical mobility - Moved within same county (%) - White
Geographical mobility - Moved within same county (%) - Black or African American
Geographical mobility - Moved within same county (%) - Asian
Geographical mobility - Moved within same county (%) - Hispanic or Latino
Geographical mobility - Moved within same county (%) - American Indian and Alaska Native
Geographical mobility - Moved within same county (%) - Multirace
Geographical mobility - Moved within same county (%) - Other Race
Geographical mobility - Moved from different county within same state (%)
Geographical mobility - Moved from different county within same state (%) - White
Geographical mobility - Moved from different county within same state (%) - Black or African American
Geographical mobility - Moved from different county within same state (%) - Asian
Geographical mobility - Moved from different county within same state (%) - Hispanic or Latino
Geographical mobility - Moved from different county within same state (%) - American Indian and Alaska Native
Geographical mobility - Moved from different county within same state (%) - Multirace
Geographical mobility - Moved from different county within same state (%) - Other Race
Geographical mobility - Moved from different state (%)
Geographical mobility - Moved from different state (%) - White
Geographical mobility - Moved from different state (%) - Black or African American
Geographical mobility - Moved from different state (%) - Asian
Geographical mobility - Moved from different state (%) - Hispanic or Latino
Geographical mobility - Moved from different state (%) - American Indian and Alaska Native
Geographical mobility - Moved from different state (%) - Multirace
Geographical mobility - Moved from different state (%) - Other Race
Geographical mobility - Moved from abroad (%)
Geographical mobility - Moved from abroad (%) - White
Geographical mobility - Moved from abroad (%) - Black or African American
Geographical mobility - Moved from abroad (%) - Asian
Geographical mobility - Moved from abroad (%) - Hispanic or Latino
Geographical mobility - Moved from abroad (%) - American Indian and Alaska Native
Geographical mobility - Moved from abroad (%) - Multirace
Geographical mobility - Moved from abroad (%) - Other Race
Place of birth for the foreign-born population - Ireland (%)
Place of birth for the foreign-born population - Denmark (%)
Place of birth for the foreign-born population - Norway (%)
Place of birth for the foreign-born population - Sweden (%)
Place of birth for the foreign-born population - United Kingdom (%)
Place of birth for the foreign-born population - England (%)
Place of birth for the foreign-born population - Scotland (%)
Place of birth for the foreign-born population - Other Northern Europe (%)
Place of birth for the foreign-born population - Austria (%)
Place of birth for the foreign-born population - Belgium (%)
Place of birth for the foreign-born population - France (%)
Place of birth for the foreign-born population - Germany (%)
Place of birth for the foreign-born population - Netherlands (%)
Place of birth for the foreign-born population - Switzerland (%)
Place of birth for the foreign-born population - Other Western Europe (%)
Place of birth for the foreign-born population - Greece (%)
Place of birth for the foreign-born population - Italy (%)
Place of birth for the foreign-born population - Portugal (%)
Place of birth for the foreign-born population - Spain (%)
Place of birth for the foreign-born population - Other Southern Europe (%)
Place of birth for the foreign-born population - Albania (%)
Place of birth for the foreign-born population - Belarus (%)
Place of birth for the foreign-born population - Bosnia and Herzegovina (%)
Place of birth for the foreign-born population - Bulgaria (%)
Place of birth for the foreign-born population - Croatia (%)
Place of birth for the foreign-born population - Czechoslovakia (%)
Place of birth for the foreign-born population - Hungary (%)
Place of birth for the foreign-born population - Latvia (%)
Place of birth for the foreign-born population - Lithuania (%)
Place of birth for the foreign-born population - North Macedonia (Macedonia) (%)
Place of birth for the foreign-born population - Moldova (%)
Place of birth for the foreign-born population - Poland (%)
Place of birth for the foreign-born population - Romania (%)
Place of birth for the foreign-born population - Russia (%)
Place of birth for the foreign-born population - Serbia (%)
Place of birth for the foreign-born population - Ukraine (%)
Place of birth for the foreign-born population - Other Eastern Europe (%)
Place of birth for the foreign-born population - China (%)
Place of birth for the foreign-born population - Hong Kong (%)
Place of birth for the foreign-born population - Taiwan (%)
Place of birth for the foreign-born population - Japan (%)
Place of birth for the foreign-born population - Korea (%)
Place of birth for the foreign-born population - Other Eastern Asia (%)
Place of birth for the foreign-born population - Afghanistan (%)
Place of birth for the foreign-born population - Bangladesh (%)
Place of birth for the foreign-born population - India (%)
Place of birth for the foreign-born population - Iran (%)
Place of birth for the foreign-born population - Kazakhstan (%)
Place of birth for the foreign-born population - Nepal (%)
Place of birth for the foreign-born population - Pakistan (%)
Place of birth for the foreign-born population - Sri Lanka (%)
Place of birth for the foreign-born population - Uzbekistan (%)
Place of birth for the foreign-born population - Other South Central Asia (%)
Place of birth for the foreign-born population - Burma (%)
Place of birth for the foreign-born population - Cambodia (%)
Place of birth for the foreign-born population - Indonesia (%)
Place of birth for the foreign-born population - Laos (%)
Place of birth for the foreign-born population - Malaysia (%)
Place of birth for the foreign-born population - Philippines (%)
Place of birth for the foreign-born population - Singapore (%)
Place of birth for the foreign-born population - Thailand (%)
Place of birth for the foreign-born population - Vietnam (%)
Place of birth for the foreign-born population - Other South Eastern Asia (%)
Place of birth for the foreign-born population - Armenia (%)
Place of birth for the foreign-born population - Iraq (%)
Place of birth for the foreign-born population - Israel (%)
Place of birth for the foreign-born population - Jordan (%)
Place of birth for the foreign-born population - Kuwait (%)
Place of birth for the foreign-born population - Lebanon (%)
Place of birth for the foreign-born population - Saudi Arabia (%)
Place of birth for the foreign-born population - Syria (%)
Place of birth for the foreign-born population - Turkey (%)
Place of birth for the foreign-born population - Yemen (%)
Place of birth for the foreign-born population - Other Western Asia (%)
Place of birth for the foreign-born population - Eritrea (%)
Place of birth for the foreign-born population - Ethiopia (%)
Place of birth for the foreign-born population - Kenya (%)
Place of birth for the foreign-born population - Somalia (%)
Place of birth for the foreign-born population - Uganda (%)
Place of birth for the foreign-born population - Zimbabwe (%)
Place of birth for the foreign-born population - Other Eastern Africa (%)
Place of birth for the foreign-born population - Cameroon (%)
Place of birth for the foreign-born population - Congo (%)
Place of birth for the foreign-born population - Democratic Republic of Congo (Zaire) (%)
Place of birth for the foreign-born population - Other Middle Africa (%)
Place of birth for the foreign-born population - Egypt (%)
Place of birth for the foreign-born population - Morocco (%)
Place of birth for the foreign-born population - Sudan (%)
Place of birth for the foreign-born population - Other Northern Africa (%)
Place of birth for the foreign-born population - South Africa (%)
Place of birth for the foreign-born population - Other Southern Africa (%)
Place of birth for the foreign-born population - Cabo Verde (%)
Place of birth for the foreign-born population - Ghana (%)
Place of birth for the foreign-born population - Liberia (%)
Place of birth for the foreign-born population - Nigeria (%)
Place of birth for the foreign-born population - Senegal (%)
Place of birth for the foreign-born population - Sierra Leone (%)
Place of birth for the foreign-born population - Other Western Africa (%)
Place of birth for the foreign-born population - Australia (%)
Place of birth for the foreign-born population - New Zealand (%)
Place of birth for the foreign-born population - Fiji (%)
Place of birth for the foreign-born population - Micronesia (%)
Place of birth for the foreign-born population - Bahamas (%)
Place of birth for the foreign-born population - Barbados (%)
Place of birth for the foreign-born population - Cuba (%)
Place of birth for the foreign-born population - Dominica (%)
Place of birth for the foreign-born population - Dominican Republic (%)
Place of birth for the foreign-born population - Grenada (%)
Place of birth for the foreign-born population - Haiti (%)
Place of birth for the foreign-born population - Jamaica (%)
Place of birth for the foreign-born population - St. Vincent and the Grenadines (%)
Place of birth for the foreign-born population - Trinidad and Tobago (%)
Place of birth for the foreign-born population - West Indies (%)
Place of birth for the foreign-born population - Other Caribbean (%)
Place of birth for the foreign-born population - Belize (%)
Place of birth for the foreign-born population - Costa Rica (%)
Place of birth for the foreign-born population - El Salvador (%)
Place of birth for the foreign-born population - Guatemala (%)
Place of birth for the foreign-born population - Honduras (%)
Place of birth for the foreign-born population - Mexico (%)
Place of birth for the foreign-born population - Nicaragua (%)
Place of birth for the foreign-born population - Panama (%)
Place of birth for the foreign-born population - Other Central America (%)
Place of birth for the foreign-born population - Argentina (%)
Place of birth for the foreign-born population - Bolivia (%)
Place of birth for the foreign-born population - Brazil (%)
Place of birth for the foreign-born population - Chile (%)
Place of birth for the foreign-born population - Colombia (%)
Place of birth for the foreign-born population - Ecuador (%)
Place of birth for the foreign-born population - Guyana (%)
Place of birth for the foreign-born population - Peru (%)
Place of birth for the foreign-born population - Uruguay (%)
Place of birth for the foreign-born population - Venezuela (%)
Place of birth for the foreign-born population - Other South America (%)
Place of birth for the foreign-born population - Canada (%)
Place of birth for the foreign-born population - Other Northern America (%)
Place of birth for the foreign-born population - Other (%)
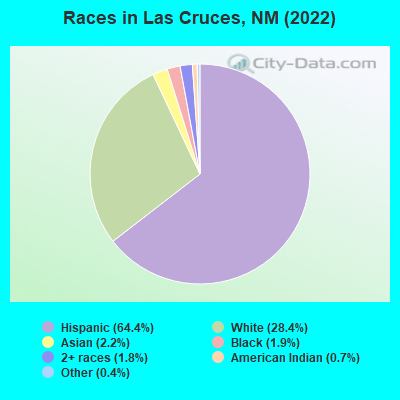
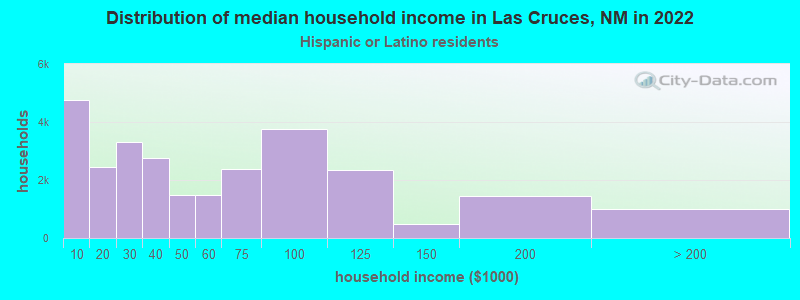
According to 2022 data, the most numerous races in Las Cruces, NM are Hispanic (73,381 residents), White alone (32,389 residents), and American Indian alone (822 residents). 63.2% of Las Cruces residents speak English at home. 10.7% of Las Cruces, NM residents are foreign-born (7.5% born in Latin America, 1.9% born in Asia), which is 16.1% greater than the foreign-born rate of 9.0% across the entire state of New Mexico.
Race distribution in Las Cruces
2000 2022
813,495 44.7% White alone 765,386 42.1% Hispanic 161,460 8.9% American Indian alone 30,654 1.7% Black alone 25,793 1.4% Two or more races 18,257 1.0% Asian alone 3,009 0.2% Other race alone 992 0.05% Native Hawaiian and Other
1,059,867 50.2% Hispanic 735,478 34.8% White alone 171,808 8.1% American Indian alone 65,084 3.1% Two or more races 36,870 1.7% Black alone 35,870 1.7% Asian alone 7,582 0.4% Other race alone 785 0.04% Native Hawaiian and Other
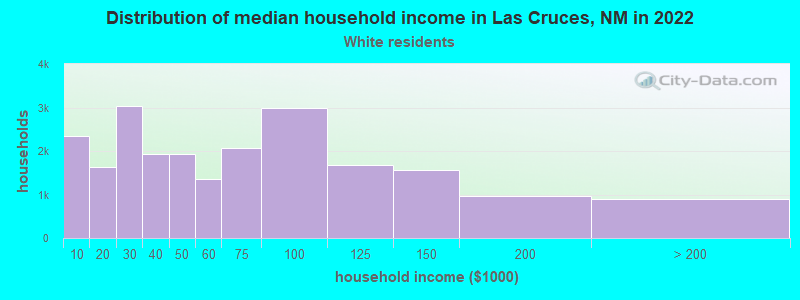
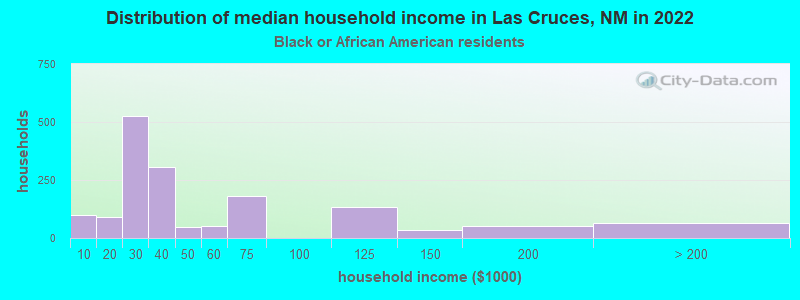
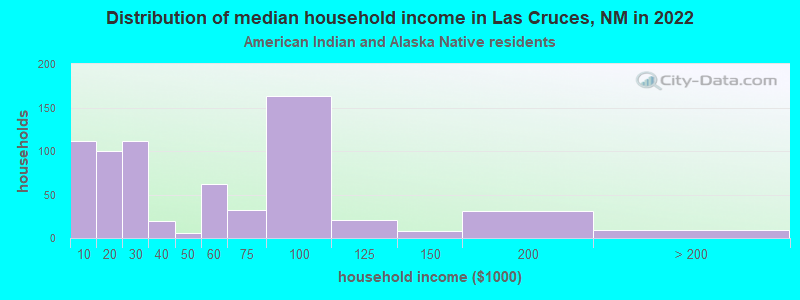
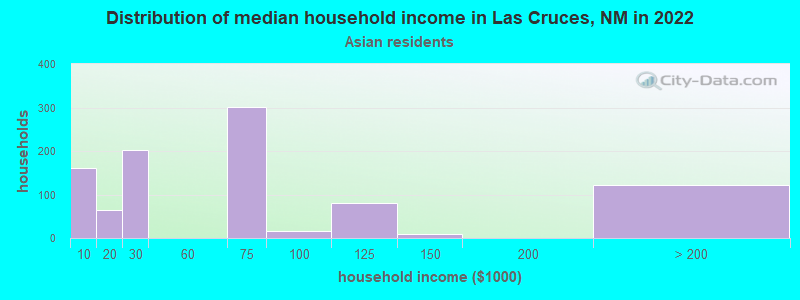
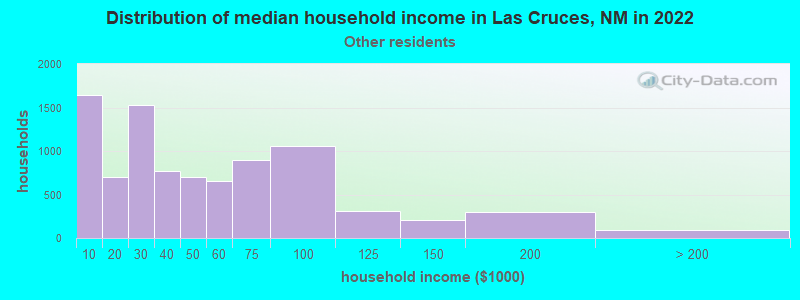
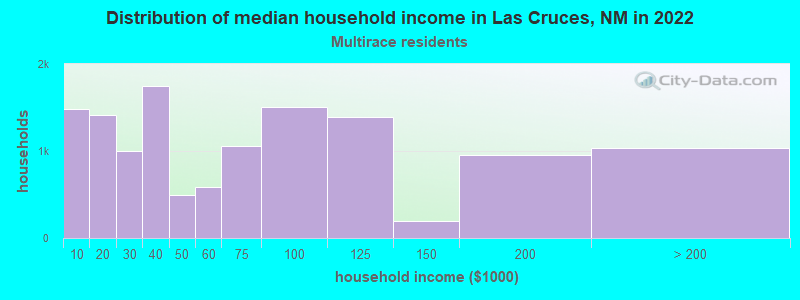
Income and house value in Las Cruces Median household income in 2022 $58,458 White non-Hispanic householders$39,663 Black householders$93,046 American Indian and Alaska Native householders$64,246 Asian householders$32,349 Some other race householders$53,250 Two or more races householders$44,422 Hispanic or Latino race householdersMedian 2022 house value $262,889 White Non-Hispanic householders$335,512 Black or African American householders$216,260 American Indian or Alaska Native householders $353,198 Asian householders$73,694 Native Hawaiian and other Pacific Islander householders$210,632 Some other race householders$222,960 Two or more races householders$209,025 Hispanic or Latino householders
Median age by race in Las Cruces
38.5 Median age for White residents38.1 38.9 32.0 Median age for Black or African American residents32.7 24.1 31.7 Median age for American Indian / Alaska Native residents47.2 31.7 31.6 Median age for Asian residents36.2 31.2 15.7 Median age for Native Hawaiian / Pacific Islander residents-666,666,666.0 21.4 26.9 Median age for Other race residents26.5 27.3 32.7 Median age for Two or more races residents31.7 33.0 51.5 Median age for White alone residents50.4 53.2 28.2 Median age for Hispanic or Latino residents28.6 27.7
Owner/renter occupied households by race in Las Cruces
House owners and renters - White residents 13,701 61.2% Owner occupied8,700 38.8% Renter occupiedHouse owners and renters - Black or African American residents 1,075 57.4% Owner occupied797 42.6% Renter occupiedHouse owners and renters - American Indian / Alaska Native residents 330 44.7% Owner occupied408 55.3% Renter occupiedHouse owners and renters - Asian residents 97 10.3% Owner occupied841 89.7% Renter occupiedHouse owners and renters - Native Hawaiian / Pacific Islander residents 162 100.0% Renter occupiedHouse owners and renters - Other race residents 4,226 51.4% Owner occupied3,991 48.6% Renter occupiedHouse owners and renters - Two or more races residents 7,253 56.4% Owner occupied5,607 43.6% Renter occupiedHouse owners and renters - White alone residents 10,703 67.6% Owner occupied5,124 32.4% Renter occupiedHouse owners and renters - Hispanic or Latino residents 14,156 51.1% Owner occupied13,527 48.9% Renter occupied
Language usage in Las Cruces
English speakers - Total 63.2% of residents of Las Cruces speak English at home.
34.5% of residents speak Spanish at home 26,174 70.3% Speak English very well11,082 29.7% Speak English less than very well2.3% of residents speak other language at home 1,571 64.4% Speak English very well867 35.6% Speak English less than very well
English speakers - Born in the United States 80.3% of residents of Las Cruces speak English at home.
18.2% of residents speak Spanish at home 6,499 86.2% Speak English very well1,040 13.8% Speak English less than very well1.5% of residents speak other language at home 615 100.0% Speak English very well
English speakers - Native, born elsewhere 62.4% of residents of Las Cruces speak English at home.
37.6% of residents speak Spanish at home 413 90.4% Speak English very well44 9.6% Speak English less than very well
English speakers - Foreign-born 13.1% of residents of Las Cruces speak English at home.
75.9% of residents speak Spanish at home 4,411 44.0% Speak English very well5,623 56.0% Speak English less than very well11.1% of residents speak other language at home 598 40.8% Speak English very well867 59.2% Speak English less than very well
White (Caucasian) - Speak only English Native:
83.3% (39,018)Foreign-born:
53.2% (965)
White (Caucasian) - Speak another language Native:
16.7% (7,798)Foreign-born:
46.8% (850)
Black or African American - Speak only English Native:
98.2% (2,585)Foreign-born:
75.8% (241)
Black or African American - Speak another language Native:
2.2% (59)Foreign-born:
42.6% (135)
American Indian / Alaska Native - Speak another language Native:
34.7% (596)Foreign-born:
100.0% (2)
Asian - Speak only English Native:
7.3% (75)Foreign-born:
16.9% (241)
Asian - Speak another language Native:
92.7% (948)Foreign-born:
83.1% (1,189)
Native Hawaiian / Pacific Islander - Speak another language Native:
42.0% (119)Foreign-born:
100.0% (17)
Other race - Speak another language Native:
56.4% (9,930)Foreign-born:
100.0% (6,005)
Two or more races - Speak only English Native:
62.9% (14,995)Foreign-born:
9.6% (365)
Two or more races - Speak another language Native:
37.1% (8,856)Foreign-born:
90.4% (3,455)
White alone - Speak only English Native:
93.9% (29,933)Foreign-born:
42.5% (676)
White alone - Speak another language Native:
6.0% (1,920)Foreign-born:
53.5% (850)
Hispanic or Latino - Speak only English Native:
56.5% (32,631)Foreign-born:
2.5% (259)
Hispanic or Latino - Speak another language Native:
43.5% (25,136)Foreign-born:
97.5% (10,160)
Foreign-born residents in Las Cruces 12,124 residents are foreign born (7.5% Latin America , 1.9% Asia ).
This city:
10.7%New Mexico:
9.2%
Marital status for residents in Las Cruces Marital status - White (Caucasian) population 15 years and over
Males 42.6% Never married41.0% Now married0.3% Separated4.7% Widowed11.4% DivorcedFemales 45.4% Never married34.3% Now married0.5% Separated8.8% Widowed11.0% DivorcedWomen who gave birth in the past 12 months Now married:
51.1% (305)Unmarried:
48.9% (292)
Women who did not give birth in the past 12 months Now married:
25.9% (3,144)Unmarried:
74.1% (8,991)
Marital status - Black or African American population 15 years and over
Males 57.5% Never married26.7% Now married2.3% Separated2.2% Widowed11.2% DivorcedFemales 61.9% Never married17.9% Now married3.3% Separated2.4% Widowed14.5% DivorcedWomen who did not give birth in the past 12 months Now married:
10.0% (50)Unmarried:
90.0% (451)
Marital status - American Indian / Alaska Native population 15 years and over
Males 50.3% Never married34.2% Now married4.1% Separated0.8% Widowed10.6% DivorcedFemales 25.1% Never married53.7% Now married4.0% Separated8.6% Widowed8.6% DivorcedWomen who gave birth in the past 12 months Now married:
0.0% (0)Unmarried:
100.0% (7)
Women who did not give birth in the past 12 months Now married:
59.2% (182)Unmarried:
40.8% (125)
Marital status - Asian population 15 years and over
Males 40.2% Never married49.4% Now married0.8% Separated0.0% Widowed9.6% DivorcedFemales 50.6% Never married43.6% Now married0.0% Separated4.5% Widowed1.3% DivorcedWomen who gave birth in the past 12 months Now married:
100.0% (35)Unmarried:
0.0% (0)
Women who did not give birth in the past 12 months Now married:
32.3% (274)Unmarried:
67.7% (576)
Marital status - Native Hawaiian / Pacific Islander population 15 years and over
Males 87.9% Never married0.0% Now married0.0% Separated12.1% Widowed0.0% DivorcedFemales 100.0% Never married0.0% Now married0.0% Separated0.0% Widowed0.0% DivorcedWomen who did not give birth in the past 12 months Now married:
0.0% (0)Unmarried:
100.0% (82)
Marital status - Other race population 15 years and over
Males 51.2% Never married32.4% Now married0.6% Separated3.5% Widowed12.4% DivorcedFemales 60.4% Never married28.4% Now married4.2% Separated1.1% Widowed5.9% DivorcedWomen who gave birth in the past 12 months Now married:
56.4% (372)Unmarried:
43.6% (288)
Women who did not give birth in the past 12 months Now married:
13.8% (894)Unmarried:
86.2% (5,594)
Marital status - Two or more races population 15 years and over
Males 46.7% Never married41.8% Now married0.6% Separated3.7% Widowed7.2% DivorcedFemales 40.9% Never married38.8% Now married0.0% Separated4.2% Widowed16.0% DivorcedWomen who gave birth in the past 12 months Now married:
100.0% (373)Unmarried:
0.0% (0)
Women who did not give birth in the past 12 months Now married:
28.5% (2,341)Unmarried:
71.5% (5,873)
Marital status - White alone, not Hispanic / Latino population 15 years and over
Males 32.3% Never married48.1% Now married0.4% Separated6.2% Widowed12.9% DivorcedFemales 34.1% Never married39.2% Now married0.0% Separated12.1% Widowed14.5% DivorcedWomen who gave birth in the past 12 months Now married:
100.0% (115)Unmarried:
0.0% (0)
Women who did not give birth in the past 12 months Now married:
32.7% (2,247)Unmarried:
67.3% (4,615)
Marital status - Hispanic or Latino population 15 years and over
Males 52.4% Never married34.5% Now married0.4% Separated2.7% Widowed10.0% DivorcedFemales 56.0% Never married31.1% Now married2.2% Separated2.1% Widowed8.6% DivorcedWomen who gave birth in the past 12 months Now married:
61.7% (935)Unmarried:
38.3% (580)
Women who did not give birth in the past 12 months Now married:
20.2% (4,112)Unmarried:
79.8% (16,244)
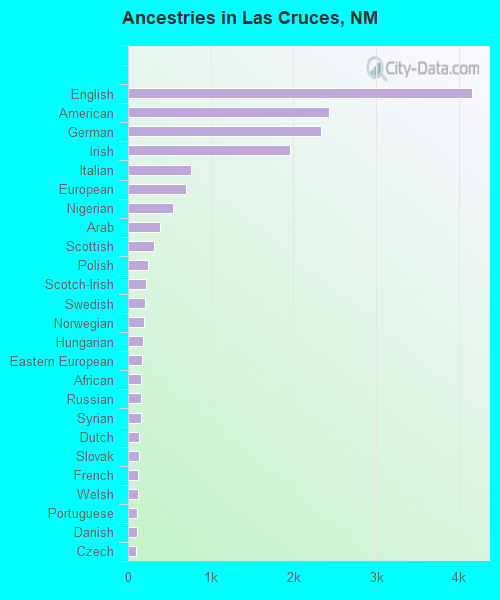
Ancestries in Las Cruces
4,155 6.0% English2,426 3.5% American2,331 3.4% German1,961 2.8% Irish757 1.1% Italian697 1.0% European541 0.8% Nigerian389 0.6% Arab309 0.4% Scottish245 0.4% Polish220 0.3% Scotch-Irish205 0.3% Swedish197 0.3% Norwegian182 0.3% Hungarian171 0.2% Eastern European158 0.2% African158 0.2% Russian153 0.2% Syrian132 0.2% Dutch131 0.2% Slovak125 0.2% French125 0.2% Welsh110 0.2% Portuguese103 0.1% Danish100 0.1% Czech90 0.1% Belgian81 0.1% Scandinavian80 0.1% Greek77 0.1% Northern European68 0.10% French Canadian66 0.10% Romanian66 0.10% Jamaican64 0.09% Iranian51 0.07% Austrian31 0.04% Czechoslovakian31 0.04% British29 0.04% Lithuanian23 0.03% Canadian17 0.02% Estonian17 0.02% Ukrainian14 0.02% Lebanese8 0.01% Belizean
Geographical mobility in Las Cruces Same house 1 year ago 41,589 82.6% White (Caucasian)2,558 81.6% Black or African American1,587 92.3% American Indian / Alaska Native1,860 80.9% Asian48 15.3% Native Hawaiian / Pacific Islander19,386 91.5% Other race26,088 89.4% Two or more races26,748 82.8% White alone, not Hispanic / Latino62,944 87.6% Hispanic or LatinoMoved within same county 3,423 6.8% White / Caucasian308 9.8% Black or African American56 3.3% American Indian / Alaska Native131 5.7% Asian199 62.9% Native Hawaiian / Pacific Islander1,236 5.8% Other race2,318 7.9% Two or more races1,422 4.4% White alone, not Hispanic / Latino6,710 9.3% Hispanic or LatinoMoved within same state 1,858 3.7% White / Caucasian157 5.0% Black or African American50 2.9% American Indian / Alaska Native35 1.5% Asian279 1.3% Other race180 0.6% Two or more races863 2.7% White alone, not Hispanic / Latino1,342 1.9% Hispanic or LatinoMoved from different state 3,460 6.9% White / Caucasian133 4.2% Black or African American26 1.5% American Indian / Alaska Native245 10.6% Asian58 18.3% Native Hawaiian / Pacific Islander322 1.5% Other race497 1.7% Two or more races3,257 10.1% White alone, not Hispanic / Latino773 1.1% Hispanic or LatinoMoved from abroad 15 0.0% White20 0.9% Asian35 0.2% Other race84 0.3% Two or more races99 0.1% Hispanic or Latino
Children Nativity (place of birth) in Las Cruces
Children under 6 years - Living with two parents Both parents native 3,000 100.0% NativeBoth parents foreign-born 275 100.0% NativeOne native, one foreign-born parent 774 100.0% NativeChildren under 6 years - Living with one parent Native parent 3,686 100.0% NativeForeign-born parent 26 100.0% NativeChildren 6 to 17 years - Living with two parents Both parents native 5,810 100.0% NativeBoth parents foreign-born 563 81.8% Native125 18.2% Foreign-bornOne native, one foreign-born parent 657 100.0% NativeChildren 6 to 17 years - Living with one parent Native parent 7,046 100.0% NativeForeign-born parent 1,860 51.2% Native1,774 48.8% Foreign-born
Grandparents responsible for own grandchildren in Las Cruces
Grandparents (30 to 59 years) White / Caucasian 157 72.7% Responsible for grandchildren59 27.3% Not responsible for grandchildrenOther race 73 46.8% Responsible for grandchildren83 53.2% Not responsible for grandchildrenTwo or more races 115 100.0% Responsible for grandchildrenWhite alone, not Hispanic / Latino 38 40.5% Responsible for grandchildren57 59.5% Not responsible for grandchildrenHispanic or Latino 355 78.0% Responsible for grandchildren100 22.0% Not responsible for grandchildrenGrandparents (60 years and over) White / Caucasian 266 47.6% Responsible for grandchildren293 52.4% Not responsible for grandchildrenOther race 11 23.2% Responsible for grandchildren36 76.8% Not responsible for grandchildrenTwo or more races 67 93.8% Responsible for grandchildren4 6.2% Not responsible for grandchildrenWhite alone, not Hispanic / Latino 193 49.3% Responsible for grandchildren198 50.7% Not responsible for grandchildrenHispanic or Latino 142 54.3% Responsible for grandchildren120 45.7% Not responsible for grandchildren