Races in Laurel, Virginia (VA) Detailed Stats
Data:
Races - White alone (%)
Races - White alone (% change since 2000)
Races - Black alone (%)
Races - Black alone (% change since 2000)
Races - American Indian alone (%)
Races - American Indian alone (% change since 2000)
Races - Asian alone (%)
Races - Asian alone (% change since 2000)
Races - Hispanic (%)
Races - Hispanic (% change since 2000)
Races - Native Hawaiian and Other Pacific Islander alone (%)
Races - Native Hawaiian and Other Pacific Islander alone (% change since 2000)
Races - Two or more races(%)
Races - Two or more races(% change since 2000)
Races - Other race alone (%)
Races - Other race alone (% change since 2000)
Racial diversity
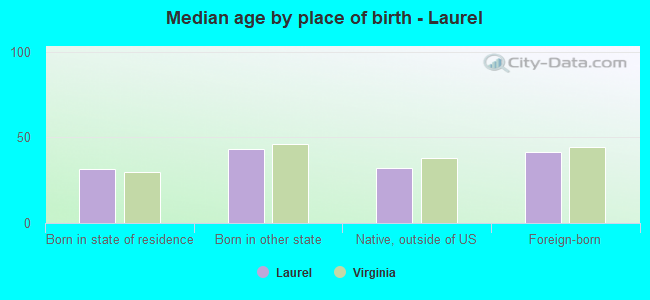
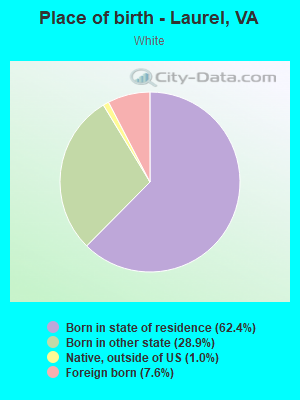
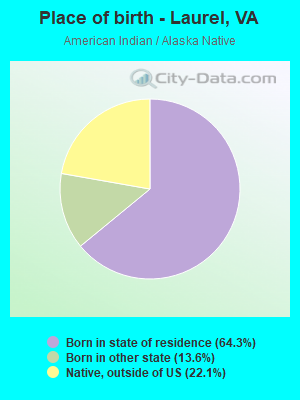
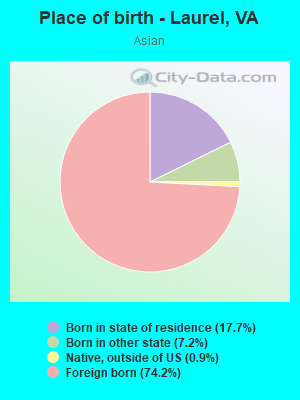
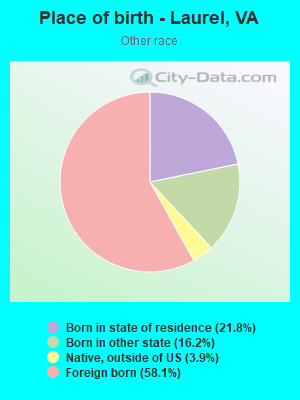
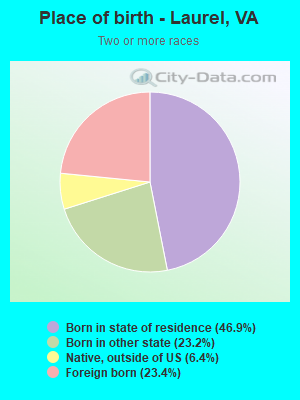
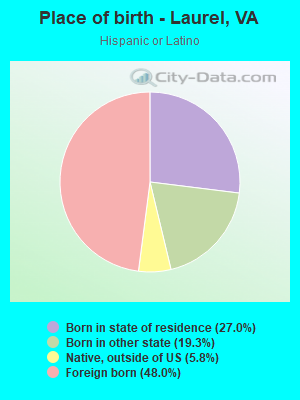
Place of birth - Born in state of residence (%)
Place of birth - Born in state of residence (%) - White
Place of birth - Born in state of residence (%) - Black or African American
Place of birth - Born in state of residence (%) - Asian
Place of birth - Born in state of residence (%) - Hispanic or Latino
Place of birth - Born in state of residence (%) - American Indian and Alaska Native
Place of birth - Born in state of residence (%) - Multirace
Place of birth - Born in state of residence (%) - Other Race
Place of birth - Born in other state (%)
Place of birth - Born in other state (%) - White
Place of birth - Born in other state (%) - Black or African American
Place of birth - Born in other state (%) - Asian
Place of birth - Born in other state (%) - Hispanic or Latino
Place of birth - Born in other state (%) - American Indian and Alaska Native
Place of birth - Born in other state (%) - Multirace
Place of birth - Born in other state (%) - Other Race
Place of birth - Native, outside of US (%)
Place of birth - Native, outside of US (%) - White
Place of birth - Native, outside of US (%) - Black or African American
Place of birth - Native, outside of US (%) - Asian
Place of birth - Native, outside of US (%) - Hispanic or Latino
Place of birth - Native, outside of US (%) - American Indian and Alaska Native
Place of birth - Native, outside of US (%) - Multirace
Place of birth - Native, outside of US (%) - Other Race
Place of birth - Foreign born (%)
Place of birth - Foreign born (%) - White
Place of birth - Foreign born (%) - Black or African American
Place of birth - Foreign born (%) - Asian
Place of birth - Foreign born (%) - Hispanic or Latino
Place of birth - Foreign born (%) - American Indian and Alaska Native
Place of birth - Foreign born (%) - Multirace
Place of birth - Foreign born (%) - Other Race
Residents speaking English at home (%)
Residents speaking English at home - Born in the United States (%)
Residents speaking English at home - Native, born elsewhere (%)
Residents speaking English at home - Foreign born (%)
Residents speaking Spanish at home (%)
Residents speaking Spanish at home - Born in the United States (%)
Residents speaking Spanish at home - Native, born elsewhere (%)
Residents speaking Spanish at home - Foreign born (%)
Residents speaking other language at home (%)
Residents speaking other language at home - Born in the United States (%)
Residents speaking other language at home - Native, born elsewhere (%)
Residents speaking other language at home - Foreign born (%)
Marital status - Never married (%)
Marital status - Now married (%)
Marital status - Separated (%)
Marital status - Widowed (%)
Marital status - Divorced (%)
Ancestries Reported - Arab (%)
Ancestries Reported - Czech (%)
Ancestries Reported - Danish (%)
Ancestries Reported - Dutch (%)
Ancestries Reported - English (%)
Ancestries Reported - French (%)
Ancestries Reported - French Canadian (%)
Ancestries Reported - German (%)
Ancestries Reported - Greek (%)
Ancestries Reported - Hungarian (%)
Ancestries Reported - Irish (%)
Ancestries Reported - Italian (%)
Ancestries Reported - Lithuanian (%)
Ancestries Reported - Norwegian (%)
Ancestries Reported - Polish (%)
Ancestries Reported - Portuguese (%)
Ancestries Reported - Russian (%)
Ancestries Reported - Scotch-Irish (%)
Ancestries Reported - Scottish (%)
Ancestries Reported - Slovak (%)
Ancestries Reported - Subsaharan African (%)
Ancestries Reported - Swedish (%)
Ancestries Reported - Swiss (%)
Ancestries Reported - Ukrainian (%)
Ancestries Reported - United States (%)
Ancestries Reported - Welsh (%)
Ancestries Reported - West Indian (%)
Ancestries Reported - Other (%)
Geographical mobility - Same house 1 year ago (%)
Geographical mobility - Same house 1 year ago (%) - White
Geographical mobility - Same house 1 year ago (%) - Black or African American
Geographical mobility - Same house 1 year ago (%) - Asian
Geographical mobility - Same house 1 year ago (%) - Hispanic or Latino
Geographical mobility - Same house 1 year ago (%) - American Indian and Alaska Native
Geographical mobility - Same house 1 year ago (%) - Multirace
Geographical mobility - Same house 1 year ago (%) - Other Race
Geographical mobility - Moved within same county (%)
Geographical mobility - Moved within same county (%) - White
Geographical mobility - Moved within same county (%) - Black or African American
Geographical mobility - Moved within same county (%) - Asian
Geographical mobility - Moved within same county (%) - Hispanic or Latino
Geographical mobility - Moved within same county (%) - American Indian and Alaska Native
Geographical mobility - Moved within same county (%) - Multirace
Geographical mobility - Moved within same county (%) - Other Race
Geographical mobility - Moved from different county within same state (%)
Geographical mobility - Moved from different county within same state (%) - White
Geographical mobility - Moved from different county within same state (%) - Black or African American
Geographical mobility - Moved from different county within same state (%) - Asian
Geographical mobility - Moved from different county within same state (%) - Hispanic or Latino
Geographical mobility - Moved from different county within same state (%) - American Indian and Alaska Native
Geographical mobility - Moved from different county within same state (%) - Multirace
Geographical mobility - Moved from different county within same state (%) - Other Race
Geographical mobility - Moved from different state (%)
Geographical mobility - Moved from different state (%) - White
Geographical mobility - Moved from different state (%) - Black or African American
Geographical mobility - Moved from different state (%) - Asian
Geographical mobility - Moved from different state (%) - Hispanic or Latino
Geographical mobility - Moved from different state (%) - American Indian and Alaska Native
Geographical mobility - Moved from different state (%) - Multirace
Geographical mobility - Moved from different state (%) - Other Race
Geographical mobility - Moved from abroad (%)
Geographical mobility - Moved from abroad (%) - White
Geographical mobility - Moved from abroad (%) - Black or African American
Geographical mobility - Moved from abroad (%) - Asian
Geographical mobility - Moved from abroad (%) - Hispanic or Latino
Geographical mobility - Moved from abroad (%) - American Indian and Alaska Native
Geographical mobility - Moved from abroad (%) - Multirace
Geographical mobility - Moved from abroad (%) - Other Race
Place of birth for the foreign-born population - Ireland (%)
Place of birth for the foreign-born population - Denmark (%)
Place of birth for the foreign-born population - Norway (%)
Place of birth for the foreign-born population - Sweden (%)
Place of birth for the foreign-born population - United Kingdom (%)
Place of birth for the foreign-born population - England (%)
Place of birth for the foreign-born population - Scotland (%)
Place of birth for the foreign-born population - Other Northern Europe (%)
Place of birth for the foreign-born population - Austria (%)
Place of birth for the foreign-born population - Belgium (%)
Place of birth for the foreign-born population - France (%)
Place of birth for the foreign-born population - Germany (%)
Place of birth for the foreign-born population - Netherlands (%)
Place of birth for the foreign-born population - Switzerland (%)
Place of birth for the foreign-born population - Other Western Europe (%)
Place of birth for the foreign-born population - Greece (%)
Place of birth for the foreign-born population - Italy (%)
Place of birth for the foreign-born population - Portugal (%)
Place of birth for the foreign-born population - Spain (%)
Place of birth for the foreign-born population - Other Southern Europe (%)
Place of birth for the foreign-born population - Albania (%)
Place of birth for the foreign-born population - Belarus (%)
Place of birth for the foreign-born population - Bosnia and Herzegovina (%)
Place of birth for the foreign-born population - Bulgaria (%)
Place of birth for the foreign-born population - Croatia (%)
Place of birth for the foreign-born population - Czechoslovakia (%)
Place of birth for the foreign-born population - Hungary (%)
Place of birth for the foreign-born population - Latvia (%)
Place of birth for the foreign-born population - Lithuania (%)
Place of birth for the foreign-born population - North Macedonia (Macedonia) (%)
Place of birth for the foreign-born population - Moldova (%)
Place of birth for the foreign-born population - Poland (%)
Place of birth for the foreign-born population - Romania (%)
Place of birth for the foreign-born population - Russia (%)
Place of birth for the foreign-born population - Serbia (%)
Place of birth for the foreign-born population - Ukraine (%)
Place of birth for the foreign-born population - Other Eastern Europe (%)
Place of birth for the foreign-born population - China (%)
Place of birth for the foreign-born population - Hong Kong (%)
Place of birth for the foreign-born population - Taiwan (%)
Place of birth for the foreign-born population - Japan (%)
Place of birth for the foreign-born population - Korea (%)
Place of birth for the foreign-born population - Other Eastern Asia (%)
Place of birth for the foreign-born population - Afghanistan (%)
Place of birth for the foreign-born population - Bangladesh (%)
Place of birth for the foreign-born population - India (%)
Place of birth for the foreign-born population - Iran (%)
Place of birth for the foreign-born population - Kazakhstan (%)
Place of birth for the foreign-born population - Nepal (%)
Place of birth for the foreign-born population - Pakistan (%)
Place of birth for the foreign-born population - Sri Lanka (%)
Place of birth for the foreign-born population - Uzbekistan (%)
Place of birth for the foreign-born population - Other South Central Asia (%)
Place of birth for the foreign-born population - Burma (%)
Place of birth for the foreign-born population - Cambodia (%)
Place of birth for the foreign-born population - Indonesia (%)
Place of birth for the foreign-born population - Laos (%)
Place of birth for the foreign-born population - Malaysia (%)
Place of birth for the foreign-born population - Philippines (%)
Place of birth for the foreign-born population - Singapore (%)
Place of birth for the foreign-born population - Thailand (%)
Place of birth for the foreign-born population - Vietnam (%)
Place of birth for the foreign-born population - Other South Eastern Asia (%)
Place of birth for the foreign-born population - Armenia (%)
Place of birth for the foreign-born population - Iraq (%)
Place of birth for the foreign-born population - Israel (%)
Place of birth for the foreign-born population - Jordan (%)
Place of birth for the foreign-born population - Kuwait (%)
Place of birth for the foreign-born population - Lebanon (%)
Place of birth for the foreign-born population - Saudi Arabia (%)
Place of birth for the foreign-born population - Syria (%)
Place of birth for the foreign-born population - Turkey (%)
Place of birth for the foreign-born population - Yemen (%)
Place of birth for the foreign-born population - Other Western Asia (%)
Place of birth for the foreign-born population - Eritrea (%)
Place of birth for the foreign-born population - Ethiopia (%)
Place of birth for the foreign-born population - Kenya (%)
Place of birth for the foreign-born population - Somalia (%)
Place of birth for the foreign-born population - Uganda (%)
Place of birth for the foreign-born population - Zimbabwe (%)
Place of birth for the foreign-born population - Other Eastern Africa (%)
Place of birth for the foreign-born population - Cameroon (%)
Place of birth for the foreign-born population - Congo (%)
Place of birth for the foreign-born population - Democratic Republic of Congo (Zaire) (%)
Place of birth for the foreign-born population - Other Middle Africa (%)
Place of birth for the foreign-born population - Egypt (%)
Place of birth for the foreign-born population - Morocco (%)
Place of birth for the foreign-born population - Sudan (%)
Place of birth for the foreign-born population - Other Northern Africa (%)
Place of birth for the foreign-born population - South Africa (%)
Place of birth for the foreign-born population - Other Southern Africa (%)
Place of birth for the foreign-born population - Cabo Verde (%)
Place of birth for the foreign-born population - Ghana (%)
Place of birth for the foreign-born population - Liberia (%)
Place of birth for the foreign-born population - Nigeria (%)
Place of birth for the foreign-born population - Senegal (%)
Place of birth for the foreign-born population - Sierra Leone (%)
Place of birth for the foreign-born population - Other Western Africa (%)
Place of birth for the foreign-born population - Australia (%)
Place of birth for the foreign-born population - New Zealand (%)
Place of birth for the foreign-born population - Fiji (%)
Place of birth for the foreign-born population - Micronesia (%)
Place of birth for the foreign-born population - Bahamas (%)
Place of birth for the foreign-born population - Barbados (%)
Place of birth for the foreign-born population - Cuba (%)
Place of birth for the foreign-born population - Dominica (%)
Place of birth for the foreign-born population - Dominican Republic (%)
Place of birth for the foreign-born population - Grenada (%)
Place of birth for the foreign-born population - Haiti (%)
Place of birth for the foreign-born population - Jamaica (%)
Place of birth for the foreign-born population - St. Vincent and the Grenadines (%)
Place of birth for the foreign-born population - Trinidad and Tobago (%)
Place of birth for the foreign-born population - West Indies (%)
Place of birth for the foreign-born population - Other Caribbean (%)
Place of birth for the foreign-born population - Belize (%)
Place of birth for the foreign-born population - Costa Rica (%)
Place of birth for the foreign-born population - El Salvador (%)
Place of birth for the foreign-born population - Guatemala (%)
Place of birth for the foreign-born population - Honduras (%)
Place of birth for the foreign-born population - Mexico (%)
Place of birth for the foreign-born population - Nicaragua (%)
Place of birth for the foreign-born population - Panama (%)
Place of birth for the foreign-born population - Other Central America (%)
Place of birth for the foreign-born population - Argentina (%)
Place of birth for the foreign-born population - Bolivia (%)
Place of birth for the foreign-born population - Brazil (%)
Place of birth for the foreign-born population - Chile (%)
Place of birth for the foreign-born population - Colombia (%)
Place of birth for the foreign-born population - Ecuador (%)
Place of birth for the foreign-born population - Guyana (%)
Place of birth for the foreign-born population - Peru (%)
Place of birth for the foreign-born population - Uruguay (%)
Place of birth for the foreign-born population - Venezuela (%)
Place of birth for the foreign-born population - Other South America (%)
Place of birth for the foreign-born population - Canada (%)
Place of birth for the foreign-born population - Other Northern America (%)
Place of birth for the foreign-born population - Other (%)
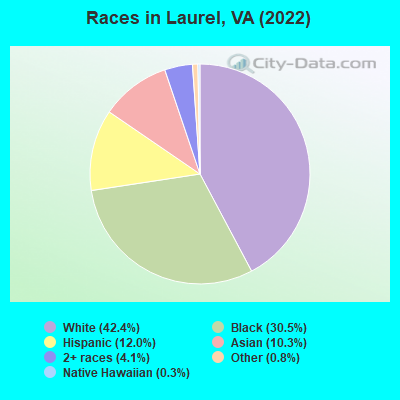
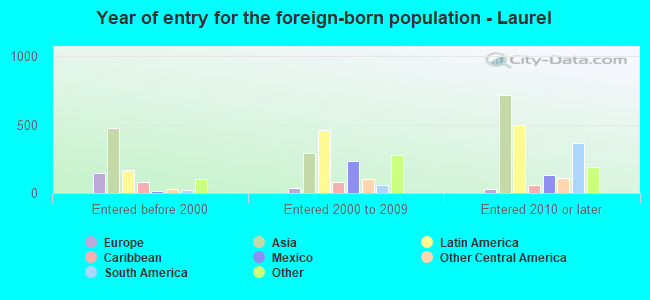
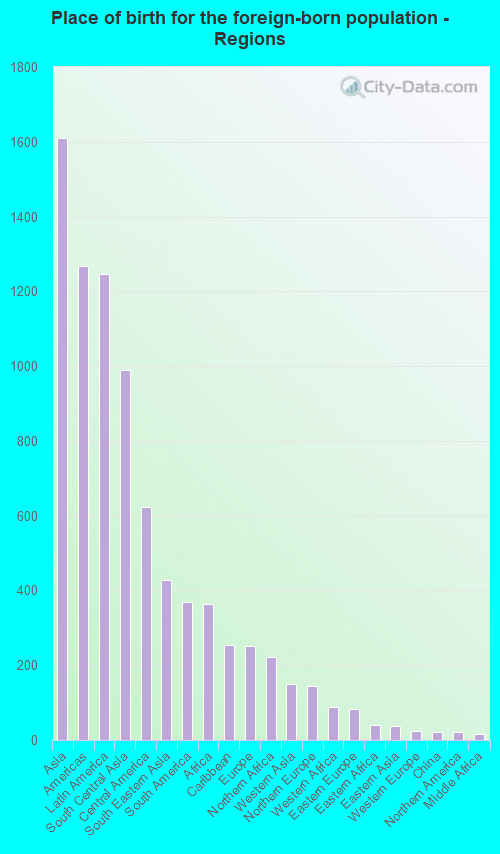
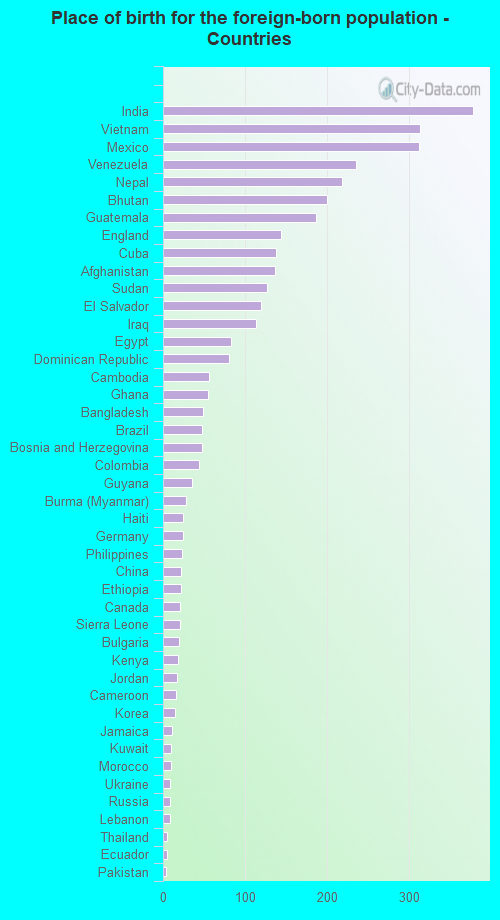
According to 2022 data, the most numerous races in Laurel, VA are White alone (7,860 residents), Black alone (5,653 residents), and Hispanic (2,230 residents). 78.3% of Laurel residents speak English at home. 18.9% of Laurel, VA residents are foreign-born (8.6% born in Asia, 6.7% born in Latin America, 1.9% born in Africa), which is 36.4% greater than the foreign-born rate of 12.0% across the entire state of Virginia.
Race distribution in Laurel
2000 2022
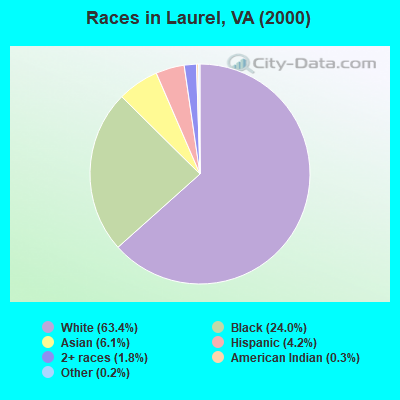
4,965,637 70.2% White alone 1,376,378 19.4% Black alone 329,540 4.7% Hispanic 259,277 3.7% Asian alone 114,022 1.6% Two or more races 18,596 0.3% American Indian alone 11,685 0.2% Other race alone 3,380 0.05% Native Hawaiian and Other
5,095,130 58.7% White alone 1,594,785 18.4% Black alone 905,750 10.4% Hispanic 602,881 6.9% Asian alone 406,047 4.7% Two or more races 60,419 0.7% Other race alone 11,738 0.1% American Indian alone 6,869 0.08% Native Hawaiian and Other
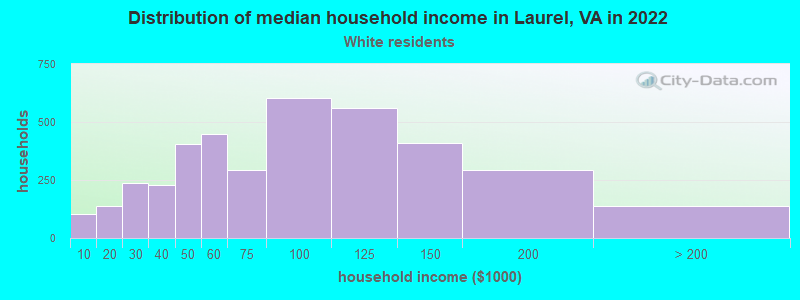
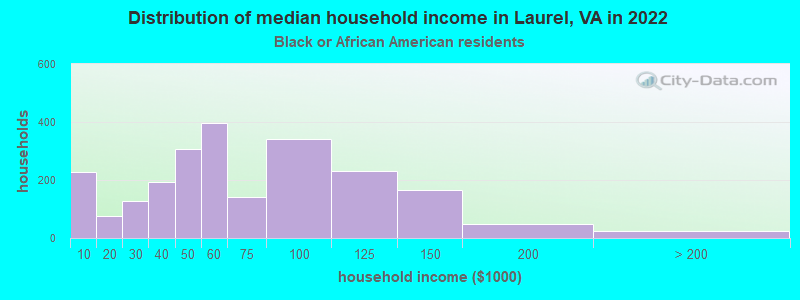
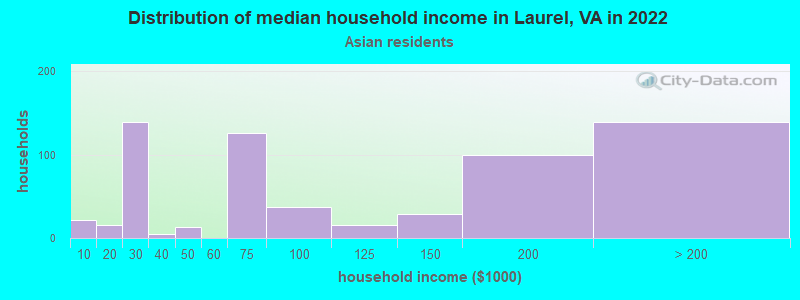
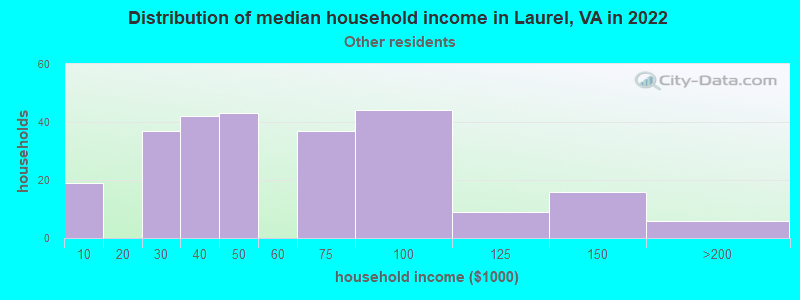
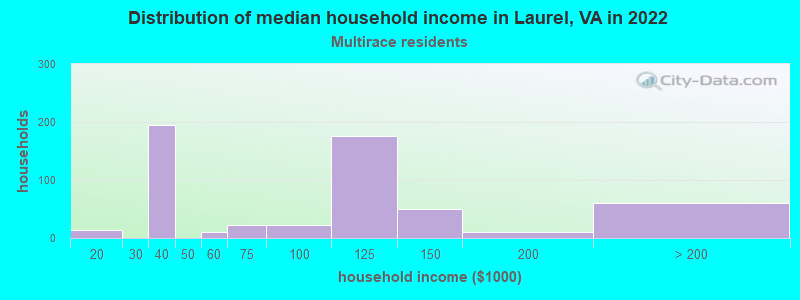
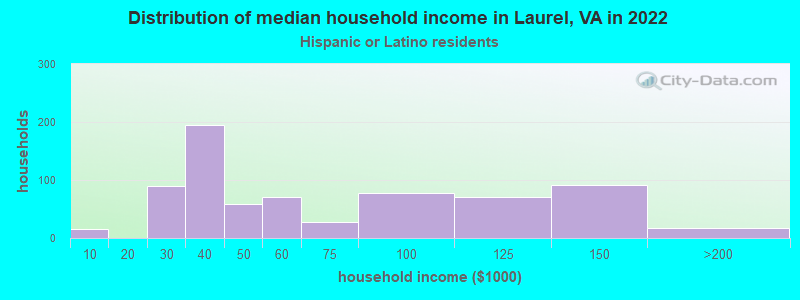
Income and house value in Laurel Median household income in 2022 $75,497 White non-Hispanic householders$54,261 Black householders$96,439 Asian householders$72,958 Some other race householders$69,954 Two or more races householders$51,737 Hispanic or Latino race householdersMedian 2022 house value $293,536 White Non-Hispanic householders$315,028 Black or African American householders$212,092 American Indian or Alaska Native householders $311,634 Asian householders$273,458 Two or more races householders$260,732 Hispanic or Latino householders
Median age by race in Laurel
37.9 Median age for White residents37.1 40.5 35.9 Median age for Black or African American residents34.0 37.6 47.0 Median age for American Indian / Alaska Native residents-402,222,221.8 -687,861,271.0 40.9 Median age for Asian residents39.5 45.5 -348,441,926.0 Median age for Native Hawaiian / Pacific Islander residents-541,531,822.5 -714,150,046.8 24.3 Median age for Other race residents22.3 25.7 29.9 Median age for Two or more races residents29.4 27.8 38.6 Median age for White alone residents37.2 42.5 27.7 Median age for Hispanic or Latino residents29.0 27.7
Owner/renter occupied households by race in Laurel
House owners and renters - White residents 2,348 62.2% Owner occupied1,429 37.8% Renter occupiedHouse owners and renters - Black or African American residents 687 30.2% Owner occupied1,591 69.8% Renter occupiedHouse owners and renters - American Indian / Alaska Native residents 2 100.0% Renter occupiedHouse owners and renters - Asian residents 403 70.4% Owner occupied169 29.6% Renter occupiedHouse owners and renters - Native Hawaiian / Pacific Islander residents 27 100.0% Owner occupiedHouse owners and renters - Other race residents 59 27.4% Owner occupied157 72.6% Renter occupiedHouse owners and renters - Two or more races residents 270 49.5% Owner occupied275 50.5% Renter occupiedHouse owners and renters - White alone residents 2,334 63.6% Owner occupied1,335 36.4% Renter occupiedHouse owners and renters - Hispanic or Latino residents 171 28.8% Owner occupied423 71.2% Renter occupied
Language usage in Laurel
English speakers - Total 78.3% of residents of Laurel speak English at home.
8.1% of residents speak Spanish at home 833 59.4% Speak English very well569 40.6% Speak English less than very well12.5% of residents speak other language at home 1,197 54.9% Speak English very well983 45.1% Speak English less than very well
English speakers - Born in the United States 93.1% of residents of Laurel speak English at home.
8.0% of residents speak Spanish at home 289 77.3% Speak English very well85 22.7% Speak English less than very well0.5% of residents speak other language at home 21 100.0% Speak English very well
English speakers - Native, born elsewhere 41.0% of residents of Laurel speak English at home.
26.5% of residents speak Spanish at home 48 72.7% Speak English very well18 27.3% Speak English less than very well14.9% of residents speak other language at home 37 100.0% Speak English less than very well
English speakers - Foreign-born 12.2% of residents of Laurel speak English at home.
25.7% of residents speak Spanish at home 335 39.8% Speak English very well506 60.2% Speak English less than very well59.1% of residents speak other language at home 1,008 52.2% Speak English very well924 47.8% Speak English less than very well
White (Caucasian) - Speak only English Native:
97.4% (6,867)Foreign-born:
25.0% (153)
White (Caucasian) - Speak another language Native:
2.5% (178)Foreign-born:
74.3% (455)
Black or African American - Speak only English Native:
97.5% (5,149)Foreign-born:
10.2% (34)
Black or African American - Speak another language Native:
2.4% (128)Foreign-born:
100.0% (332)
Asian - Speak only English Native:
44.9% (172)Foreign-born:
14.8% (204)
Asian - Speak another language Native:
51.4% (197)Foreign-born:
82.9% (1,145)
Other race - Speak only English Native:
54.0% (205)Foreign-born:
0.9% (5)
Other race - Speak another language Native:
44.5% (170)Foreign-born:
100.0% (596)
Two or more races - Speak only English Native:
75.0% (779)Foreign-born:
2.9% (11)
Two or more races - Speak another language Native:
24.3% (252)Foreign-born:
96.7% (367)
White alone - Speak only English Native:
98.8% (6,843)Foreign-born:
36.8% (167)
White alone - Speak another language Native:
1.3% (87)Foreign-born:
63.3% (287)
Hispanic or Latino - Speak only English Native:
41.9% (387)Foreign-born:
0.7% (7)
Hispanic or Latino - Speak another language Native:
55.0% (507)Foreign-born:
100.0% (937)
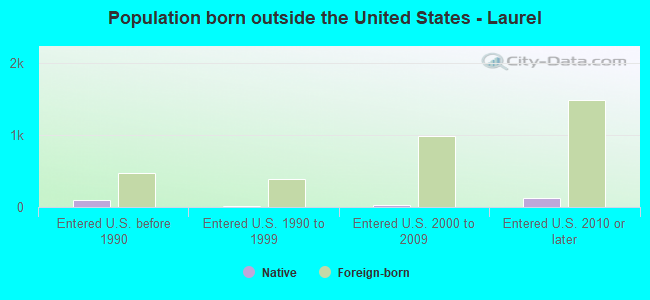
Foreign-born residents in Laurel 3,496 residents are foreign born (8.6% Asia , 6.7% Latin America , 1.9% Africa ).
This city:
18.9%Virginia:
12.6%
Marital status for residents in Laurel Marital status - White (Caucasian) population 15 years and over
Males 40.4% Never married47.5% Now married1.1% Separated2.7% Widowed8.4% DivorcedFemales 31.2% Never married37.9% Now married3.1% Separated9.8% Widowed18.0% DivorcedWomen who gave birth in the past 12 months Now married:
77.1% (79)Unmarried:
22.9% (24)
Women who did not give birth in the past 12 months Now married:
40.5% (787)Unmarried:
59.5% (1,155)
Marital status - Black or African American population 15 years and over
Males 61.2% Never married25.0% Now married0.8% Separated5.7% Widowed7.3% DivorcedFemales 44.1% Never married26.1% Now married4.0% Separated9.3% Widowed16.5% DivorcedWomen who gave birth in the past 12 months Now married:
0.0% (0)Unmarried:
100.0% (57)
Women who did not give birth in the past 12 months Now married:
33.9% (521)Unmarried:
66.1% (1,015)
Marital status - American Indian / Alaska Native population 15 years and over
Males 75.0% Never married0.0% Now married0.0% Separated0.0% Widowed25.0% DivorcedFemales 0.0% Never married100.0% Now married0.0% Separated0.0% Widowed0.0% DivorcedWomen who did not give birth in the past 12 months Now married:
100.0% (11)Unmarried:
0.0% (0)
Marital status - Asian population 15 years and over
Males 49.8% Never married48.2% Now married0.0% Separated2.0% Widowed0.0% DivorcedFemales 17.4% Never married64.7% Now married0.0% Separated4.2% Widowed13.7% DivorcedWomen who gave birth in the past 12 months Now married:
100.0% (14)Unmarried:
0.0% (0)
Women who did not give birth in the past 12 months Now married:
62.3% (254)Unmarried:
37.7% (153)
Marital status - Other race population 15 years and over
Males 43.6% Never married39.4% Now married0.0% Separated0.0% Widowed17.0% DivorcedFemales 38.5% Never married47.5% Now married6.7% Separated1.3% Widowed6.0% DivorcedWomen who gave birth in the past 12 months Now married:
100.0% (13)Unmarried:
0.0% (0)
Women who did not give birth in the past 12 months Now married:
46.4% (146)Unmarried:
53.6% (168)
Marital status - Two or more races population 15 years and over
Males 46.2% Never married40.1% Now married3.9% Separated1.7% Widowed8.1% DivorcedFemales 37.7% Never married37.5% Now married0.0% Separated4.8% Widowed20.0% DivorcedWomen who gave birth in the past 12 months Now married:
44.2% (31)Unmarried:
55.8% (39)
Women who did not give birth in the past 12 months Now married:
40.1% (158)Unmarried:
59.9% (236)
Marital status - White alone, not Hispanic / Latino population 15 years and over
Males 39.7% Never married47.6% Now married1.1% Separated2.8% Widowed8.8% DivorcedFemales 30.2% Never married38.8% Now married3.3% Separated10.3% Widowed17.4% DivorcedWomen who gave birth in the past 12 months Now married:
74.0% (68)Unmarried:
26.0% (24)
Women who did not give birth in the past 12 months Now married:
42.0% (773)Unmarried:
58.0% (1,068)
Marital status - Hispanic or Latino population 15 years and over
Males 45.6% Never married41.5% Now married0.7% Separated0.1% Widowed12.0% DivorcedFemales 38.6% Never married34.6% Now married2.5% Separated1.8% Widowed22.5% DivorcedWomen who gave birth in the past 12 months Now married:
100.0% (46)Unmarried:
0.0% (0)
Women who did not give birth in the past 12 months Now married:
35.1% (192)Unmarried:
64.9% (355)
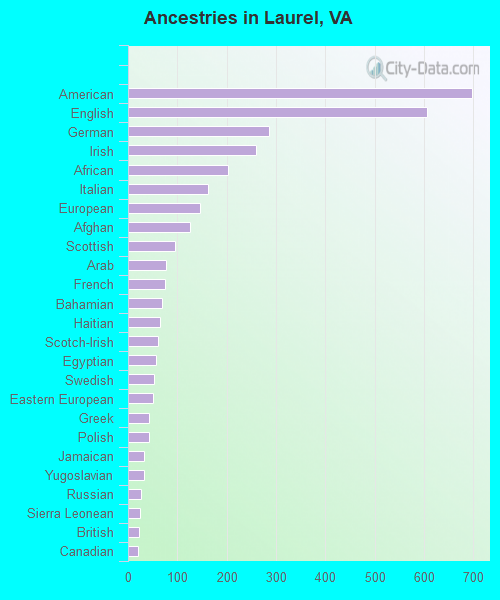
Ancestries in Laurel
697 7.1% American606 6.2% English285 2.9% German259 2.6% Irish202 2.1% African162 1.6% Italian146 1.5% European125 1.3% Afghan96 1.0% Scottish77 0.8% Arab74 0.8% French68 0.7% Bahamian65 0.7% Haitian60 0.6% Scotch-Irish57 0.6% Egyptian53 0.5% Swedish50 0.5% Eastern European42 0.4% Greek42 0.4% Polish33 0.3% Jamaican33 0.3% Yugoslavian26 0.3% Russian24 0.2% Sierra Leonean23 0.2% British21 0.2% Canadian20 0.2% Ethiopian18 0.2% French Canadian18 0.2% Bulgarian17 0.2% Nigerian14 0.1% Iraqi14 0.1% Danish14 0.1% Kenyan11 0.1% Lebanese9 0.09% Dutch8 0.08% Palestinian6 0.06% Brazilian2 0.02% Northern European2 0.02% Swiss
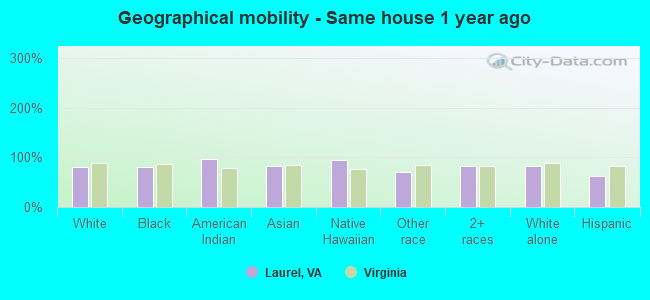
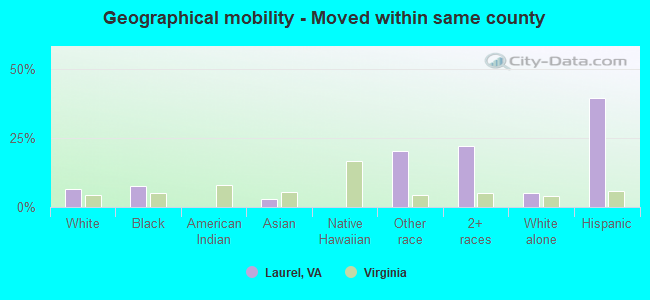
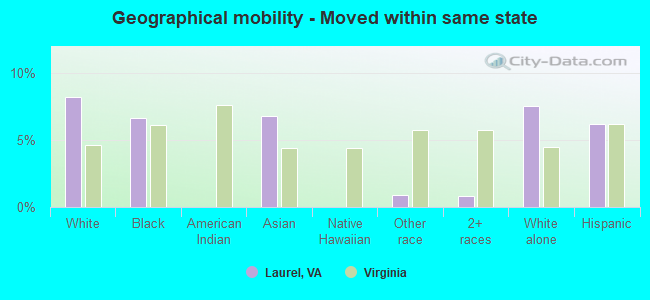
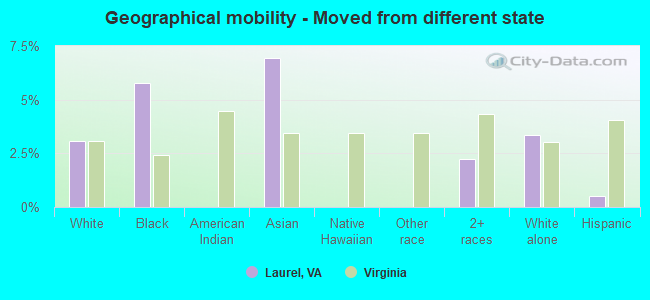
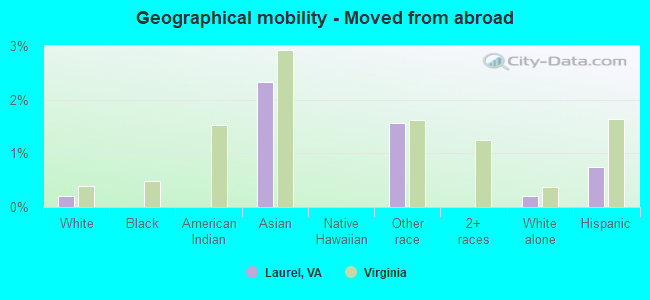
Geographical mobility in Laurel Same house 1 year ago 6,657 81.5% White (Caucasian)4,610 80.7% Black or African American19 96.1% American Indian / Alaska Native1,553 81.7% Asian33 95.3% Native Hawaiian / Pacific Islander877 70.7% Other race1,322 81.9% Two or more races6,465 82.9% White alone, not Hispanic / Latino1,316 61.8% Hispanic or LatinoMoved within same county 528 6.5% White / Caucasian431 7.6% Black or African American54 2.8% Asian250 20.2% Other race361 22.3% Two or more races402 5.2% White alone, not Hispanic / Latino843 39.6% Hispanic or LatinoMoved within same state 673 8.2% White / Caucasian379 6.6% Black or African American129 6.8% Asian11 0.9% Other race13 0.8% Two or more races586 7.5% White alone, not Hispanic / Latino132 6.2% Hispanic or LatinoMoved from different state 250 3.1% White / Caucasian329 5.8% Black or African American132 6.9% Asian36 2.2% Two or more races261 3.4% White alone, not Hispanic / Latino11 0.5% Hispanic or LatinoMoved from abroad 16 0.2% White44 2.3% Asian19 1.6% Other race16 0.2% White alone, not Hispanic / Latino16 0.8% Hispanic or Latino
Children Nativity (place of birth) in Laurel
Children under 6 years - Living with two parents Both parents native 436 100.0% NativeBoth parents foreign-born 156 65.5% Native82 34.5% Foreign-bornOne native, one foreign-born parent 154 100.0% NativeChildren under 6 years - Living with one parent Native parent 331 100.0% NativeForeign-born parent 93 100.0% NativeChildren 6 to 17 years - Living with two parents Both parents native 739 100.0% NativeBoth parents foreign-born 351 80.1% Native87 19.9% Foreign-bornOne native, one foreign-born parent 35 70.0% Native15 30.0% Foreign-bornChildren 6 to 17 years - Living with one parent Native parent 604 100.0% NativeForeign-born parent 128 58.5% Native91 41.5% Foreign-born
Grandparents responsible for own grandchildren in Laurel
Grandparents (30 to 59 years) White / Caucasian 26 79.3% Responsible for grandchildren7 20.7% Not responsible for grandchildrenBlack or African American 12 100.0% Not responsible for grandchildrenOther race 35 100.0% Not responsible for grandchildrenTwo or more races 1 100.0% Not responsible for grandchildrenWhite alone, not Hispanic / Latino 16 66.5% Responsible for grandchildren8 33.5% Not responsible for grandchildrenHispanic or Latino 21 100.0% Not responsible for grandchildrenGrandparents (60 years and over) White / Caucasian 33 44.2% Responsible for grandchildren42 55.8% Not responsible for grandchildrenBlack or African American 53 100.0% Not responsible for grandchildrenOther race 46 100.0% Responsible for grandchildrenWhite alone, not Hispanic / Latino 33 42.7% Responsible for grandchildren45 57.3% Not responsible for grandchildrenHispanic or Latino 27 100.0% Responsible for grandchildren