Races in Lawrence, Kansas (KS) Detailed Stats
Data:
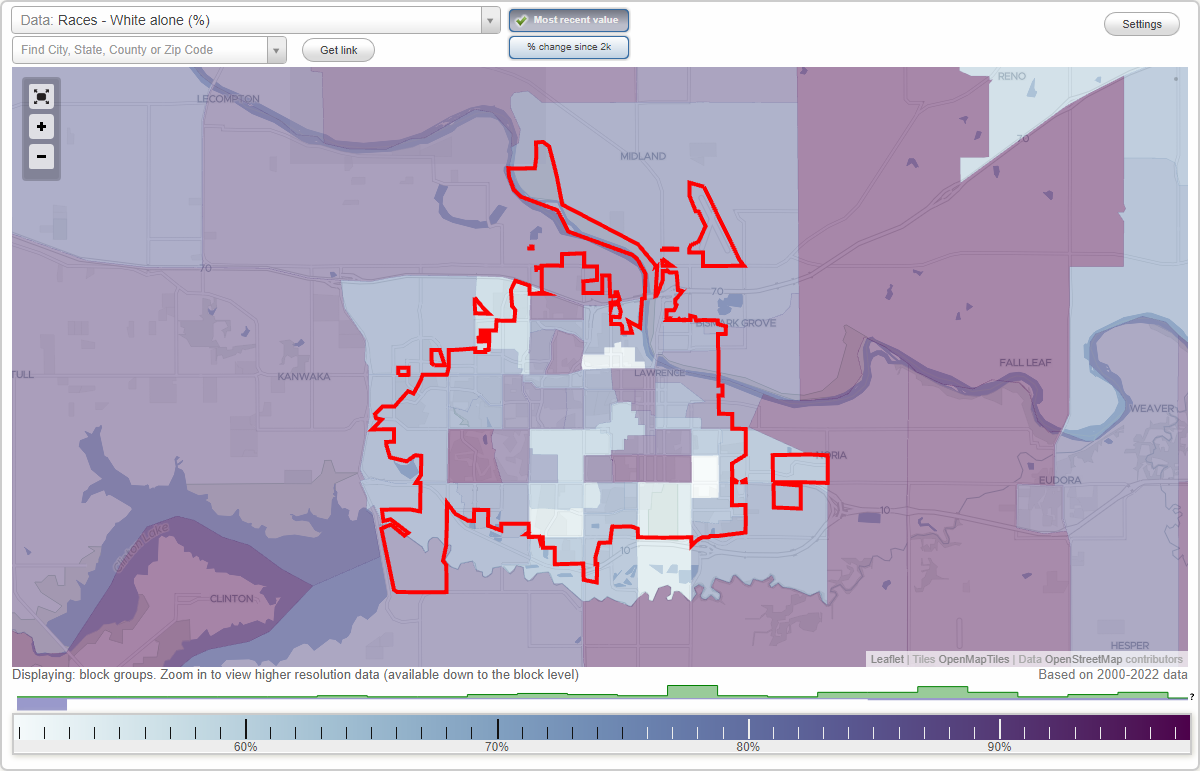
Races - White alone (%)
Races - White alone (% change since 2000)
Races - Black alone (%)
Races - Black alone (% change since 2000)
Races - American Indian alone (%)
Races - American Indian alone (% change since 2000)
Races - Asian alone (%)
Races - Asian alone (% change since 2000)
Races - Hispanic (%)
Races - Hispanic (% change since 2000)
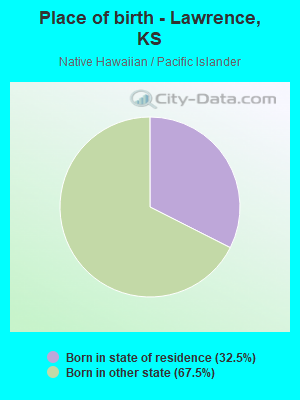
Races - Native Hawaiian and Other Pacific Islander alone (%)
Races - Native Hawaiian and Other Pacific Islander alone (% change since 2000)
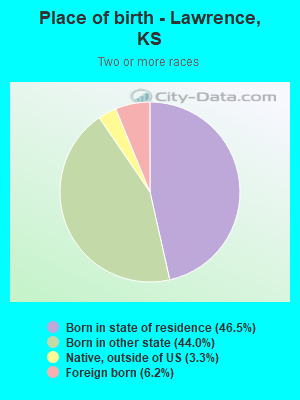
Races - Two or more races(%)
Races - Two or more races(% change since 2000)
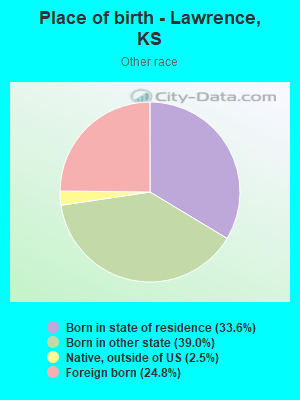
Races - Other race alone (%)
Races - Other race alone (% change since 2000)
Racial diversity
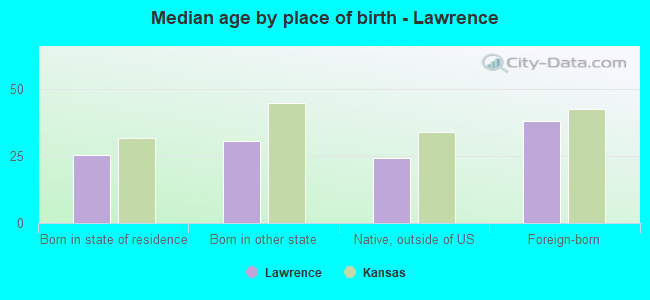
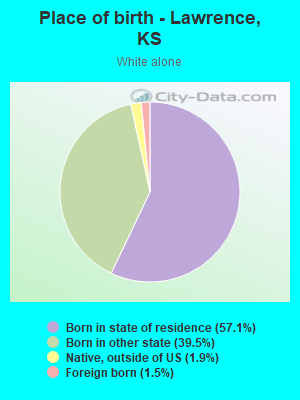
Place of birth - Born in state of residence (%)
Place of birth - Born in state of residence (%) - White
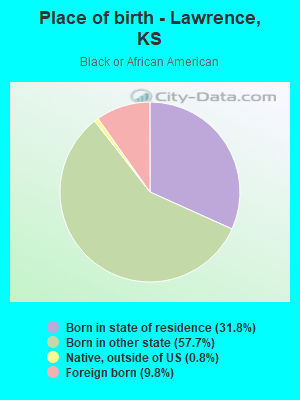
Place of birth - Born in state of residence (%) - Black or African American
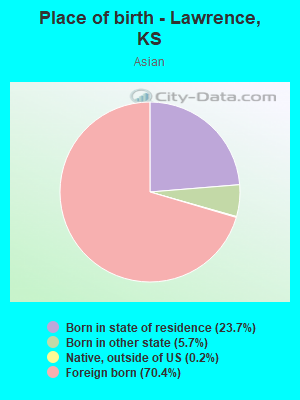
Place of birth - Born in state of residence (%) - Asian
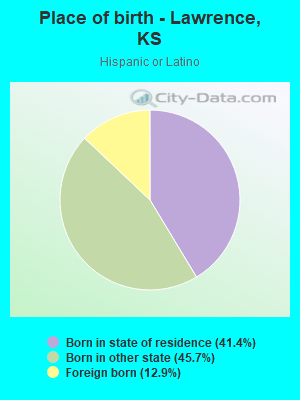
Place of birth - Born in state of residence (%) - Hispanic or Latino
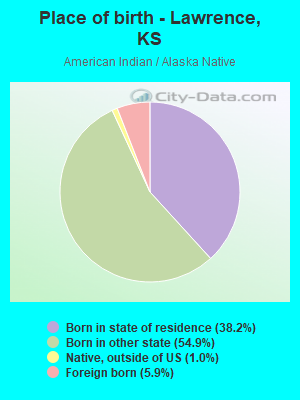
Place of birth - Born in state of residence (%) - American Indian and Alaska Native
Place of birth - Born in state of residence (%) - Multirace
Place of birth - Born in state of residence (%) - Other Race
Place of birth - Born in other state (%)
Place of birth - Born in other state (%) - White
Place of birth - Born in other state (%) - Black or African American
Place of birth - Born in other state (%) - Asian
Place of birth - Born in other state (%) - Hispanic or Latino
Place of birth - Born in other state (%) - American Indian and Alaska Native
Place of birth - Born in other state (%) - Multirace
Place of birth - Born in other state (%) - Other Race
Place of birth - Native, outside of US (%)
Place of birth - Native, outside of US (%) - White
Place of birth - Native, outside of US (%) - Black or African American
Place of birth - Native, outside of US (%) - Asian
Place of birth - Native, outside of US (%) - Hispanic or Latino
Place of birth - Native, outside of US (%) - American Indian and Alaska Native
Place of birth - Native, outside of US (%) - Multirace
Place of birth - Native, outside of US (%) - Other Race
Place of birth - Foreign born (%)
Place of birth - Foreign born (%) - White
Place of birth - Foreign born (%) - Black or African American
Place of birth - Foreign born (%) - Asian
Place of birth - Foreign born (%) - Hispanic or Latino
Place of birth - Foreign born (%) - American Indian and Alaska Native
Place of birth - Foreign born (%) - Multirace
Place of birth - Foreign born (%) - Other Race
Residents speaking English at home (%)
Residents speaking English at home - Born in the United States (%)
Residents speaking English at home - Native, born elsewhere (%)
Residents speaking English at home - Foreign born (%)
Residents speaking Spanish at home (%)
Residents speaking Spanish at home - Born in the United States (%)
Residents speaking Spanish at home - Native, born elsewhere (%)
Residents speaking Spanish at home - Foreign born (%)
Residents speaking other language at home (%)
Residents speaking other language at home - Born in the United States (%)
Residents speaking other language at home - Native, born elsewhere (%)
Residents speaking other language at home - Foreign born (%)
Marital status - Never married (%)
Marital status - Now married (%)
Marital status - Separated (%)
Marital status - Widowed (%)
Marital status - Divorced (%)
Ancestries Reported - Arab (%)
Ancestries Reported - Czech (%)
Ancestries Reported - Danish (%)
Ancestries Reported - Dutch (%)
Ancestries Reported - English (%)
Ancestries Reported - French (%)
Ancestries Reported - French Canadian (%)
Ancestries Reported - German (%)
Ancestries Reported - Greek (%)
Ancestries Reported - Hungarian (%)
Ancestries Reported - Irish (%)
Ancestries Reported - Italian (%)
Ancestries Reported - Lithuanian (%)
Ancestries Reported - Norwegian (%)
Ancestries Reported - Polish (%)
Ancestries Reported - Portuguese (%)
Ancestries Reported - Russian (%)
Ancestries Reported - Scotch-Irish (%)
Ancestries Reported - Scottish (%)
Ancestries Reported - Slovak (%)
Ancestries Reported - Subsaharan African (%)
Ancestries Reported - Swedish (%)
Ancestries Reported - Swiss (%)
Ancestries Reported - Ukrainian (%)
Ancestries Reported - United States (%)
Ancestries Reported - Welsh (%)
Ancestries Reported - West Indian (%)
Ancestries Reported - Other (%)
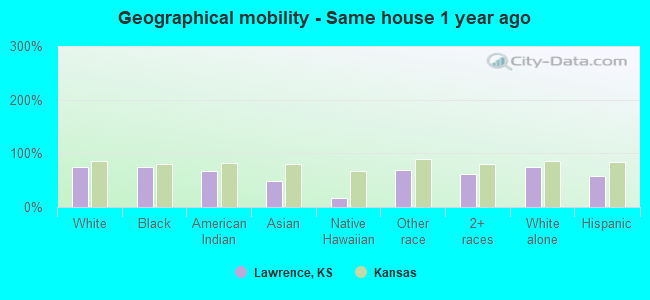
Geographical mobility - Same house 1 year ago (%)
Geographical mobility - Same house 1 year ago (%) - White
Geographical mobility - Same house 1 year ago (%) - Black or African American
Geographical mobility - Same house 1 year ago (%) - Asian
Geographical mobility - Same house 1 year ago (%) - Hispanic or Latino
Geographical mobility - Same house 1 year ago (%) - American Indian and Alaska Native
Geographical mobility - Same house 1 year ago (%) - Multirace
Geographical mobility - Same house 1 year ago (%) - Other Race
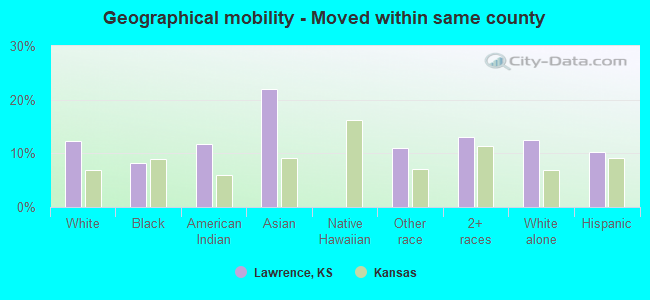
Geographical mobility - Moved within same county (%)
Geographical mobility - Moved within same county (%) - White
Geographical mobility - Moved within same county (%) - Black or African American
Geographical mobility - Moved within same county (%) - Asian
Geographical mobility - Moved within same county (%) - Hispanic or Latino
Geographical mobility - Moved within same county (%) - American Indian and Alaska Native
Geographical mobility - Moved within same county (%) - Multirace
Geographical mobility - Moved within same county (%) - Other Race
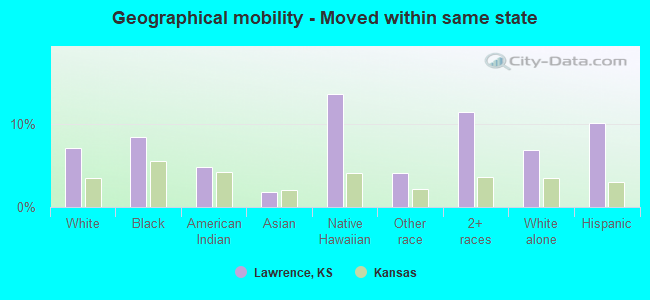
Geographical mobility - Moved from different county within same state (%)
Geographical mobility - Moved from different county within same state (%) - White
Geographical mobility - Moved from different county within same state (%) - Black or African American
Geographical mobility - Moved from different county within same state (%) - Asian
Geographical mobility - Moved from different county within same state (%) - Hispanic or Latino
Geographical mobility - Moved from different county within same state (%) - American Indian and Alaska Native
Geographical mobility - Moved from different county within same state (%) - Multirace
Geographical mobility - Moved from different county within same state (%) - Other Race
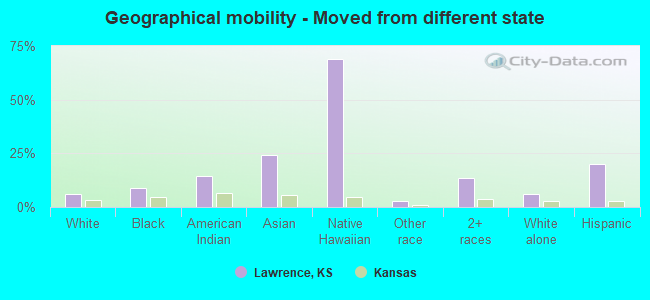
Geographical mobility - Moved from different state (%)
Geographical mobility - Moved from different state (%) - White
Geographical mobility - Moved from different state (%) - Black or African American
Geographical mobility - Moved from different state (%) - Asian
Geographical mobility - Moved from different state (%) - Hispanic or Latino
Geographical mobility - Moved from different state (%) - American Indian and Alaska Native
Geographical mobility - Moved from different state (%) - Multirace
Geographical mobility - Moved from different state (%) - Other Race
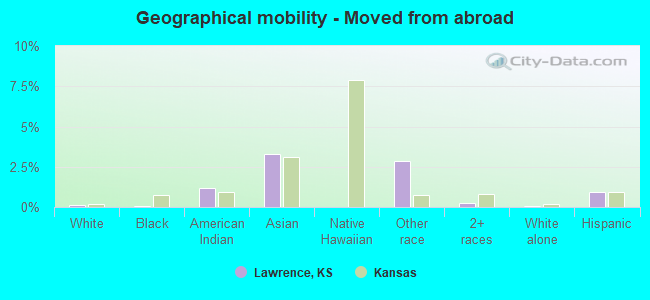
Geographical mobility - Moved from abroad (%)
Geographical mobility - Moved from abroad (%) - White
Geographical mobility - Moved from abroad (%) - Black or African American
Geographical mobility - Moved from abroad (%) - Asian
Geographical mobility - Moved from abroad (%) - Hispanic or Latino
Geographical mobility - Moved from abroad (%) - American Indian and Alaska Native
Geographical mobility - Moved from abroad (%) - Multirace
Geographical mobility - Moved from abroad (%) - Other Race
Place of birth for the foreign-born population - Ireland (%)
Place of birth for the foreign-born population - Denmark (%)
Place of birth for the foreign-born population - Norway (%)
Place of birth for the foreign-born population - Sweden (%)
Place of birth for the foreign-born population - United Kingdom (%)
Place of birth for the foreign-born population - England (%)
Place of birth for the foreign-born population - Scotland (%)
Place of birth for the foreign-born population - Other Northern Europe (%)
Place of birth for the foreign-born population - Austria (%)
Place of birth for the foreign-born population - Belgium (%)
Place of birth for the foreign-born population - France (%)
Place of birth for the foreign-born population - Germany (%)
Place of birth for the foreign-born population - Netherlands (%)
Place of birth for the foreign-born population - Switzerland (%)
Place of birth for the foreign-born population - Other Western Europe (%)
Place of birth for the foreign-born population - Greece (%)
Place of birth for the foreign-born population - Italy (%)
Place of birth for the foreign-born population - Portugal (%)
Place of birth for the foreign-born population - Spain (%)
Place of birth for the foreign-born population - Other Southern Europe (%)
Place of birth for the foreign-born population - Albania (%)
Place of birth for the foreign-born population - Belarus (%)
Place of birth for the foreign-born population - Bosnia and Herzegovina (%)
Place of birth for the foreign-born population - Bulgaria (%)
Place of birth for the foreign-born population - Croatia (%)
Place of birth for the foreign-born population - Czechoslovakia (%)
Place of birth for the foreign-born population - Hungary (%)
Place of birth for the foreign-born population - Latvia (%)
Place of birth for the foreign-born population - Lithuania (%)
Place of birth for the foreign-born population - North Macedonia (Macedonia) (%)
Place of birth for the foreign-born population - Moldova (%)
Place of birth for the foreign-born population - Poland (%)
Place of birth for the foreign-born population - Romania (%)
Place of birth for the foreign-born population - Russia (%)
Place of birth for the foreign-born population - Serbia (%)
Place of birth for the foreign-born population - Ukraine (%)
Place of birth for the foreign-born population - Other Eastern Europe (%)
Place of birth for the foreign-born population - China (%)
Place of birth for the foreign-born population - Hong Kong (%)
Place of birth for the foreign-born population - Taiwan (%)
Place of birth for the foreign-born population - Japan (%)
Place of birth for the foreign-born population - Korea (%)
Place of birth for the foreign-born population - Other Eastern Asia (%)
Place of birth for the foreign-born population - Afghanistan (%)
Place of birth for the foreign-born population - Bangladesh (%)
Place of birth for the foreign-born population - India (%)
Place of birth for the foreign-born population - Iran (%)
Place of birth for the foreign-born population - Kazakhstan (%)
Place of birth for the foreign-born population - Nepal (%)
Place of birth for the foreign-born population - Pakistan (%)
Place of birth for the foreign-born population - Sri Lanka (%)
Place of birth for the foreign-born population - Uzbekistan (%)
Place of birth for the foreign-born population - Other South Central Asia (%)
Place of birth for the foreign-born population - Burma (%)
Place of birth for the foreign-born population - Cambodia (%)
Place of birth for the foreign-born population - Indonesia (%)
Place of birth for the foreign-born population - Laos (%)
Place of birth for the foreign-born population - Malaysia (%)
Place of birth for the foreign-born population - Philippines (%)
Place of birth for the foreign-born population - Singapore (%)
Place of birth for the foreign-born population - Thailand (%)
Place of birth for the foreign-born population - Vietnam (%)
Place of birth for the foreign-born population - Other South Eastern Asia (%)
Place of birth for the foreign-born population - Armenia (%)
Place of birth for the foreign-born population - Iraq (%)
Place of birth for the foreign-born population - Israel (%)
Place of birth for the foreign-born population - Jordan (%)
Place of birth for the foreign-born population - Kuwait (%)
Place of birth for the foreign-born population - Lebanon (%)
Place of birth for the foreign-born population - Saudi Arabia (%)
Place of birth for the foreign-born population - Syria (%)
Place of birth for the foreign-born population - Turkey (%)
Place of birth for the foreign-born population - Yemen (%)
Place of birth for the foreign-born population - Other Western Asia (%)
Place of birth for the foreign-born population - Eritrea (%)
Place of birth for the foreign-born population - Ethiopia (%)
Place of birth for the foreign-born population - Kenya (%)
Place of birth for the foreign-born population - Somalia (%)
Place of birth for the foreign-born population - Uganda (%)
Place of birth for the foreign-born population - Zimbabwe (%)
Place of birth for the foreign-born population - Other Eastern Africa (%)
Place of birth for the foreign-born population - Cameroon (%)
Place of birth for the foreign-born population - Congo (%)
Place of birth for the foreign-born population - Democratic Republic of Congo (Zaire) (%)
Place of birth for the foreign-born population - Other Middle Africa (%)
Place of birth for the foreign-born population - Egypt (%)
Place of birth for the foreign-born population - Morocco (%)
Place of birth for the foreign-born population - Sudan (%)
Place of birth for the foreign-born population - Other Northern Africa (%)
Place of birth for the foreign-born population - South Africa (%)
Place of birth for the foreign-born population - Other Southern Africa (%)
Place of birth for the foreign-born population - Cabo Verde (%)
Place of birth for the foreign-born population - Ghana (%)
Place of birth for the foreign-born population - Liberia (%)
Place of birth for the foreign-born population - Nigeria (%)
Place of birth for the foreign-born population - Senegal (%)
Place of birth for the foreign-born population - Sierra Leone (%)
Place of birth for the foreign-born population - Other Western Africa (%)
Place of birth for the foreign-born population - Australia (%)
Place of birth for the foreign-born population - New Zealand (%)
Place of birth for the foreign-born population - Fiji (%)
Place of birth for the foreign-born population - Micronesia (%)
Place of birth for the foreign-born population - Bahamas (%)
Place of birth for the foreign-born population - Barbados (%)
Place of birth for the foreign-born population - Cuba (%)
Place of birth for the foreign-born population - Dominica (%)
Place of birth for the foreign-born population - Dominican Republic (%)
Place of birth for the foreign-born population - Grenada (%)
Place of birth for the foreign-born population - Haiti (%)
Place of birth for the foreign-born population - Jamaica (%)
Place of birth for the foreign-born population - St. Vincent and the Grenadines (%)
Place of birth for the foreign-born population - Trinidad and Tobago (%)
Place of birth for the foreign-born population - West Indies (%)
Place of birth for the foreign-born population - Other Caribbean (%)
Place of birth for the foreign-born population - Belize (%)
Place of birth for the foreign-born population - Costa Rica (%)
Place of birth for the foreign-born population - El Salvador (%)
Place of birth for the foreign-born population - Guatemala (%)
Place of birth for the foreign-born population - Honduras (%)
Place of birth for the foreign-born population - Mexico (%)
Place of birth for the foreign-born population - Nicaragua (%)
Place of birth for the foreign-born population - Panama (%)
Place of birth for the foreign-born population - Other Central America (%)
Place of birth for the foreign-born population - Argentina (%)
Place of birth for the foreign-born population - Bolivia (%)
Place of birth for the foreign-born population - Brazil (%)
Place of birth for the foreign-born population - Chile (%)
Place of birth for the foreign-born population - Colombia (%)
Place of birth for the foreign-born population - Ecuador (%)
Place of birth for the foreign-born population - Guyana (%)
Place of birth for the foreign-born population - Peru (%)
Place of birth for the foreign-born population - Uruguay (%)
Place of birth for the foreign-born population - Venezuela (%)
Place of birth for the foreign-born population - Other South America (%)
Place of birth for the foreign-born population - Canada (%)
Place of birth for the foreign-born population - Other Northern America (%)
Place of birth for the foreign-born population - Other (%)
Latest news about races in Lawrence, KS collected exclusively by city-data.com from local newspapers, TV, and radio stations
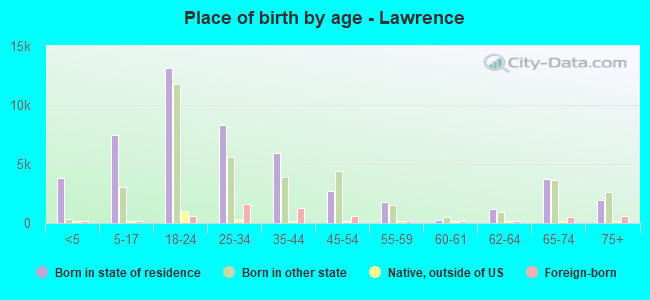
According to 2022 data, the most numerous races in Lawrence, KS are White alone (71,384 residents), Hispanic (7,559 residents), and Black alone (3,415 residents). 90.1% of Lawrence residents speak English at home. 7.8% of Lawrence, KS residents are foreign-born (5.1% born in Asia, 1.3% born in Latin America), which is 10.5% greater than the foreign-born rate of 7.0% across the entire state of Kansas.
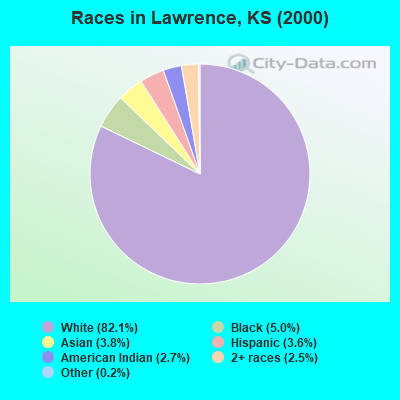
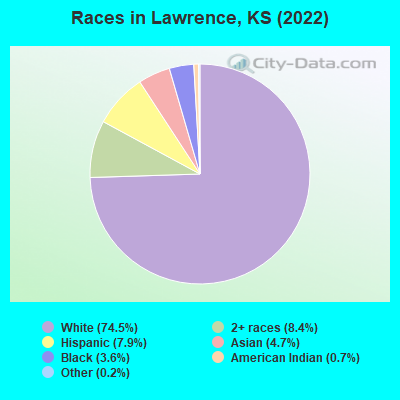
Race distribution in Lawrence
2000 2022
65,774 82.1% White alone 3,989 5.0% Black alone 3,013 3.8% Asian alone 2,921 3.6% Hispanic 2,201 2.7% American Indian alone 2,029 2.5% Two or more races 122 0.2% Other race alone 49 0.06% Native Hawaiian and Other
71,384 74.5% White alone 8,053 8.4% Two or more races 7,559 7.9% Hispanic 4,456 4.7% Asian alone 3,415 3.6% Black alone 691 0.7% American Indian alone 204 0.2% Other race alone 22 0.02% Native Hawaiian and Other
2000 2022
2,233,997 83.1% White alone 188,252 7.0% Hispanic 151,407 5.6% Black alone 46,301 1.7% Asian alone 42,508 1.6% Two or more races 22,322 0.8% American Indian alone 2,477 0.09% Other race alone 1,154 0.04% Native Hawaiian and Other
2,147,943 73.1% White alone 381,746 13.0% Hispanic 147,666 5.0% Black alone 145,362 4.9% Two or more races 85,085 2.9% Asian alone 13,263 0.5% Other race alone 12,065 0.4% American Indian alone 4,020 0.1% Native Hawaiian and Other
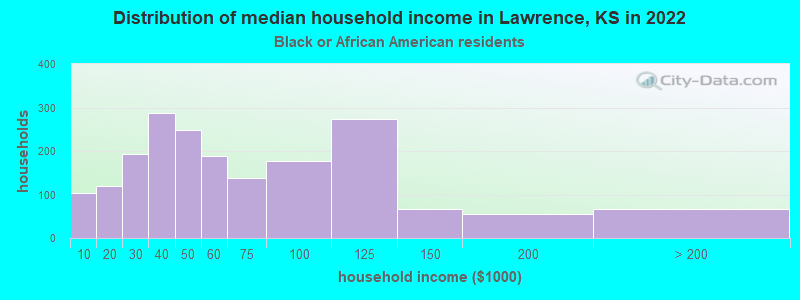
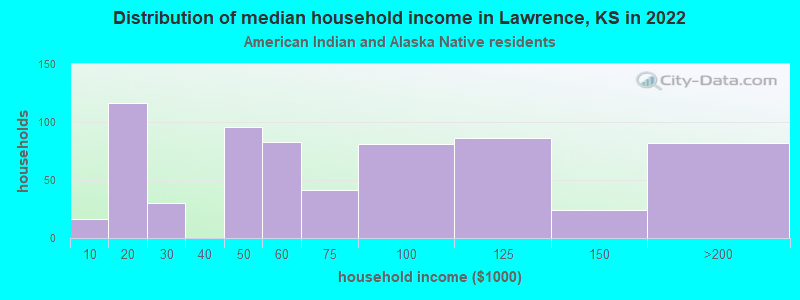
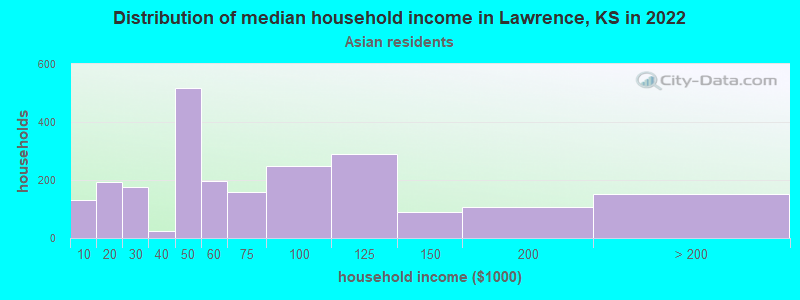
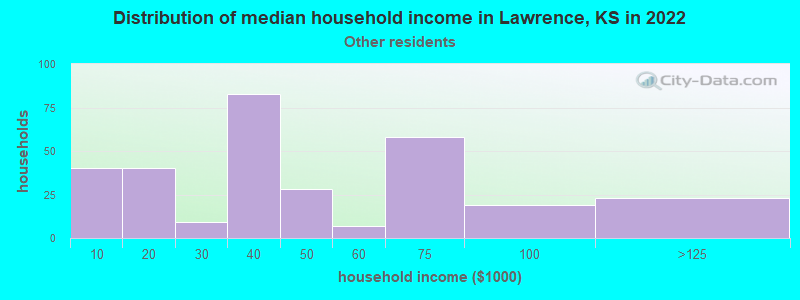
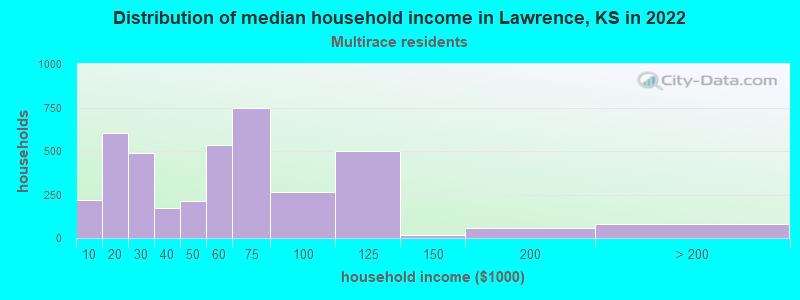
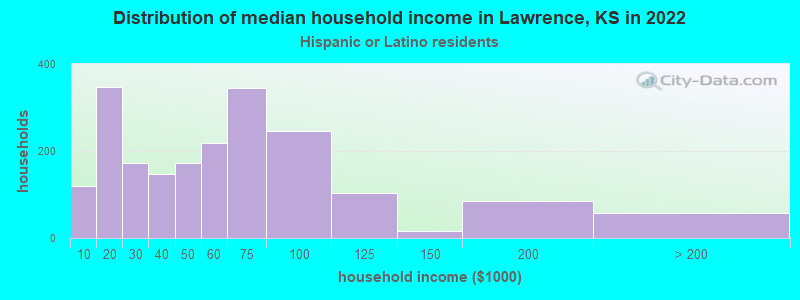
Income and house value in Lawrence Median household income in 2022 $58,880 White non-Hispanic householders$51,832 Black householders$28,650 American Indian and Alaska Native householders$52,234 Asian householders$68,021 Two or more races householders$81,540 Hispanic or Latino race householdersMedian 2022 house value $308,132 White Non-Hispanic householders$254,454 Black or African American householders$221,937 American Indian or Alaska Native householders $329,293 Asian householders$333,939 Some other race householders$277,680 Two or more races householders$301,422 Hispanic or Latino householders
Median age by race in Lawrence
29.6 Median age for White residents28.4 30.8 22.9 Median age for Black or African American residents22.1 25.6 43.6 Median age for American Indian / Alaska Native residents46.2 43.5 32.2 Median age for Asian residents38.3 28.0 -666,666,666.0 Median age for Native Hawaiian / Pacific Islander residents-666,666,666.0 -666,666,666.0 24.4 Median age for Other race residents25.1 20.2 24.8 Median age for Two or more races residents23.9 24.9 30.0 Median age for White alone residents28.8 30.9 23.4 Median age for Hispanic or Latino residents26.3 22.6
Owner/renter occupied households by race in Lawrence
House owners and renters - White residents 16,024 47.0% Owner occupied18,072 53.0% Renter occupiedHouse owners and renters - Black or African American residents 461 42.3% Owner occupied630 57.7% Renter occupiedHouse owners and renters - American Indian / Alaska Native residents 286 42.0% Owner occupied395 58.0% Renter occupiedHouse owners and renters - Asian residents 895 47.0% Owner occupied1,008 53.0% Renter occupiedHouse owners and renters - Other race residents 69 22.8% Owner occupied234 77.2% Renter occupiedHouse owners and renters - Two or more races residents 1,106 28.7% Owner occupied2,745 71.3% Renter occupiedHouse owners and renters - White alone residents 15,801 48.3% Owner occupied16,913 51.7% Renter occupiedHouse owners and renters - Hispanic or Latino residents 660 28.3% Owner occupied1,671 71.7% Renter occupied
Language usage in Lawrence
English speakers - Total 90.1% of residents of Lawrence speak English at home.
3.9% of residents speak Spanish at home 2,881 80.5% Speak English very well700 19.5% Speak English less than very well6.0% of residents speak other language at home 3,866 70.9% Speak English very well1,590 29.1% Speak English less than very well
English speakers - Born in the United States 91.7% of residents of Lawrence speak English at home.
5.9% of residents speak Spanish at home 1,881 83.6% Speak English very well368 16.4% Speak English less than very well2.3% of residents speak other language at home 794 89.4% Speak English very well94 10.6% Speak English less than very well
English speakers - Native, born elsewhere 94.6% of residents of Lawrence speak English at home.
5.4% of residents speak other language at home 95 100.0% Speak English very well
English speakers - Foreign-born 17.8% of residents of Lawrence speak English at home.
14.2% of residents speak Spanish at home 542 68.8% Speak English very well246 31.2% Speak English less than very well68.0% of residents speak other language at home 2,460 65.2% Speak English very well1,313 34.8% Speak English less than very well
White (Caucasian) - Speak only English Native:
97.9% (69,038)Foreign-born:
56.3% (690)
White (Caucasian) - Speak another language Native:
2.1% (1,485)Foreign-born:
43.7% (535)
Black or African American - Speak only English Native:
93.4% (3,622)Foreign-born:
7.3% (31)
Black or African American - Speak another language Native:
7.0% (270)Foreign-born:
91.6% (388)
American Indian / Alaska Native - Speak another language Native:
16.9% (309)Foreign-born:
100.0% (116)
Asian - Speak only English Native:
23.2% (196)Foreign-born:
2.9% (92)
Asian - Speak another language Native:
76.8% (650)Foreign-born:
97.1% (3,069)
Other race - Speak only English Native:
72.6% (726)Foreign-born:
12.5% (41)
Other race - Speak another language Native:
31.3% (313)Foreign-born:
88.7% (293)
Two or more races - Speak only English Native:
87.4% (7,755)Foreign-born:
5.1% (57)
Two or more races - Speak another language Native:
10.6% (937)Foreign-born:
95.3% (1,062)
White alone - Speak only English Native:
98.7% (67,209)Foreign-born:
62.6% (690)
White alone - Speak another language Native:
1.3% (894)Foreign-born:
37.4% (412)
Hispanic or Latino - Speak only English Native:
61.2% (3,860)Foreign-born:
8.3% (81)
Hispanic or Latino - Speak another language Native:
38.8% (2,446)Foreign-born:
91.7% (897)
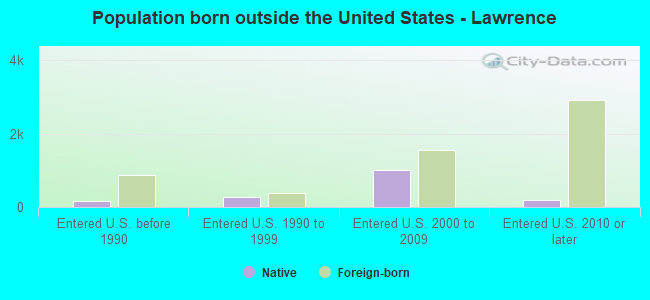
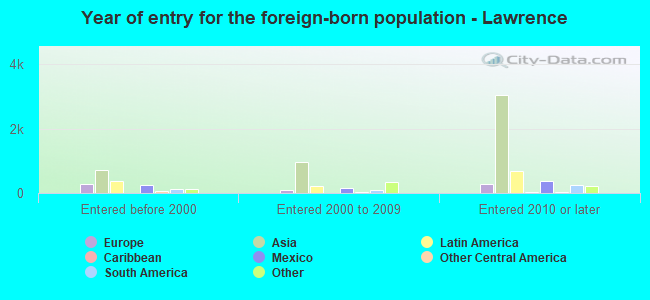
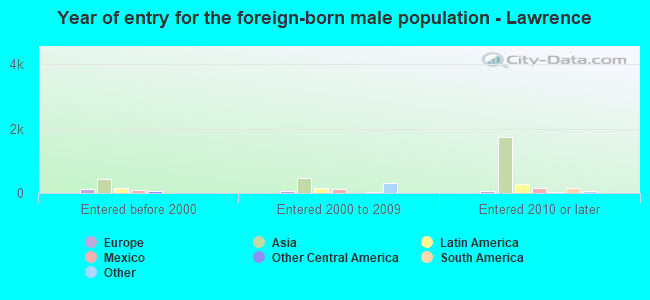
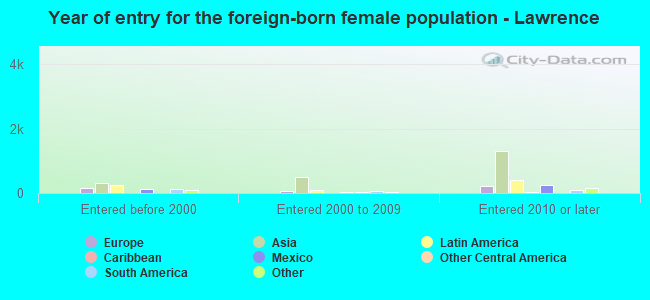
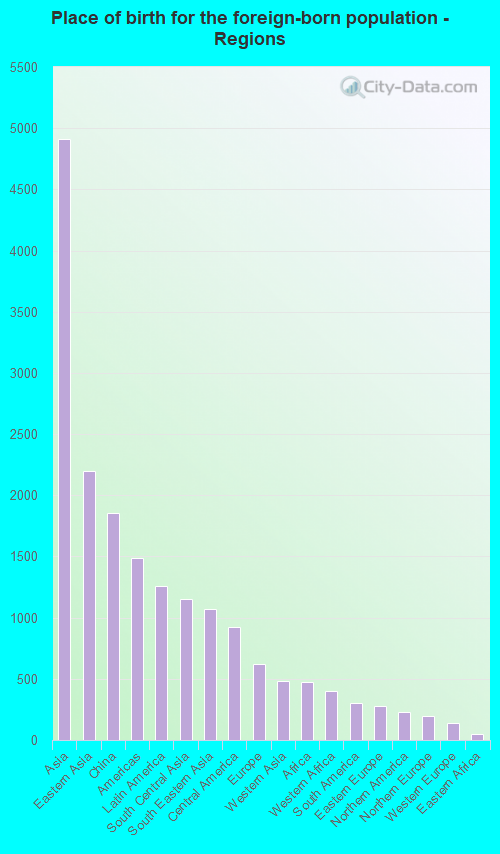
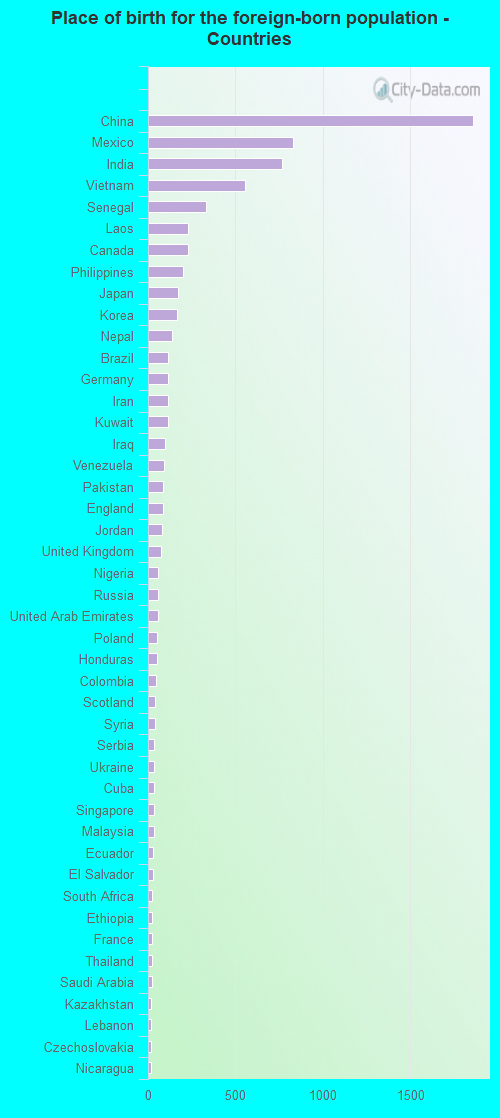
Foreign-born residents in Lawrence 7,490 residents are foreign born (5.1% Asia , 1.3% Latin America ).
This city:
7.8%Kansas:
7.1%
Marital status for residents in Lawrence Marital status - White (Caucasian) population 15 years and over
Males 52.5% Never married38.6% Now married0.0% Separated2.7% Widowed6.1% DivorcedFemales 47.5% Never married32.9% Now married0.7% Separated6.1% Widowed12.7% DivorcedWomen who gave birth in the past 12 months Now married:
67.8% (356)Unmarried:
32.2% (169)
Women who did not give birth in the past 12 months Now married:
23.8% (5,199)Unmarried:
76.2% (16,622)
Marital status - Black or African American population 15 years and over
Males 63.1% Never married29.5% Now married3.1% Separated0.6% Widowed3.7% DivorcedFemales 58.0% Never married18.8% Now married2.6% Separated13.1% Widowed7.7% DivorcedWomen who did not give birth in the past 12 months Now married:
19.3% (251)Unmarried:
80.7% (1,048)
Marital status - American Indian / Alaska Native population 15 years and over
Males 69.5% Never married22.5% Now married0.0% Separated0.0% Widowed8.0% DivorcedFemales 56.0% Never married28.2% Now married1.3% Separated5.2% Widowed9.2% DivorcedWomen who did not give birth in the past 12 months Now married:
24.2% (204)Unmarried:
75.8% (640)
Marital status - Asian population 15 years and over
Males 61.8% Never married38.2% Now married0.0% Separated0.0% Widowed0.0% DivorcedFemales 56.9% Never married39.3% Now married0.0% Separated3.0% Widowed0.9% DivorcedWomen who gave birth in the past 12 months Now married:
80.5% (360)Unmarried:
19.5% (87)
Women who did not give birth in the past 12 months Now married:
45.9% (605)Unmarried:
54.1% (714)
Marital status - Native Hawaiian / Pacific Islander population 15 years and over
Males 100.0% Never married0.0% Now married0.0% Separated0.0% Widowed0.0% DivorcedFemales 100.0% Never married0.0% Now married0.0% Separated0.0% Widowed0.0% DivorcedWomen who did not give birth in the past 12 months Now married:
0.0% (0)Unmarried:
100.0% (20)
Marital status - Other race population 15 years and over
Males 69.9% Never married26.6% Now married0.0% Separated0.0% Widowed3.4% DivorcedFemales 58.3% Never married37.7% Now married0.0% Separated2.5% Widowed1.6% DivorcedWomen who gave birth in the past 12 months Now married:
100.0% (55)Unmarried:
0.0% (0)
Women who did not give birth in the past 12 months Now married:
18.9% (77)Unmarried:
81.1% (329)
Marital status - Two or more races population 15 years and over
Males 57.1% Never married34.7% Now married3.3% Separated0.0% Widowed4.9% DivorcedFemales 55.2% Never married37.1% Now married0.6% Separated2.2% Widowed4.8% DivorcedWomen who gave birth in the past 12 months Now married:
91.5% (482)Unmarried:
8.5% (45)
Women who did not give birth in the past 12 months Now married:
38.8% (1,143)Unmarried:
61.2% (1,800)
Marital status - White alone, not Hispanic / Latino population 15 years and over
Males 51.5% Never married39.7% Now married0.0% Separated2.8% Widowed6.0% DivorcedFemales 47.3% Never married32.7% Now married0.7% Separated6.1% Widowed13.2% DivorcedWomen who gave birth in the past 12 months Now married:
67.8% (356)Unmarried:
32.2% (169)
Women who did not give birth in the past 12 months Now married:
24.0% (5,058)Unmarried:
76.0% (16,046)
Marital status - Hispanic or Latino population 15 years and over
Males 63.8% Never married28.6% Now married0.5% Separated0.0% Widowed7.1% DivorcedFemales 55.6% Never married32.5% Now married1.8% Separated3.1% Widowed6.9% DivorcedWomen who gave birth in the past 12 months Now married:
86.3% (66)Unmarried:
13.7% (11)
Women who did not give birth in the past 12 months Now married:
31.3% (636)Unmarried:
68.7% (1,395)
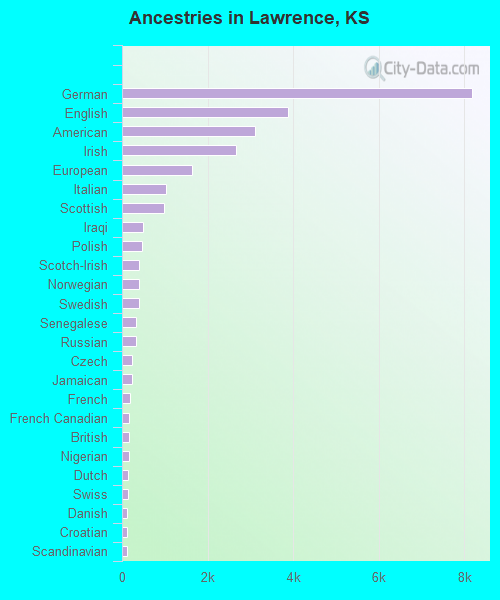
Ancestries in Lawrence
8,173 18.9% German3,889 9.0% English3,116 7.2% American2,658 6.1% Irish1,642 3.8% European1,026 2.4% Italian972 2.2% Scottish486 1.1% Iraqi472 1.1% Polish408 0.9% Scotch-Irish398 0.9% Norwegian395 0.9% Swedish328 0.8% Senegalese323 0.7% Russian239 0.6% Czech226 0.5% Jamaican197 0.5% French168 0.4% French Canadian157 0.4% British154 0.4% Nigerian142 0.3% Dutch130 0.3% Swiss128 0.3% Danish126 0.3% Croatian108 0.2% Scandinavian108 0.2% Ukrainian101 0.2% African99 0.2% Welsh96 0.2% Hungarian93 0.2% Greek72 0.2% Iranian64 0.1% Egyptian63 0.1% Northern European49 0.1% Jordanian43 0.10% Eastern European41 0.09% Macedonian41 0.09% Czechoslovakian37 0.09% Slavic36 0.08% Brazilian35 0.08% Serbian35 0.08% Canadian34 0.08% Belgian30 0.07% Lebanese25 0.06% Syrian23 0.05% Finnish23 0.05% Lithuanian22 0.05% Slovak19 0.04% Ethiopian18 0.04% Arab14 0.03% Palestinian9 0.02% Austrian7 0.02% Yugoslavian5 0.01% Romanian
Geographical mobility in Lawrence Same house 1 year ago 54,636 74.2% White (Caucasian)2,646 74.6% Black or African American1,511 67.9% American Indian / Alaska Native2,108 48.9% Asian4 17.6% Native Hawaiian / Pacific Islander905 69.5% Other race7,093 61.6% Two or more races52,717 74.2% White alone, not Hispanic / Latino4,406 58.7% Hispanic or LatinoMoved within same county 9,046 12.3% White / Caucasian294 8.3% Black or African American259 11.7% American Indian / Alaska Native945 21.9% Asian144 11.0% Other race1,506 13.1% Two or more races8,926 12.6% White alone, not Hispanic / Latino762 10.2% Hispanic or LatinoMoved within same state 5,220 7.1% White / Caucasian300 8.5% Black or African American108 4.9% American Indian / Alaska Native77 1.8% Asian3 13.7% Native Hawaiian / Pacific Islander54 4.1% Other race1,323 11.5% Two or more races4,942 7.0% White alone, not Hispanic / Latino767 10.2% Hispanic or LatinoMoved from different state 4,606 6.3% White / Caucasian306 8.6% Black or African American323 14.5% American Indian / Alaska Native1,039 24.1% Asian17 69.1% Native Hawaiian / Pacific Islander35 2.7% Other race1,566 13.6% Two or more races4,419 6.2% White alone, not Hispanic / Latino1,497 20.0% Hispanic or LatinoMoved from abroad 90 0.1% White2 0.1% Black or African American26 1.2% American Indian / Alaska Native141 3.3% Asian37 2.9% Other race29 0.3% Two or more races51 0.1% White alone, not Hispanic / Latino68 0.9% Hispanic or Latino
Children Nativity (place of birth) in Lawrence
Children under 6 years - Living with two parents Both parents native 3,047 100.0% Native0 0.0% Foreign-bornBoth parents foreign-born 554 96.1% Native22 3.9% Foreign-bornOne native, one foreign-born parent 346 100.0% NativeChildren under 6 years - Living with one parent Native parent 1,206 100.0% NativeForeign-born parent 8 100.0% NativeChildren 6 to 17 years - Living with two parents Both parents native 5,947 100.0% NativeBoth parents foreign-born 230 58.9% Native160 41.1% Foreign-bornOne native, one foreign-born parent 495 100.0% NativeChildren 6 to 17 years - Living with one parent Native parent 2,900 100.0% NativeForeign-born parent 19 50.2% Native18 49.8% Foreign-born
Grandparents responsible for own grandchildren in Lawrence
Grandparents (30 to 59 years) White / Caucasian 36 40.7% Responsible for grandchildren52 59.3% Not responsible for grandchildrenAsian 67 100.0% Not responsible for grandchildrenTwo or more races 162 100.0% Responsible for grandchildrenWhite alone, not Hispanic / Latino 38 40.1% Responsible for grandchildren56 59.9% Not responsible for grandchildrenHispanic or Latino 61 100.0% Responsible for grandchildrenGrandparents (60 years and over) White / Caucasian 13 7.8% Responsible for grandchildren158 92.2% Not responsible for grandchildrenAsian 76 100.0% Not responsible for grandchildrenTwo or more races 44 100.0% Not responsible for grandchildrenWhite alone, not Hispanic / Latino 14 7.4% Responsible for grandchildren174 92.6% Not responsible for grandchildren