Races in Lawton, Oklahoma (OK) Detailed Stats
Data:
Races - White alone (%)
Races - White alone (% change since 2000)
Races - Black alone (%)
Races - Black alone (% change since 2000)
Races - American Indian alone (%)
Races - American Indian alone (% change since 2000)
Races - Asian alone (%)
Races - Asian alone (% change since 2000)
Races - Hispanic (%)
Races - Hispanic (% change since 2000)
Races - Native Hawaiian and Other Pacific Islander alone (%)
Races - Native Hawaiian and Other Pacific Islander alone (% change since 2000)
Races - Two or more races(%)
Races - Two or more races(% change since 2000)
Races - Other race alone (%)
Races - Other race alone (% change since 2000)
Racial diversity
Place of birth - Born in state of residence (%)
Place of birth - Born in state of residence (%) - White
Place of birth - Born in state of residence (%) - Black or African American
Place of birth - Born in state of residence (%) - Asian
Place of birth - Born in state of residence (%) - Hispanic or Latino
Place of birth - Born in state of residence (%) - American Indian and Alaska Native
Place of birth - Born in state of residence (%) - Multirace
Place of birth - Born in state of residence (%) - Other Race
Place of birth - Born in other state (%)
Place of birth - Born in other state (%) - White
Place of birth - Born in other state (%) - Black or African American
Place of birth - Born in other state (%) - Asian
Place of birth - Born in other state (%) - Hispanic or Latino
Place of birth - Born in other state (%) - American Indian and Alaska Native
Place of birth - Born in other state (%) - Multirace
Place of birth - Born in other state (%) - Other Race
Place of birth - Native, outside of US (%)
Place of birth - Native, outside of US (%) - White
Place of birth - Native, outside of US (%) - Black or African American
Place of birth - Native, outside of US (%) - Asian
Place of birth - Native, outside of US (%) - Hispanic or Latino
Place of birth - Native, outside of US (%) - American Indian and Alaska Native
Place of birth - Native, outside of US (%) - Multirace
Place of birth - Native, outside of US (%) - Other Race
Place of birth - Foreign born (%)
Place of birth - Foreign born (%) - White
Place of birth - Foreign born (%) - Black or African American
Place of birth - Foreign born (%) - Asian
Place of birth - Foreign born (%) - Hispanic or Latino
Place of birth - Foreign born (%) - American Indian and Alaska Native
Place of birth - Foreign born (%) - Multirace
Place of birth - Foreign born (%) - Other Race
Residents speaking English at home (%)
Residents speaking English at home - Born in the United States (%)
Residents speaking English at home - Native, born elsewhere (%)
Residents speaking English at home - Foreign born (%)
Residents speaking Spanish at home (%)
Residents speaking Spanish at home - Born in the United States (%)
Residents speaking Spanish at home - Native, born elsewhere (%)
Residents speaking Spanish at home - Foreign born (%)
Residents speaking other language at home (%)
Residents speaking other language at home - Born in the United States (%)
Residents speaking other language at home - Native, born elsewhere (%)
Residents speaking other language at home - Foreign born (%)
Marital status - Never married (%)
Marital status - Now married (%)
Marital status - Separated (%)
Marital status - Widowed (%)
Marital status - Divorced (%)
Ancestries Reported - Arab (%)
Ancestries Reported - Czech (%)
Ancestries Reported - Danish (%)
Ancestries Reported - Dutch (%)
Ancestries Reported - English (%)
Ancestries Reported - French (%)
Ancestries Reported - French Canadian (%)
Ancestries Reported - German (%)
Ancestries Reported - Greek (%)
Ancestries Reported - Hungarian (%)
Ancestries Reported - Irish (%)
Ancestries Reported - Italian (%)
Ancestries Reported - Lithuanian (%)
Ancestries Reported - Norwegian (%)
Ancestries Reported - Polish (%)
Ancestries Reported - Portuguese (%)
Ancestries Reported - Russian (%)
Ancestries Reported - Scotch-Irish (%)
Ancestries Reported - Scottish (%)
Ancestries Reported - Slovak (%)
Ancestries Reported - Subsaharan African (%)
Ancestries Reported - Swedish (%)
Ancestries Reported - Swiss (%)
Ancestries Reported - Ukrainian (%)
Ancestries Reported - United States (%)
Ancestries Reported - Welsh (%)
Ancestries Reported - West Indian (%)
Ancestries Reported - Other (%)
Geographical mobility - Same house 1 year ago (%)
Geographical mobility - Same house 1 year ago (%) - White
Geographical mobility - Same house 1 year ago (%) - Black or African American
Geographical mobility - Same house 1 year ago (%) - Asian
Geographical mobility - Same house 1 year ago (%) - Hispanic or Latino
Geographical mobility - Same house 1 year ago (%) - American Indian and Alaska Native
Geographical mobility - Same house 1 year ago (%) - Multirace
Geographical mobility - Same house 1 year ago (%) - Other Race
Geographical mobility - Moved within same county (%)
Geographical mobility - Moved within same county (%) - White
Geographical mobility - Moved within same county (%) - Black or African American
Geographical mobility - Moved within same county (%) - Asian
Geographical mobility - Moved within same county (%) - Hispanic or Latino
Geographical mobility - Moved within same county (%) - American Indian and Alaska Native
Geographical mobility - Moved within same county (%) - Multirace
Geographical mobility - Moved within same county (%) - Other Race
Geographical mobility - Moved from different county within same state (%)
Geographical mobility - Moved from different county within same state (%) - White
Geographical mobility - Moved from different county within same state (%) - Black or African American
Geographical mobility - Moved from different county within same state (%) - Asian
Geographical mobility - Moved from different county within same state (%) - Hispanic or Latino
Geographical mobility - Moved from different county within same state (%) - American Indian and Alaska Native
Geographical mobility - Moved from different county within same state (%) - Multirace
Geographical mobility - Moved from different county within same state (%) - Other Race
Geographical mobility - Moved from different state (%)
Geographical mobility - Moved from different state (%) - White
Geographical mobility - Moved from different state (%) - Black or African American
Geographical mobility - Moved from different state (%) - Asian
Geographical mobility - Moved from different state (%) - Hispanic or Latino
Geographical mobility - Moved from different state (%) - American Indian and Alaska Native
Geographical mobility - Moved from different state (%) - Multirace
Geographical mobility - Moved from different state (%) - Other Race
Geographical mobility - Moved from abroad (%)
Geographical mobility - Moved from abroad (%) - White
Geographical mobility - Moved from abroad (%) - Black or African American
Geographical mobility - Moved from abroad (%) - Asian
Geographical mobility - Moved from abroad (%) - Hispanic or Latino
Geographical mobility - Moved from abroad (%) - American Indian and Alaska Native
Geographical mobility - Moved from abroad (%) - Multirace
Geographical mobility - Moved from abroad (%) - Other Race
Place of birth for the foreign-born population - Ireland (%)
Place of birth for the foreign-born population - Denmark (%)
Place of birth for the foreign-born population - Norway (%)
Place of birth for the foreign-born population - Sweden (%)
Place of birth for the foreign-born population - United Kingdom (%)
Place of birth for the foreign-born population - England (%)
Place of birth for the foreign-born population - Scotland (%)
Place of birth for the foreign-born population - Other Northern Europe (%)
Place of birth for the foreign-born population - Austria (%)
Place of birth for the foreign-born population - Belgium (%)
Place of birth for the foreign-born population - France (%)
Place of birth for the foreign-born population - Germany (%)
Place of birth for the foreign-born population - Netherlands (%)
Place of birth for the foreign-born population - Switzerland (%)
Place of birth for the foreign-born population - Other Western Europe (%)
Place of birth for the foreign-born population - Greece (%)
Place of birth for the foreign-born population - Italy (%)
Place of birth for the foreign-born population - Portugal (%)
Place of birth for the foreign-born population - Spain (%)
Place of birth for the foreign-born population - Other Southern Europe (%)
Place of birth for the foreign-born population - Albania (%)
Place of birth for the foreign-born population - Belarus (%)
Place of birth for the foreign-born population - Bosnia and Herzegovina (%)
Place of birth for the foreign-born population - Bulgaria (%)
Place of birth for the foreign-born population - Croatia (%)
Place of birth for the foreign-born population - Czechoslovakia (%)
Place of birth for the foreign-born population - Hungary (%)
Place of birth for the foreign-born population - Latvia (%)
Place of birth for the foreign-born population - Lithuania (%)
Place of birth for the foreign-born population - North Macedonia (Macedonia) (%)
Place of birth for the foreign-born population - Moldova (%)
Place of birth for the foreign-born population - Poland (%)
Place of birth for the foreign-born population - Romania (%)
Place of birth for the foreign-born population - Russia (%)
Place of birth for the foreign-born population - Serbia (%)
Place of birth for the foreign-born population - Ukraine (%)
Place of birth for the foreign-born population - Other Eastern Europe (%)
Place of birth for the foreign-born population - China (%)
Place of birth for the foreign-born population - Hong Kong (%)
Place of birth for the foreign-born population - Taiwan (%)
Place of birth for the foreign-born population - Japan (%)
Place of birth for the foreign-born population - Korea (%)
Place of birth for the foreign-born population - Other Eastern Asia (%)
Place of birth for the foreign-born population - Afghanistan (%)
Place of birth for the foreign-born population - Bangladesh (%)
Place of birth for the foreign-born population - India (%)
Place of birth for the foreign-born population - Iran (%)
Place of birth for the foreign-born population - Kazakhstan (%)
Place of birth for the foreign-born population - Nepal (%)
Place of birth for the foreign-born population - Pakistan (%)
Place of birth for the foreign-born population - Sri Lanka (%)
Place of birth for the foreign-born population - Uzbekistan (%)
Place of birth for the foreign-born population - Other South Central Asia (%)
Place of birth for the foreign-born population - Burma (%)
Place of birth for the foreign-born population - Cambodia (%)
Place of birth for the foreign-born population - Indonesia (%)
Place of birth for the foreign-born population - Laos (%)
Place of birth for the foreign-born population - Malaysia (%)
Place of birth for the foreign-born population - Philippines (%)
Place of birth for the foreign-born population - Singapore (%)
Place of birth for the foreign-born population - Thailand (%)
Place of birth for the foreign-born population - Vietnam (%)
Place of birth for the foreign-born population - Other South Eastern Asia (%)
Place of birth for the foreign-born population - Armenia (%)
Place of birth for the foreign-born population - Iraq (%)
Place of birth for the foreign-born population - Israel (%)
Place of birth for the foreign-born population - Jordan (%)
Place of birth for the foreign-born population - Kuwait (%)
Place of birth for the foreign-born population - Lebanon (%)
Place of birth for the foreign-born population - Saudi Arabia (%)
Place of birth for the foreign-born population - Syria (%)
Place of birth for the foreign-born population - Turkey (%)
Place of birth for the foreign-born population - Yemen (%)
Place of birth for the foreign-born population - Other Western Asia (%)
Place of birth for the foreign-born population - Eritrea (%)
Place of birth for the foreign-born population - Ethiopia (%)
Place of birth for the foreign-born population - Kenya (%)
Place of birth for the foreign-born population - Somalia (%)
Place of birth for the foreign-born population - Uganda (%)
Place of birth for the foreign-born population - Zimbabwe (%)
Place of birth for the foreign-born population - Other Eastern Africa (%)
Place of birth for the foreign-born population - Cameroon (%)
Place of birth for the foreign-born population - Congo (%)
Place of birth for the foreign-born population - Democratic Republic of Congo (Zaire) (%)
Place of birth for the foreign-born population - Other Middle Africa (%)
Place of birth for the foreign-born population - Egypt (%)
Place of birth for the foreign-born population - Morocco (%)
Place of birth for the foreign-born population - Sudan (%)
Place of birth for the foreign-born population - Other Northern Africa (%)
Place of birth for the foreign-born population - South Africa (%)
Place of birth for the foreign-born population - Other Southern Africa (%)
Place of birth for the foreign-born population - Cabo Verde (%)
Place of birth for the foreign-born population - Ghana (%)
Place of birth for the foreign-born population - Liberia (%)
Place of birth for the foreign-born population - Nigeria (%)
Place of birth for the foreign-born population - Senegal (%)
Place of birth for the foreign-born population - Sierra Leone (%)
Place of birth for the foreign-born population - Other Western Africa (%)
Place of birth for the foreign-born population - Australia (%)
Place of birth for the foreign-born population - New Zealand (%)
Place of birth for the foreign-born population - Fiji (%)
Place of birth for the foreign-born population - Micronesia (%)
Place of birth for the foreign-born population - Bahamas (%)
Place of birth for the foreign-born population - Barbados (%)
Place of birth for the foreign-born population - Cuba (%)
Place of birth for the foreign-born population - Dominica (%)
Place of birth for the foreign-born population - Dominican Republic (%)
Place of birth for the foreign-born population - Grenada (%)
Place of birth for the foreign-born population - Haiti (%)
Place of birth for the foreign-born population - Jamaica (%)
Place of birth for the foreign-born population - St. Vincent and the Grenadines (%)
Place of birth for the foreign-born population - Trinidad and Tobago (%)
Place of birth for the foreign-born population - West Indies (%)
Place of birth for the foreign-born population - Other Caribbean (%)
Place of birth for the foreign-born population - Belize (%)
Place of birth for the foreign-born population - Costa Rica (%)
Place of birth for the foreign-born population - El Salvador (%)
Place of birth for the foreign-born population - Guatemala (%)
Place of birth for the foreign-born population - Honduras (%)
Place of birth for the foreign-born population - Mexico (%)
Place of birth for the foreign-born population - Nicaragua (%)
Place of birth for the foreign-born population - Panama (%)
Place of birth for the foreign-born population - Other Central America (%)
Place of birth for the foreign-born population - Argentina (%)
Place of birth for the foreign-born population - Bolivia (%)
Place of birth for the foreign-born population - Brazil (%)
Place of birth for the foreign-born population - Chile (%)
Place of birth for the foreign-born population - Colombia (%)
Place of birth for the foreign-born population - Ecuador (%)
Place of birth for the foreign-born population - Guyana (%)
Place of birth for the foreign-born population - Peru (%)
Place of birth for the foreign-born population - Uruguay (%)
Place of birth for the foreign-born population - Venezuela (%)
Place of birth for the foreign-born population - Other South America (%)
Place of birth for the foreign-born population - Canada (%)
Place of birth for the foreign-born population - Other Northern America (%)
Place of birth for the foreign-born population - Other (%)
Latest news about races in Lawton, OK collected exclusively by city-data.com from local newspapers, TV, and radio stations
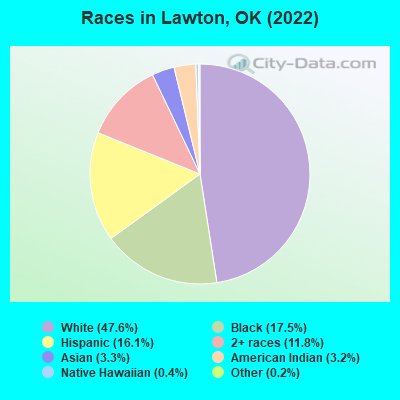
According to 2022 data, the most numerous races in Lawton, OK are White alone (43,583 residents), Hispanic (14,750 residents), and Two or more races (10,761 residents). 88.4% of Lawton residents speak English at home. 5.9% of Lawton, OK residents are foreign-born (2.0% born in Asia, 1.7% born in Latin America, 1.6% born in Europe), which is 2.5% less than the foreign-born rate of 6.0% across the entire state of Oklahoma.
Race distribution in Lawton
2000 2022
53,605 57.8% White alone 20,937 22.6% Black alone 8,719 9.4% Hispanic 3,539 3.8% Two or more races 3,200 3.4% American Indian alone 2,204 2.4% Asian alone 388 0.4% Native Hawaiian and Other 165 0.2% Other race alone
43,583 47.6% White alone 16,017 17.5% Black alone 14,750 16.1% Hispanic 10,761 11.8% Two or more races 2,992 3.3% Asian alone 2,915 3.2% American Indian alone 362 0.4% Native Hawaiian and Other 173 0.2% Other race alone
2000 2022
2,556,368 74.1% White alone 266,158 7.7% American Indian alone 257,981 7.5% Black alone 179,304 5.2% Hispanic 140,249 4.1% Two or more races 46,172 1.3% Asian alone 2,322 0.07% Other race alone 2,100 0.06% Native Hawaiian and Other
2,517,403 62.6% White alone 486,692 12.1% Hispanic 364,453 9.1% Two or more races 273,650 6.8% American Indian alone 268,543 6.7% Black alone 92,672 2.3% Asian alone 10,786 0.3% Other race alone 5,601 0.1% Native Hawaiian and Other
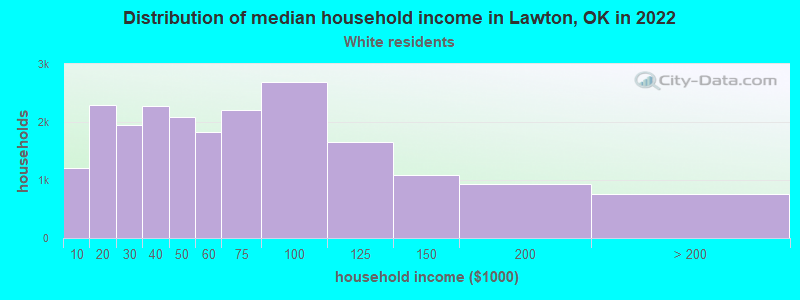
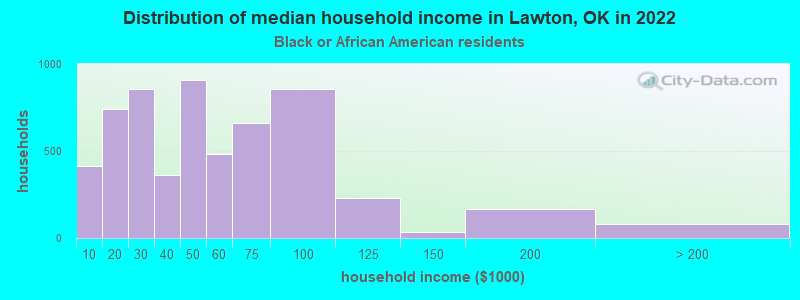
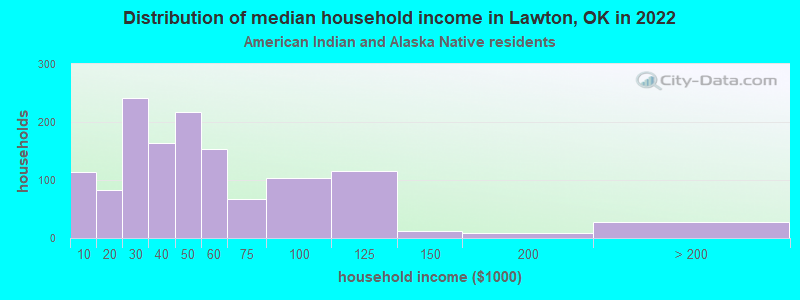
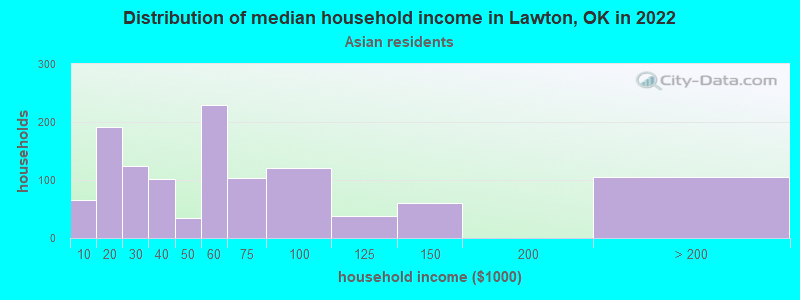
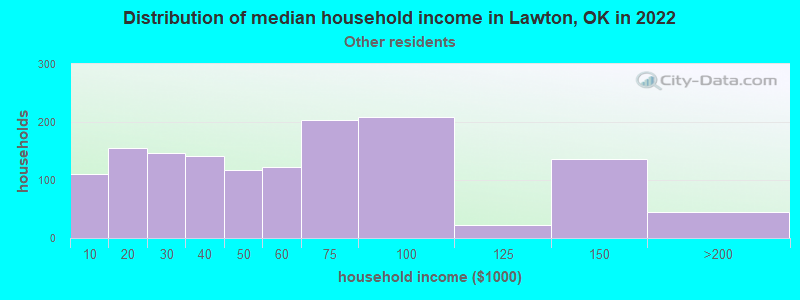
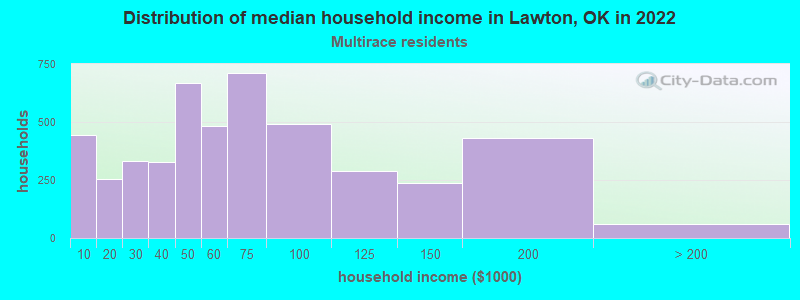
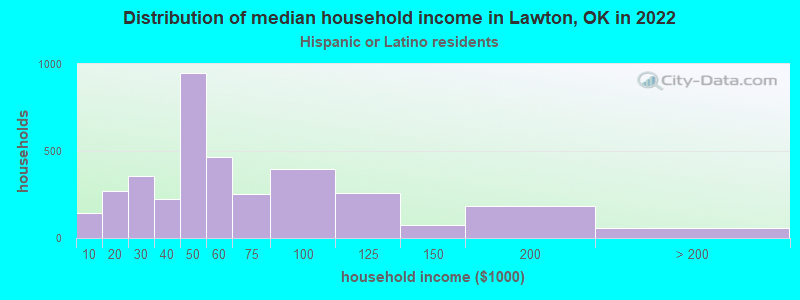
Income and house value in Lawton Median household income in 2022 $54,624 White non-Hispanic householders$44,858 Black householders$36,350 American Indian and Alaska Native householders$51,628 Asian householders$42,563 Some other race householders$58,240 Two or more races householders$46,943 Hispanic or Latino race householdersMedian 2022 house value $124,053 White Non-Hispanic householders$125,791 Black or African American householders$100,945 American Indian or Alaska Native householders $129,439 Asian householders$188,165 Native Hawaiian and other Pacific Islander householders$101,988 Some other race householders$101,640 Two or more races householders$115,018 Hispanic or Latino householders
Median age by race in Lawton
35.6 Median age for White residents33.6 39.1 32.1 Median age for Black or African American residents31.6 33.6 31.6 Median age for American Indian / Alaska Native residents31.3 32.2 37.6 Median age for Asian residents26.9 48.0 38.4 Median age for Native Hawaiian / Pacific Islander residents33.5 -666,666,666.0 34.9 Median age for Other race residents32.6 35.3 24.8 Median age for Two or more races residents24.1 25.2 37.2 Median age for White alone residents33.6 41.7 26.3 Median age for Hispanic or Latino residents28.5 23.3
Owner/renter occupied households by race in Lawton
House owners and renters - White residents 11,395 54.3% Owner occupied9,587 45.7% Renter occupiedHouse owners and renters - Black or African American residents 1,647 28.4% Owner occupied4,162 71.6% Renter occupiedHouse owners and renters - American Indian / Alaska Native residents 440 34.3% Owner occupied844 65.7% Renter occupiedHouse owners and renters - Asian residents 632 59.0% Owner occupied439 41.0% Renter occupiedHouse owners and renters - Native Hawaiian / Pacific Islander residents 63 43.7% Owner occupied82 56.3% Renter occupiedHouse owners and renters - Other race residents 215 34.2% Owner occupied413 65.8% Renter occupiedHouse owners and renters - Two or more races residents 1,753 37.1% Owner occupied2,976 62.9% Renter occupiedHouse owners and renters - White alone residents 11,006 55.6% Owner occupied8,797 44.4% Renter occupiedHouse owners and renters - Hispanic or Latino residents 1,305 35.9% Owner occupied2,328 64.1% Renter occupied
Language usage in Lawton
English speakers - Total 88.4% of residents of Lawton speak English at home.
7.5% of residents speak Spanish at home 5,142 80.2% Speak English very well1,272 19.8% Speak English less than very well4.1% of residents speak other language at home 2,595 74.1% Speak English very well906 25.9% Speak English less than very well
English speakers - Born in the United States 92.3% of residents of Lawton speak English at home.
6.8% of residents speak Spanish at home 2,728 87.7% Speak English very well381 12.3% Speak English less than very well1.0% of residents speak other language at home 307 68.4% Speak English very well142 31.6% Speak English less than very well
English speakers - Native, born elsewhere 67.7% of residents of Lawton speak English at home.
19.0% of residents speak Spanish at home 546 77.0% Speak English very well163 23.0% Speak English less than very well13.2% of residents speak other language at home 493 100.0% Speak English very well
English speakers - Foreign-born 31.7% of residents of Lawton speak English at home.
15.9% of residents speak Spanish at home 244 35.1% Speak English very well452 64.9% Speak English less than very well52.4% of residents speak other language at home 1,622 71.0% Speak English very well664 29.0% Speak English less than very well
White (Caucasian) - Speak only English Native:
93.9% (40,823)Foreign-born:
31.9% (562)
White (Caucasian) - Speak another language Native:
6.1% (2,673)Foreign-born:
68.1% (1,202)
Black or African American - Speak only English Native:
97.5% (14,719)Foreign-born:
73.0% (271)
Black or African American - Speak another language Native:
2.5% (381)Foreign-born:
27.0% (100)
American Indian / Alaska Native - Speak only English Native:
90.5% (3,651)Foreign-born:
78.3% (61)
American Indian / Alaska Native - Speak another language Native:
9.5% (385)Foreign-born:
16.4% (13)
Asian - Speak only English Native:
70.3% (1,185)Foreign-born:
26.6% (355)
Asian - Speak another language Native:
29.7% (500)Foreign-born:
73.4% (978)
Native Hawaiian / Pacific Islander - Speak only English Native:
63.8% (329)Foreign-born:
11.1% (9)
Native Hawaiian / Pacific Islander - Speak another language Native:
36.3% (187)Foreign-born:
89.8% (73)
Other race - Speak only English Native:
64.7% (1,737)Foreign-born:
1.2% (8)
Other race - Speak another language Native:
33.4% (896)Foreign-born:
98.8% (698)
Two or more races - Speak only English Native:
81.7% (12,400)Foreign-born:
28.9% (195)
Two or more races - Speak another language Native:
18.3% (2,779)Foreign-born:
71.1% (479)
White alone - Speak only English Native:
98.3% (39,098)Foreign-born:
32.5% (562)
White alone - Speak another language Native:
1.7% (685)Foreign-born:
67.5% (1,165)
Hispanic or Latino - Speak only English Native:
57.1% (6,882)Foreign-born:
29.8% (295)
Hispanic or Latino - Speak another language Native:
42.9% (5,166)Foreign-born:
70.2% (696)
Foreign-born residents in Lawton 5,384 residents are foreign born (2.0% Asia , 1.7% Latin America , 1.6% Europe ).
This city:
5.9%Oklahoma:
6.1%
Marital status for residents in Lawton Marital status - White (Caucasian) population 15 years and over
Males 37.8% Never married43.4% Now married2.4% Separated5.0% Widowed11.4% DivorcedFemales 25.7% Never married46.1% Now married3.4% Separated9.2% Widowed15.6% DivorcedWomen who gave birth in the past 12 months Now married:
51.1% (339)Unmarried:
48.9% (325)
Women who did not give birth in the past 12 months Now married:
48.7% (4,856)Unmarried:
51.3% (5,110)
Marital status - Black or African American population 15 years and over
Males 49.9% Never married31.9% Now married2.2% Separated3.5% Widowed12.5% DivorcedFemales 35.1% Never married32.3% Now married1.2% Separated7.4% Widowed24.0% DivorcedWomen who gave birth in the past 12 months Now married:
42.1% (91)Unmarried:
57.9% (125)
Women who did not give birth in the past 12 months Now married:
26.9% (905)Unmarried:
73.1% (2,459)
Marital status - American Indian / Alaska Native population 15 years and over
Males 49.7% Never married44.0% Now married3.9% Separated0.0% Widowed2.4% DivorcedFemales 34.6% Never married27.5% Now married8.0% Separated0.0% Widowed29.9% DivorcedWomen who gave birth in the past 12 months Now married:
20.0% (4)Unmarried:
80.0% (14)
Women who did not give birth in the past 12 months Now married:
36.1% (368)Unmarried:
63.9% (651)
Marital status - Asian population 15 years and over
Males 69.6% Never married30.4% Now married0.0% Separated0.0% Widowed0.0% DivorcedFemales 12.4% Never married56.6% Now married0.0% Separated22.3% Widowed8.7% DivorcedWomen who gave birth in the past 12 months Now married:
0.0% (0)Unmarried:
100.0% (41)
Women who did not give birth in the past 12 months Now married:
54.0% (394)Unmarried:
46.0% (336)
Marital status - Native Hawaiian / Pacific Islander population 15 years and over
Males 46.2% Never married38.2% Now married7.6% Separated8.0% Widowed0.0% DivorcedFemales 67.1% Never married32.9% Now married0.0% Separated0.0% Widowed0.0% DivorcedWomen who did not give birth in the past 12 months Now married:
13.0% (18)Unmarried:
87.0% (118)
Marital status - Other race population 15 years and over
Males 43.0% Never married39.0% Now married2.3% Separated2.8% Widowed12.9% DivorcedFemales 27.3% Never married37.6% Now married6.5% Separated5.7% Widowed23.0% DivorcedWomen who gave birth in the past 12 months Now married:
69.5% (106)Unmarried:
30.5% (46)
Women who did not give birth in the past 12 months Now married:
50.6% (413)Unmarried:
49.4% (403)
Marital status - Two or more races population 15 years and over
Males 55.1% Never married26.8% Now married2.2% Separated0.7% Widowed15.2% DivorcedFemales 45.6% Never married28.6% Now married5.9% Separated6.8% Widowed13.1% DivorcedWomen who gave birth in the past 12 months Now married:
49.7% (156)Unmarried:
50.3% (158)
Women who did not give birth in the past 12 months Now married:
31.0% (1,475)Unmarried:
69.0% (3,289)
Marital status - White alone, not Hispanic / Latino population 15 years and over
Males 36.4% Never married43.6% Now married2.6% Separated5.5% Widowed11.8% DivorcedFemales 24.5% Never married47.0% Now married3.4% Separated9.6% Widowed15.4% DivorcedWomen who gave birth in the past 12 months Now married:
75.7% (339)Unmarried:
24.3% (109)
Women who did not give birth in the past 12 months Now married:
49.2% (4,474)Unmarried:
50.8% (4,619)
Marital status - Hispanic or Latino population 15 years and over
Males 49.7% Never married37.8% Now married1.2% Separated0.5% Widowed10.8% DivorcedFemales 44.1% Never married34.6% Now married2.2% Separated2.6% Widowed16.5% DivorcedWomen who gave birth in the past 12 months Now married:
42.1% (204)Unmarried:
57.9% (281)
Women who did not give birth in the past 12 months Now married:
33.7% (1,273)Unmarried:
66.3% (2,503)
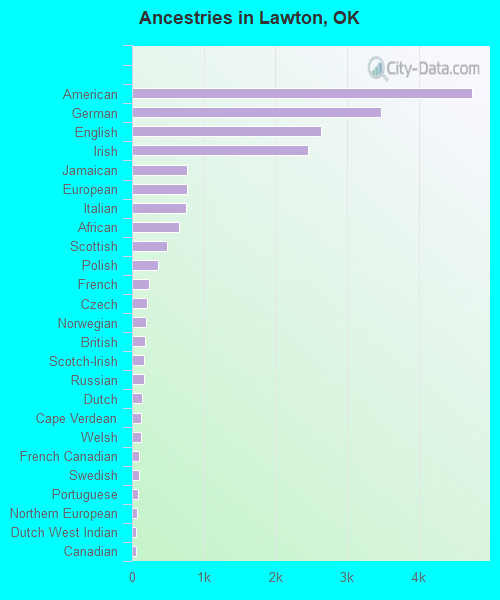
Ancestries in Lawton
4,745 10.2% American3,474 7.5% German2,639 5.7% English2,453 5.3% Irish766 1.6% Jamaican761 1.6% European749 1.6% Italian656 1.4% African485 1.0% Scottish358 0.8% Polish237 0.5% French214 0.5% Czech191 0.4% Norwegian180 0.4% British164 0.4% Scotch-Irish163 0.4% Russian134 0.3% Dutch129 0.3% Cape Verdean122 0.3% Welsh98 0.2% French Canadian94 0.2% Swedish85 0.2% Portuguese76 0.2% Northern European61 0.1% Dutch West Indian60 0.1% Canadian58 0.1% Danish50 0.1% Romanian41 0.09% Eastern European36 0.08% Kenyan35 0.08% Ghanaian31 0.07% Hungarian31 0.07% Czechoslovakian28 0.06% South African26 0.06% Cajun25 0.05% Zimbabwean25 0.05% Ukrainian19 0.04% British West Indian16 0.03% Ethiopian14 0.03% Greek14 0.03% Serbian14 0.03% Nigerian14 0.03% Austrian13 0.03% Belgian13 0.03% Australian12 0.03% Swiss12 0.03% Turkish10 0.02% Egyptian9 0.02% German Russian8 0.02% Albanian7 0.02% Scandinavian7 0.02% Slovak7 0.02% Haitian5 0.01% Finnish3 0.01% Lithuanian3 0.01% Lebanese
Geographical mobility in Lawton Same house 1 year ago 36,765 78.0% White (Caucasian)11,458 72.1% Black or African American3,004 75.7% American Indian / Alaska Native1,913 73.6% Asian442 81.7% Native Hawaiian / Pacific Islander2,615 73.5% Other race13,970 77.9% Two or more races33,770 78.1% White alone, not Hispanic / Latino10,679 74.6% Hispanic or LatinoMoved within same county 4,334 9.2% White / Caucasian2,129 13.4% Black or African American619 15.6% American Indian / Alaska Native28 1.1% Asian78 14.4% Native Hawaiian / Pacific Islander415 11.7% Other race1,636 9.1% Two or more races3,826 8.8% White alone, not Hispanic / Latino1,862 13.0% Hispanic or LatinoMoved within same state 1,285 2.7% White / Caucasian278 1.8% Black or African American234 5.9% American Indian / Alaska Native83 3.2% Asian51 1.4% Other race839 4.7% Two or more races1,285 3.0% White alone, not Hispanic / Latino533 3.7% Hispanic or LatinoMoved from different state 3,814 8.1% White / Caucasian1,736 10.9% Black or African American141 3.6% American Indian / Alaska Native557 21.4% Asian28 5.2% Native Hawaiian / Pacific Islander476 13.4% Other race1,349 7.5% Two or more races3,517 8.1% White alone, not Hispanic / Latino1,042 7.3% Hispanic or LatinoMoved from abroad 910 1.9% White283 1.8% Black or African American42 1.1% American Indian / Alaska Native59 2.3% Asian35 1.0% Other race149 0.8% Two or more races834 1.9% White alone, not Hispanic / Latino203 1.4% Hispanic or Latino
Children Nativity (place of birth) in Lawton
Children under 6 years - Living with two parents Both parents native 3,685 100.0% NativeBoth parents foreign-born 273 83.1% Native55 16.9% Foreign-bornOne native, one foreign-born parent 232 100.0% NativeChildren under 6 years - Living with one parent Native parent 2,839 100.0% NativeForeign-born parent 37 38.5% Native58 61.5% Foreign-bornChildren 6 to 17 years - Living with two parents Both parents native 5,604 100.0% NativeBoth parents foreign-born 198 91.6% Native18 8.4% Foreign-bornOne native, one foreign-born parent 451 98.2% Native8 1.8% Foreign-bornChildren 6 to 17 years - Living with one parent Native parent 5,406 100.0% NativeForeign-born parent 346 52.3% Native316 47.7% Foreign-born
Grandparents responsible for own grandchildren in Lawton
Grandparents (30 to 59 years) White / Caucasian 340 51.7% Responsible for grandchildren318 48.3% Not responsible for grandchildrenBlack or African American 61 33.8% Responsible for grandchildren120 66.2% Not responsible for grandchildrenAmerican Indian / Alaska Native 50 51.5% Responsible for grandchildren47 48.5% Not responsible for grandchildrenAsian 28 100.0% Not responsible for grandchildrenOther race 27 66.0% Responsible for grandchildren14 34.0% Not responsible for grandchildrenTwo or more races 95 69.9% Responsible for grandchildren41 30.1% Not responsible for grandchildrenWhite alone, not Hispanic / Latino 340 51.7% Responsible for grandchildren318 48.3% Not responsible for grandchildrenHispanic or Latino 98 43.5% Responsible for grandchildren128 56.5% Not responsible for grandchildrenGrandparents (60 years and over) White / Caucasian 235 41.2% Responsible for grandchildren335 58.8% Not responsible for grandchildrenBlack or African American 99 42.1% Responsible for grandchildren136 57.9% Not responsible for grandchildrenAmerican Indian / Alaska Native 45 73.0% Responsible for grandchildren17 27.0% Not responsible for grandchildrenAsian 1 100.0% Not responsible for grandchildrenOther race 9 4.2% Responsible for grandchildren207 95.8% Not responsible for grandchildrenTwo or more races 103 63.1% Responsible for grandchildren60 36.9% Not responsible for grandchildrenWhite alone, not Hispanic / Latino 235 41.2% Responsible for grandchildren335 58.8% Not responsible for grandchildrenHispanic or Latino 129 77.3% Responsible for grandchildren38 22.7% Not responsible for grandchildren